The pan-genome of Aspergillus fumigatus provides a high-resolution view of its population structure revealing high levels of lineage-specific diversity driven by recombination
- PMID: 36395320
- PMCID: PMC9714929
- DOI: 10.1371/journal.pbio.3001890
The pan-genome of Aspergillus fumigatus provides a high-resolution view of its population structure revealing high levels of lineage-specific diversity driven by recombination
Abstract
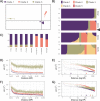
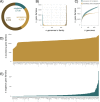
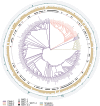
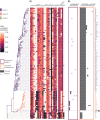
Aspergillus fumigatus is a deadly agent of human fungal disease where virulence heterogeneity is thought to be at least partially structured by genetic variation between strains. While population genomic analyses based on reference genome alignments offer valuable insights into how gene variants are distributed across populations, these approaches fail to capture intraspecific variation in genes absent from the reference genome. Pan-genomic analyses based on de novo assemblies offer a promising alternative to reference-based genomics with the potential to address the full genetic repertoire of a species. Here, we evaluate 260 genome sequences of A. fumigatus including 62 newly sequenced strains, using a combination of population genomics, phylogenomics, and pan-genomics. Our results offer a high-resolution assessment of population structure and recombination frequency, phylogenetically structured gene presence-absence variation, evidence for metabolic specificity, and the distribution of putative antifungal resistance genes. Although A. fumigatus disperses primarily via asexual conidia, we identified extraordinarily high levels of recombination with the lowest linkage disequilibrium decay value reported for any fungal species to date. We provide evidence for 3 primary populations of A. fumigatus, with recombination occurring only rarely between populations and often within them. These 3 populations are structured by both gene variation and distinct patterns of gene presence-absence with unique suites of accessory genes present exclusively in each clade. Accessory genes displayed functional enrichment for nitrogen and carbohydrate metabolism suggesting that populations may be stratified by environmental niche specialization. Similarly, the distribution of antifungal resistance genes and resistance alleles were often structured by phylogeny. Altogether, the pan-genome of A. fumigatus represents one of the largest fungal pan-genomes reported to date including many genes unrepresented in the Af293 reference genome. These results highlight the inadequacy of relying on a single-reference genome-based approach for evaluating intraspecific variation and the power of combined genomic approaches to elucidate population structure, genetic diversity, and putative ecological drivers of clinically relevant fungi.
Copyright: © 2022 Lofgren et al. This is an open access article distributed under the terms of the Creative Commons Attribution License, which permits unrestricted use, distribution, and reproduction in any medium, provided the original author and source are credited.
Conflict of interest statement
The authors have declared that no competing interests exist.
Figures


Similar articles
-
Genomic Diversity of Azole-Resistant Aspergillus fumigatus in the United States.mBio. 2021 Aug 31;12(4):e0180321. doi: 10.1128/mBio.01803-21. Epub 2021 Aug 10. mBio. 2021. PMID: 34372699 Free PMC article.
-
Aspergillus fumigatus pan-genome analysis identifies genetic variants associated with human infection.Nat Microbiol. 2021 Dec;6(12):1526-1536. doi: 10.1038/s41564-021-00993-x. Epub 2021 Nov 24. Nat Microbiol. 2021. PMID: 34819642
-
Genomic perspective of triazole resistance in clinical and environmental Aspergillus fumigatus isolates without cyp51A mutations.Fungal Genet Biol. 2019 Nov;132:103265. doi: 10.1016/j.fgb.2019.103265. Epub 2019 Aug 26. Fungal Genet Biol. 2019. PMID: 31465846
-
Resistance in human pathogenic yeasts and filamentous fungi: prevalence, underlying molecular mechanisms and link to the use of antifungals in humans and the environment.Dan Med J. 2016 Oct;63(10):B5288. Dan Med J. 2016. PMID: 27697142 Review.
-
[Investigation of Virulence Factors by "Omics" Approaches].Med Mycol J. 2018;59(2):J35-J40. doi: 10.3314/mmj.18.005. Med Mycol J. 2018. PMID: 29848910 Review. Japanese.
Cited by
-
Evaluation of Different Gene Prediction Tools in Coccidioides immitis.J Fungi (Basel). 2023 Nov 9;9(11):1094. doi: 10.3390/jof9111094. J Fungi (Basel). 2023. PMID: 37998899 Free PMC article.
-
Genomic divergence across the tree of life.Proc Natl Acad Sci U S A. 2025 Mar 11;122(10):e2319389122. doi: 10.1073/pnas.2319389122. Epub 2025 Feb 27. Proc Natl Acad Sci U S A. 2025. PMID: 40014554 Free PMC article.
-
Patterns and mechanisms of fungal genome plasticity.Curr Biol. 2025 Jun 9;35(11):R527-R544. doi: 10.1016/j.cub.2025.04.003. Curr Biol. 2025. PMID: 40494309 Review.
-
Widely dispersed clonal expansion of multi-fungicide-resistant Aspergillus fumigatus limits genomic epidemiology prospects.mBio. 2025 Jun 11;16(6):e0365224. doi: 10.1128/mbio.03652-24. Epub 2025 May 20. mBio. 2025. PMID: 40391955 Free PMC article.
-
Unveiling environmental transmission risks: comparative analysis of azole resistance in Aspergillus fumigatus clinical and environmental isolates from Yunnan, China.Microbiol Spectr. 2024 Oct 29;12(12):e0159424. doi: 10.1128/spectrum.01594-24. Online ahead of print. Microbiol Spectr. 2024. PMID: 39470286 Free PMC article.
References
-
- Centers for Disease Control and Prevention (U.S.). Antibiotic Resistance Threats in the United States. US Department of Health and Human Services, Centers for Disease Control and Prevention. 2019.

