

Two in one: Overlapping CT findings of COVID-19 and underlying lung diseases
- PMID: 36395576
- PMCID: PMC9651998
- DOI: 10.1016/j.clinimag.2022.11.005
Two in one: Overlapping CT findings of COVID-19 and underlying lung diseases
Abstract
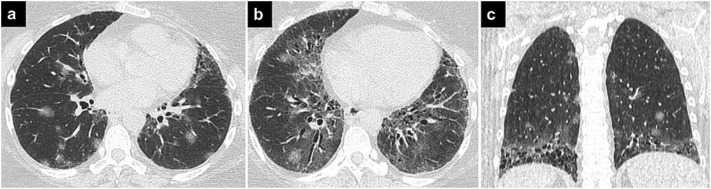
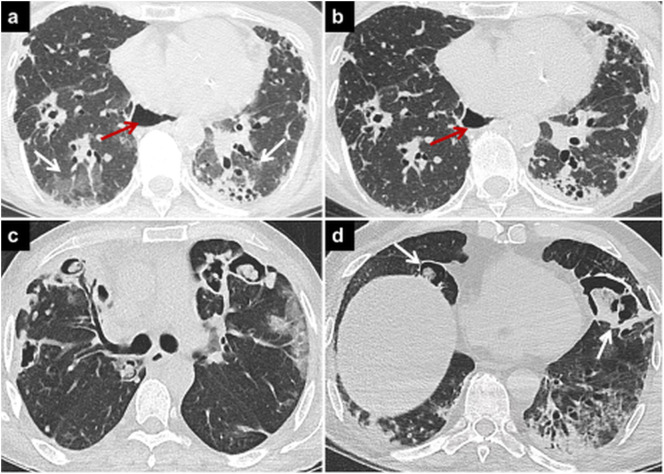
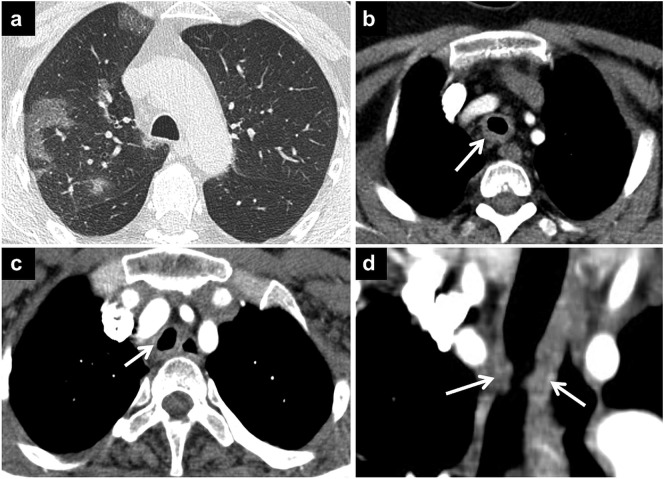
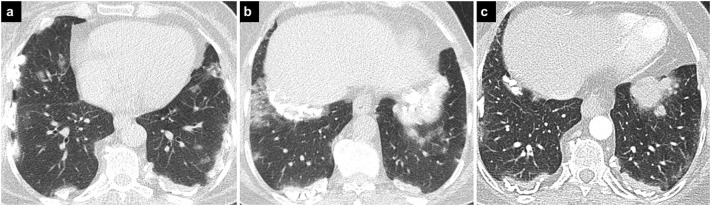
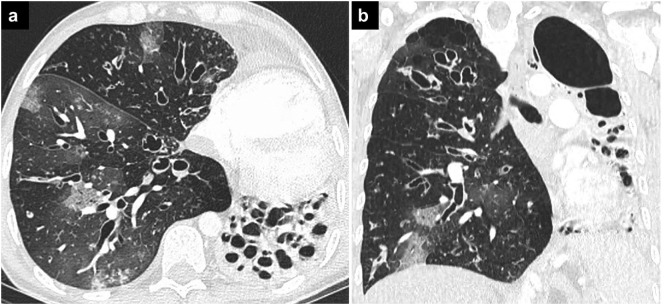
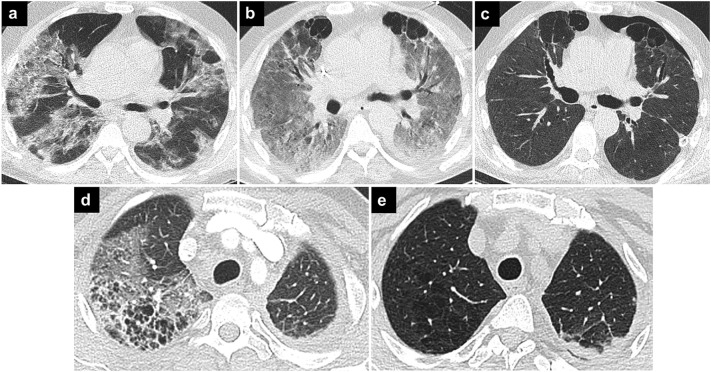
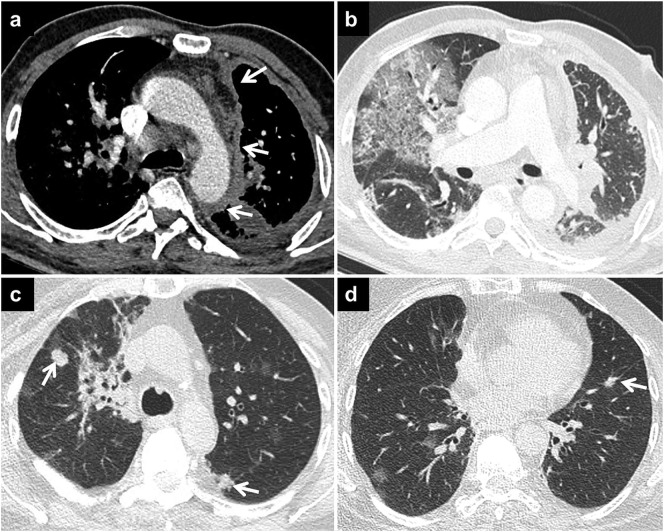
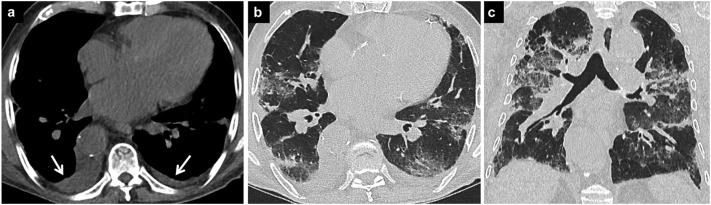
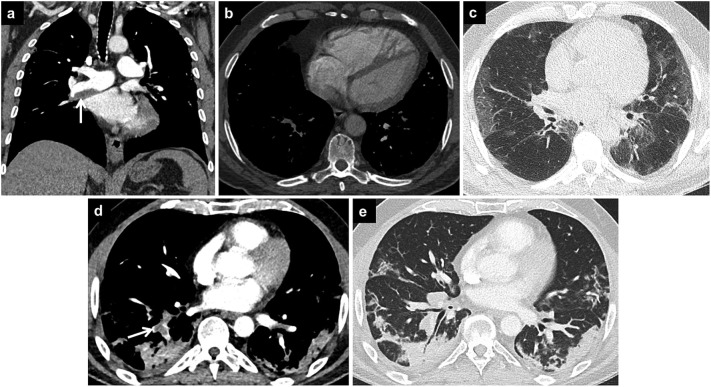
Coronavirus disease 2019 (COVID-19) is associated with pneumonia and has various pulmonary manifestations on computed tomography (CT). Although COVID-19 pneumonia is usually seen as bilateral predominantly peripheral ground-glass opacities with or without consolidation, it can present with atypical radiological findings and resemble the imaging findings of other lung diseases. Diagnosis of COVID-19 pneumonia is much more challenging for both clinicians and radiologists in the presence of pre-existing lung disease. The imaging features of COVID-19 and underlying lung disease can overlap and obscure the findings of each other. Knowledge of the radiological findings of both diseases and possible complications, correct diagnosis, and multidisciplinary consensus play key roles in the appropriate management of diseases. In this pictorial review, the chest CT findings are presented of patients with underlying lung diseases and overlapping COVID-19 pneumonia and the various reasons for radiological lung abnormalities in these patients are discussed.
Keywords: COVID-19 pneumonia; Computed tomography; Lung diseases.
Copyright © 2022 Elsevier Inc. All rights reserved.
Figures
Similar articles
-
Clinical manifestations and radiological features by chest computed tomographic findings of a novel coronavirus disease-19 pneumonia among 92 patients in Japan.J Microbiol Immunol Infect. 2021 Aug;54(4):748-751. doi: 10.1016/j.jmii.2020.07.011. Epub 2020 Aug 20. J Microbiol Immunol Infect. 2021. PMID: 32868193 Free PMC article.
-
The novel coronavirus pneumonia (COVID-19): a pictorial review of chest CT features.Diagn Interv Radiol. 2021 Mar;27(2):188-194. doi: 10.5152/dir.2020.20304. Diagn Interv Radiol. 2021. PMID: 32815523 Free PMC article. Review.
-
Chest CT features of coronavirus disease 2019 (COVID-19) pneumonia: key points for radiologists.Radiol Med. 2020 Jul;125(7):636-646. doi: 10.1007/s11547-020-01237-4. Epub 2020 Jun 4. Radiol Med. 2020. PMID: 32500509 Free PMC article. Review.
-
Target-shaped combined halo and reversed-halo sign, an atypical chest CT finding in COVID-19.Clin Imaging. 2021 Jan;69:72-74. doi: 10.1016/j.clinimag.2020.06.038. Epub 2020 Jul 2. Clin Imaging. 2021. PMID: 32682246 Free PMC article.
-
Imaging and clinical features of patients with 2019 novel coronavirus SARS-CoV-2.Eur J Nucl Med Mol Imaging. 2020 May;47(5):1275-1280. doi: 10.1007/s00259-020-04735-9. Epub 2020 Feb 28. Eur J Nucl Med Mol Imaging. 2020. PMID: 32107577 Free PMC article.
Cited by
-
Advances in the Therapeutic Applications of Plant-Derived Exosomes in the Treatment of Inflammatory Diseases.Biomedicines. 2023 May 27;11(6):1554. doi: 10.3390/biomedicines11061554. Biomedicines. 2023. PMID: 37371649 Free PMC article. Review.
-
Physico-chemical characterization of acid base disorders in patients with COVID-19: A cohort study.World J Nephrol. 2024 Jun 25;13(2):92498. doi: 10.5527/wjn.v13.i2.92498. World J Nephrol. 2024. PMID: 38983762 Free PMC article.
-
Evaluating the Accuracy of Chest CT in Detecting COVID-19 Through Tracheobronchial Wall Thickness: Insights From Emergency Department Patients in Mid-2023.Cureus. 2024 Sep 11;16(9):e69161. doi: 10.7759/cureus.69161. eCollection 2024 Sep. Cureus. 2024. PMID: 39398816 Free PMC article.
References
-
- Ciccarese F., Coppola F., Spinelli D., Galletta G.L., Lucidi V., Paccapelo A., et al. Diagnostic accuracy of North America expert consensus statement on reporting CT findings in patients suspected of having COVID-19 infection: an italian single-center experience. Radiol Cardiothorac Imaging. 2020;2(4) - PMC - PubMed
Publication types
MeSH terms
LinkOut - more resources
Full Text Sources
Medical
