

Morphology and gene expression profiling provide complementary information for mapping cell state
- PMID: 36395727
- PMCID: PMC10246468
- DOI: 10.1016/j.cels.2022.10.001
Morphology and gene expression profiling provide complementary information for mapping cell state
Abstract
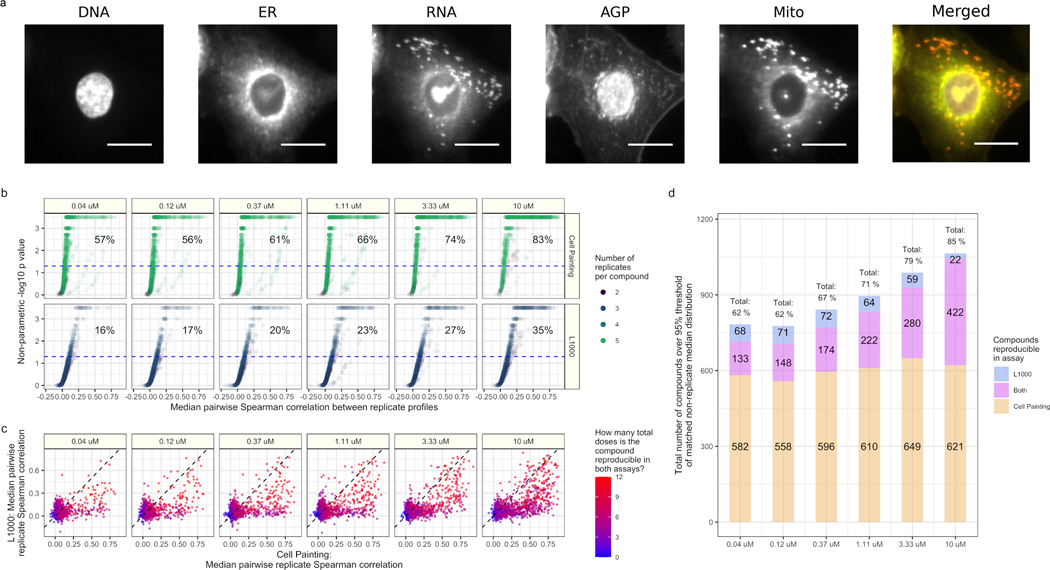
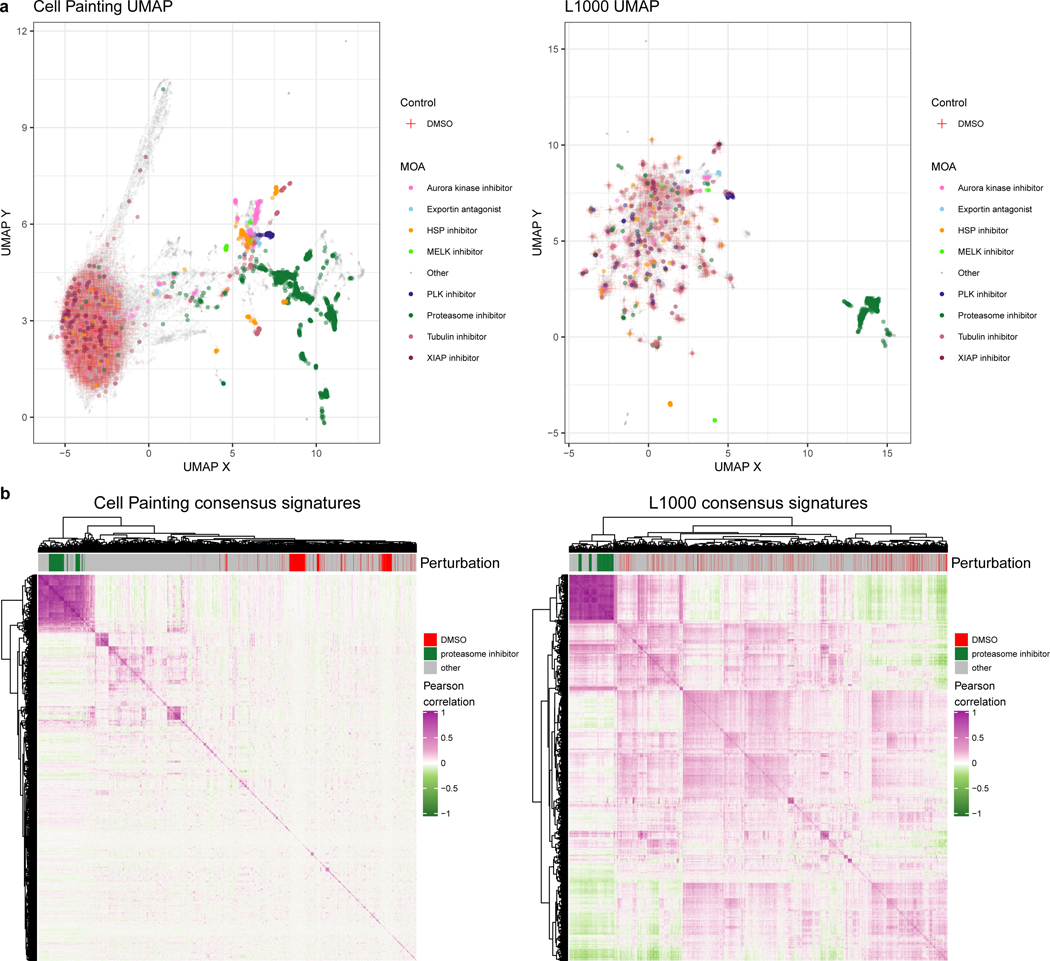
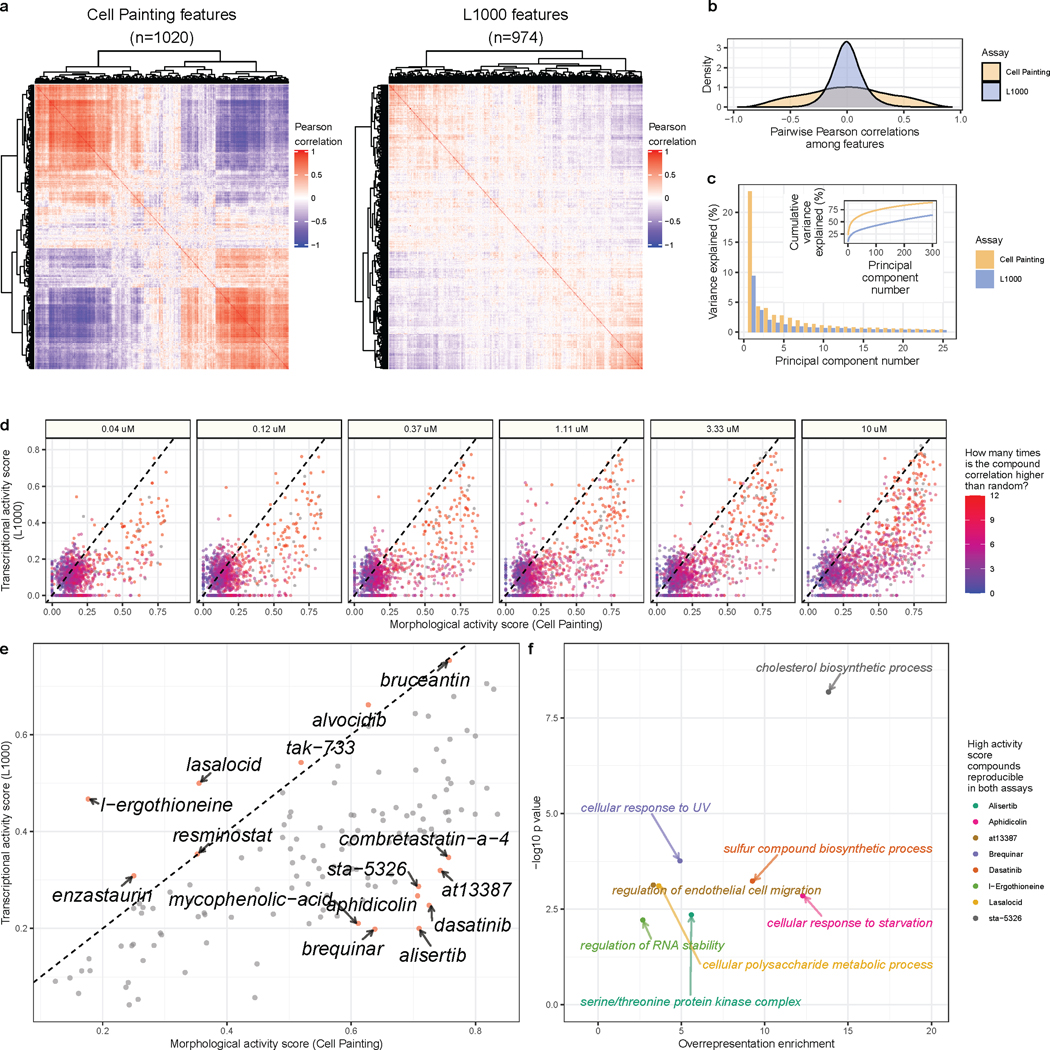
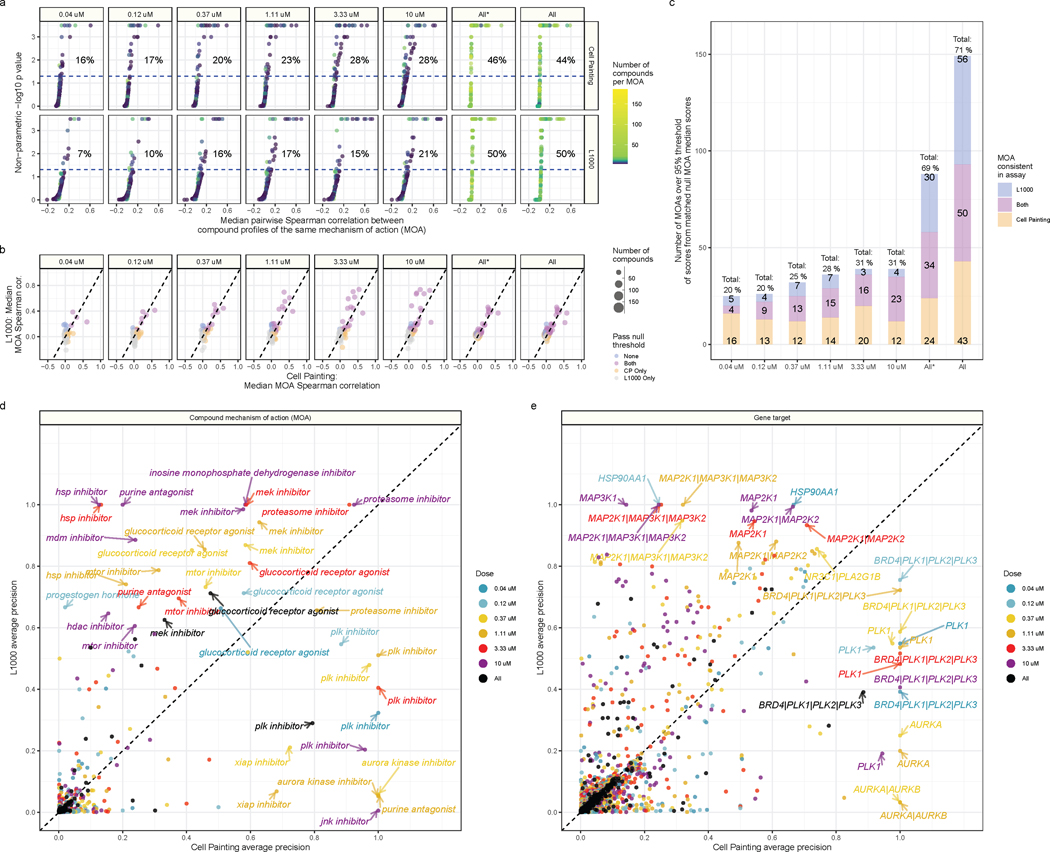
Morphological and gene expression profiling can cost-effectively capture thousands of features in thousands of samples across perturbations by disease, mutation, or drug treatments, but it is unclear to what extent the two modalities capture overlapping versus complementary information. Here, using both the L1000 and Cell Painting assays to profile gene expression and cell morphology, respectively, we perturb human A549 lung cancer cells with 1,327 small molecules from the Drug Repurposing Hub across six doses, providing a data resource including dose-response data from both assays. The two assays capture both shared and complementary information for mapping cell state. Cell Painting profiles from compound perturbations are more reproducible and show more diversity but measure fewer distinct groups of features. Applying unsupervised and supervised methods to predict compound mechanisms of action (MOAs) and gene targets, we find that the two assays not only provide a partially shared but also a complementary view of drug mechanisms. Given the numerous applications of profiling in biology, our analyses provide guidance for planning experiments that profile cells for detecting distinct cell types, disease phenotypes, and response to chemical or genetic perturbations.
Keywords: Cell Painting; L1000; benchmark; drug discovery; high-dimensional profiling; images; systems biology.
Copyright © 2022 Elsevier Inc. All rights reserved.
Conflict of interest statement
Declaration of interests The authors declare no competing interests.
Figures
Similar articles
-
High-dimensional gene expression and morphology profiles of cells across 28,000 genetic and chemical perturbations.Nat Methods. 2022 Dec;19(12):1550-1557. doi: 10.1038/s41592-022-01667-0. Epub 2022 Nov 7. Nat Methods. 2022. PMID: 36344834 Free PMC article.
-
Cell Painting: a decade of discovery and innovation in cellular imaging.Nat Methods. 2025 Feb;22(2):254-268. doi: 10.1038/s41592-024-02528-8. Epub 2024 Dec 5. Nat Methods. 2025. PMID: 39639168 Free PMC article. Review.
-
Linking chemicals, genes and morphological perturbations to diseases.Toxicol Appl Pharmacol. 2023 Feb 15;461:116407. doi: 10.1016/j.taap.2023.116407. Epub 2023 Feb 2. Toxicol Appl Pharmacol. 2023. PMID: 36736439
-
Predicting cell health phenotypes using image-based morphology profiling.Mol Biol Cell. 2021 Apr 19;32(9):995-1005. doi: 10.1091/mbc.E20-12-0784. Epub 2021 Feb 3. Mol Biol Cell. 2021. PMID: 33534641 Free PMC article.
-
Applications in image-based profiling of perturbations.Curr Opin Biotechnol. 2016 Jun;39:134-142. doi: 10.1016/j.copbio.2016.04.003. Epub 2016 Apr 17. Curr Opin Biotechnol. 2016. PMID: 27089218 Review.
Cited by
-
High-dimensional gene expression and morphology profiles of cells across 28,000 genetic and chemical perturbations.Nat Methods. 2022 Dec;19(12):1550-1557. doi: 10.1038/s41592-022-01667-0. Epub 2022 Nov 7. Nat Methods. 2022. PMID: 36344834 Free PMC article.
-
Application of Cell Painting for chemical hazard evaluation in support of screening-level chemical assessments.Toxicol Appl Pharmacol. 2023 Jun 1;468:116513. doi: 10.1016/j.taap.2023.116513. Epub 2023 Apr 11. Toxicol Appl Pharmacol. 2023. PMID: 37044265 Free PMC article.
-
Linking autism risk genes to morphological and pharmaceutical screening by high-content imaging: Future directions and opinion.Psychiatry Clin Neurosci. 2025 Aug;79(8):435-446. doi: 10.1111/pcn.13847. Epub 2025 Jun 10. Psychiatry Clin Neurosci. 2025. PMID: 40492449 Free PMC article. Review.
-
Cell Painting: a decade of discovery and innovation in cellular imaging.Nat Methods. 2025 Feb;22(2):254-268. doi: 10.1038/s41592-024-02528-8. Epub 2024 Dec 5. Nat Methods. 2025. PMID: 39639168 Free PMC article. Review.
-
Evaluating batch correction methods for image-based cell profiling.Nat Commun. 2024 Aug 2;15(1):6516. doi: 10.1038/s41467-024-50613-5. Nat Commun. 2024. PMID: 39095341 Free PMC article.
References
-
- Alexa Adrian J.R. (2017). topGO (Bioconductor).
-
- Agarap AF (2018). Deep Learning using Rectified Linear Units (ReLU).
-
- Alexa A, Rahnenführer J, and Lengauer T. (2006). Improved scoring of functional groups from gene expression data by decorrelating GO graph structure. Bioinformatics 22, 1600–1607. - PubMed
-
- Altman NS (1992). An Introduction to Kernel and Nearest-Neighbor Nonparametric Regression. The American Statistician 46, 175–185.
-
- Anaconda Inc. (2021). Anaconda software distribution.
Publication types
MeSH terms
Grants and funding
LinkOut - more resources
Full Text Sources
