. 2022 Dec;298(12):102706.
doi: 10.1016/j.jbc.2022.102706. Epub 2022 Nov 15.

Genome-wide metabolite quantitative trait loci analysis (mQTL) in red blood cells from volunteer blood donors

Affiliations

Genome-wide metabolite quantitative trait loci analysis (mQTL) in red blood cells from volunteer blood donors

Amy Moore et al. J Biol Chem. 2022 Dec.

Abstract

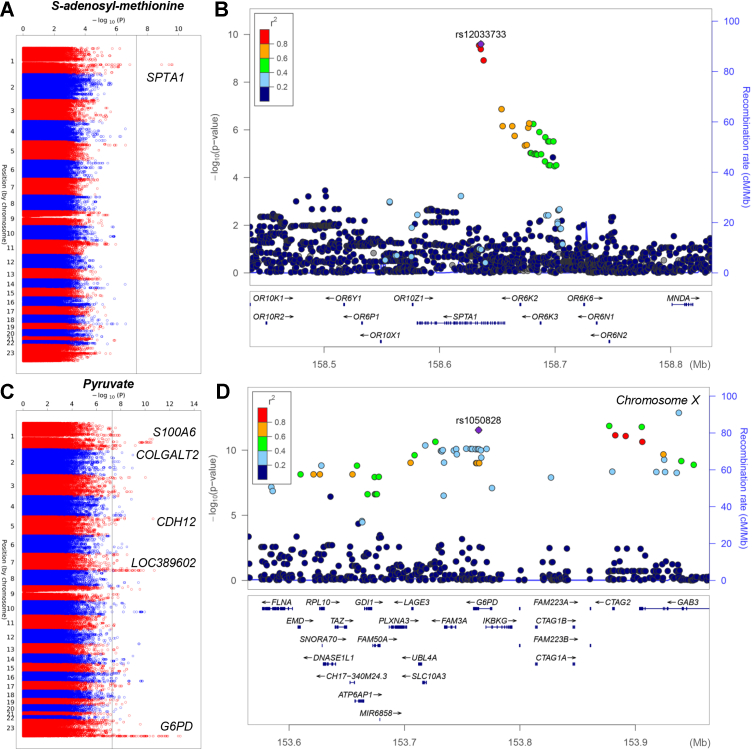
The red blood cell (RBC)-Omics study, part of the larger NHLBI-funded Recipient Epidemiology and Donor Evaluation Study (REDS-III), aims to understand the genetic contribution to blood donor RBC characteristics. Previous work identified donor demographic, behavioral, genetic, and metabolic underpinnings to blood donation, storage, and (to a lesser extent) transfusion outcomes, but none have yet linked the genetic and metabolic bodies of work. We performed a genome-wide association (GWA) analysis using RBC-Omics study participants with generated untargeted metabolomics data to identify metabolite quantitative trait loci in RBCs. We performed GWA analyses of 382 metabolites in 243 individuals imputed using the 1000 Genomes Project phase 3 all-ancestry reference panel. Analyses were conducted using ProbABEL and adjusted for sex, age, donation center, number of whole blood donations in the past 2 years, and first 10 principal components of ancestry. Our results identified 423 independent genetic loci associated with 132 metabolites (p < 5×10⁻⁸). Potentially novel locus-metabolite associations were identified for the region encoding heme transporter FLVCR1 and choline and for lysophosphatidylcholine acetyltransferase LPCAT3 and lysophosphatidylserine 16.0, 18.0, 18.1, and 18.2; these associations are supported by published rare disease and mouse studies. We also confirmed previous metabolite GWA results for associations, including N(6)-methyl-L-lysine and protein PYROXD2 and various carnitines and transporter SLC22A16. Association between pyruvate levels and G6PD polymorphisms was validated in an independent cohort and novel murine models of G6PD deficiency (African and Mediterranean variants). We demonstrate that it is possible to perform metabolomics-scale GWA analyses with a modest, trans-ancestry sample size.

Keywords: SNP; glucose 6-phosphate dehydrogenase; metabolomics; red blood cell; transfusion medicine.


Conflict of interest statement

Conflict of interest Though unrelated to the contents of this manuscripts, the authors declare that A. D. is a founder of Omix Technologies Inc and Altis Biosciences LLC. A. D. is SAB members for Hemanext Inc. and FORMA Therapeutics Inc. A. D. is a consultant for Rubius Therapeutics. J. C. Z. is a consultant for Rubius Therapeutics and a founder of Svalinn Therapeutics. All other authors have no conflicts of interests to disclose.

Figures

Figure 1
Figure 1
Study design and top 10 hits from the mQTL analysis from the REDS-III RBC-Omics pilot recalled donor study.A, metabolomics analyses were performed on 250 packed RBC samples from donors who had been previously characterized at the genome level via the precision transfusion medicine array (30). B, an overview of the top 10 hits (closest annotated gene to the identified SNP) as a function of significance (-log10(p)). C, overlapped Manhattan plots of all the significant hits (FDR < 5 × 10-8), including metabolites—gene pairs. Each data point corresponds to a –log10(p value) from a multivariant linear regression model’s p value for an SNP. The black horizontal line represents an accepted p-value level of genome-wide significance (p = 5 × 10–8). D, Q-Q plots for the top 10 hits from the mQTL analysis. mQTL, metabolite quantitative trait loci; REDS-III, Recipient Epidemiology and Donor Evaluation Study.
Figure 2
Figure 2
Ancestry plots and association between methyl-lysine levels and polymorphisms in PYROXD2.A, for the top GWA hits we generated box and whisker plots based on metabolite abundances as a function of allele variance across all genetic ancestries in this study. Consistently with previous mQTL studies (40, 41, 65, 66, 67), polymorphisms in the exonic region coding for the enzyme PYROXD2 were associated with variance in the levels of methyl-lysine, an observation that represents a sort of internal quality control for the present analysis compared to the literature. B–C, Manhattan plots and LocusZoom are shown in panels BC, respectively. GWA, genome-wide association.
Figure 3
Figure 3
LPCAT3 is polymorphic in healthy blood donors and associates with red blood cell lysophospholipid (LPS) levels.AD, Manhattan plots for LPS, specifically linoleyl- (18:2—A and related LocusZoom, highlighting the association with the region coding for LPCAT3 in B), palmitoyl (16:0), stearoyl (18:0) or oleyl (18:1—C). D, highlight of the polymorphic residue I271, mapped against the structure of LPCAT3 (7F3X.pdb).
Figure 4
Figure 4
Polymorphisms in NT5C3A and FLVCR1 are associated with variability in the levels of UDP-N-acetyl-glucosamine and choline in RBCs from healthy blood donors.AD, Manhattan plots and LocusZoom are shown in panels A–B and C–D, respectively.
Figure 5
Figure 5
Polymorphisms in EPHX2 and SMOX are associated with variability in the levels of oxylipins (12,13-EpOME) and spermine, respectively.A–D, Manhattan plots and LocusZoom are showns in panels A and B and C and D, respectively. EPHX2, epoxide hydrolase 2; SMOX, spermine oxidase.
Figure 6
Figure 6
Polymorphisms in SPTA1 and G6PD are associated with variability in the levels of S-adenosyl-methionine and pyruvate, respectively. Manhattan plots and LocusZoom are shown in panels A and B and and D, respectively. SPTA1, spectrin alpha 1; G6PD, glucose 6-phosphate dehydrogenase.
Figure 7
Figure 7
G6PD deficiency in fresh and stored RBCs from blood donors are associated with increases in pyruvate levels and pyruvate/lactate ratios.A–C, pyruvate levels were found to be inversely proportional to G6PD activity in fresh RBCs from G6PD-deficient (n = 10) and -sufficient (n = 27) blood donors. D, these differences in pyruvate levels between the two groups were exacerbated during storage in the blood bank up to 42 days. E, similarly, RBCs from G6PD-deficient mice (African and Mediterranean variant) and WT C57BL6/J or humanized canonical G6PD mice were incubated with 1,2,3-13C3-glucose for 1 h to determine metabolic fluxes through glycolysis and the pentose phosphate pathway (PPP). F, results confirmed significant decreases in the labeled levels of oxidative phase metabolites of the PPP (13C3-phosphogluconate and 13C2-ribose-phosphate) in A- and Med-mice, which corresponded to increases in the ratios of labeled 13C3-pyruvate/lactate. G6PD, glucose 6-phosphate dehydrogenase; RBC, red blood cell.

References

    1. Nemkov T., Reisz J.A., Xia Y., Zimring J.C., D'Alessandro A. Red blood cells as an organ? How deep omics characterization of the most abundant cell in the human body highlights other systemic metabolic functions beyond oxygen transport. Expert Rev. Proteomics. 2018;15:855–864. - PubMed
    1. D'Alessandro A., Dzieciatkowska M., Nemkov T., Hansen K.C. Red blood cell proteomics update: is there more to discover? Blood Transfus. 2017;15:182–187. - PMC - PubMed
    1. Bryk A.H., Wiśniewski J.R. Quantitative analysis of human red blood cell proteome. J. Proteome Res. 2017;16:2752–2761. - PubMed
    1. Wilson M.C., Trakarnsanga K., Heesom K.J., Cogan N., Green C., Toye A.M., et al. Comparison of the proteome of adult and cord erythroid cells, and changes in the proteome following reticulocyte maturation. Mol. Cell Proteomics. 2016;15:1938–1946. - PMC - PubMed
    1. Kaestner L., Minetti G. The potential of erythrocytes as cellular aging models. Cell Death Differ. 2017;24:1475–1477. - PMC - PubMed

Publication types

Substances

LinkOut - more resources