

Agreement between multiparametric MRI (PIVOT), Doppler ultrasound, and near-infrared spectroscopy-based assessments of skeletal muscle oxygenation and perfusion
- PMID: 36396004
- PMCID: PMC9789193
- DOI: 10.1016/j.mri.2022.11.003
Agreement between multiparametric MRI (PIVOT), Doppler ultrasound, and near-infrared spectroscopy-based assessments of skeletal muscle oxygenation and perfusion
Abstract
Skeletal muscle perfusion and oxygenation are commonly evaluated using Doppler ultrasound and near-infrared spectroscopy (NIRS) techniques. However, a recently developed magnetic resonance imaging (MRI) sequence, termed PIVOT, permits the simultaneous collection of skeletal muscle perfusion and T2* (an index of skeletal muscle oxygenation).
Purpose: To determine the level of agreement between PIVOT, Doppler ultrasound, and NIRS-based assessments of skeletal muscle perfusion and oxygenation.
Methods: Twelve healthy volunteers (8 females, 25 ± 3 years, 170 ± 11 cm, 71.5 ± 8.0 kg) performed six total reactive hyperemia protocols. During three of these reactive hyperemia protocols, Tissue Saturation Index (TSI) and oxygenated hemoglobin (O2Hb) were recorded from the medial gastrocnemius (MG) and tibialis anterior (TA), and blood flow velocity was recorded from the popliteal artery (BFvpop) via Doppler Ultrasound. The other three trials were performed inside the bore of a 3 T MRI scanner, and the PIVOT sequence was used to assess perfusion (PIVOTperf) and oxygenation (T2*) of the medial gastrocnemius and tibialis anterior muscles. Positive incremental areas under the curve (iAUC) and times to peak (TTP) were calculated for each variable, and the level of agreement between collection methods was evaluated via Bland-Altman analyses and Spearman's Rho correlation analyses.
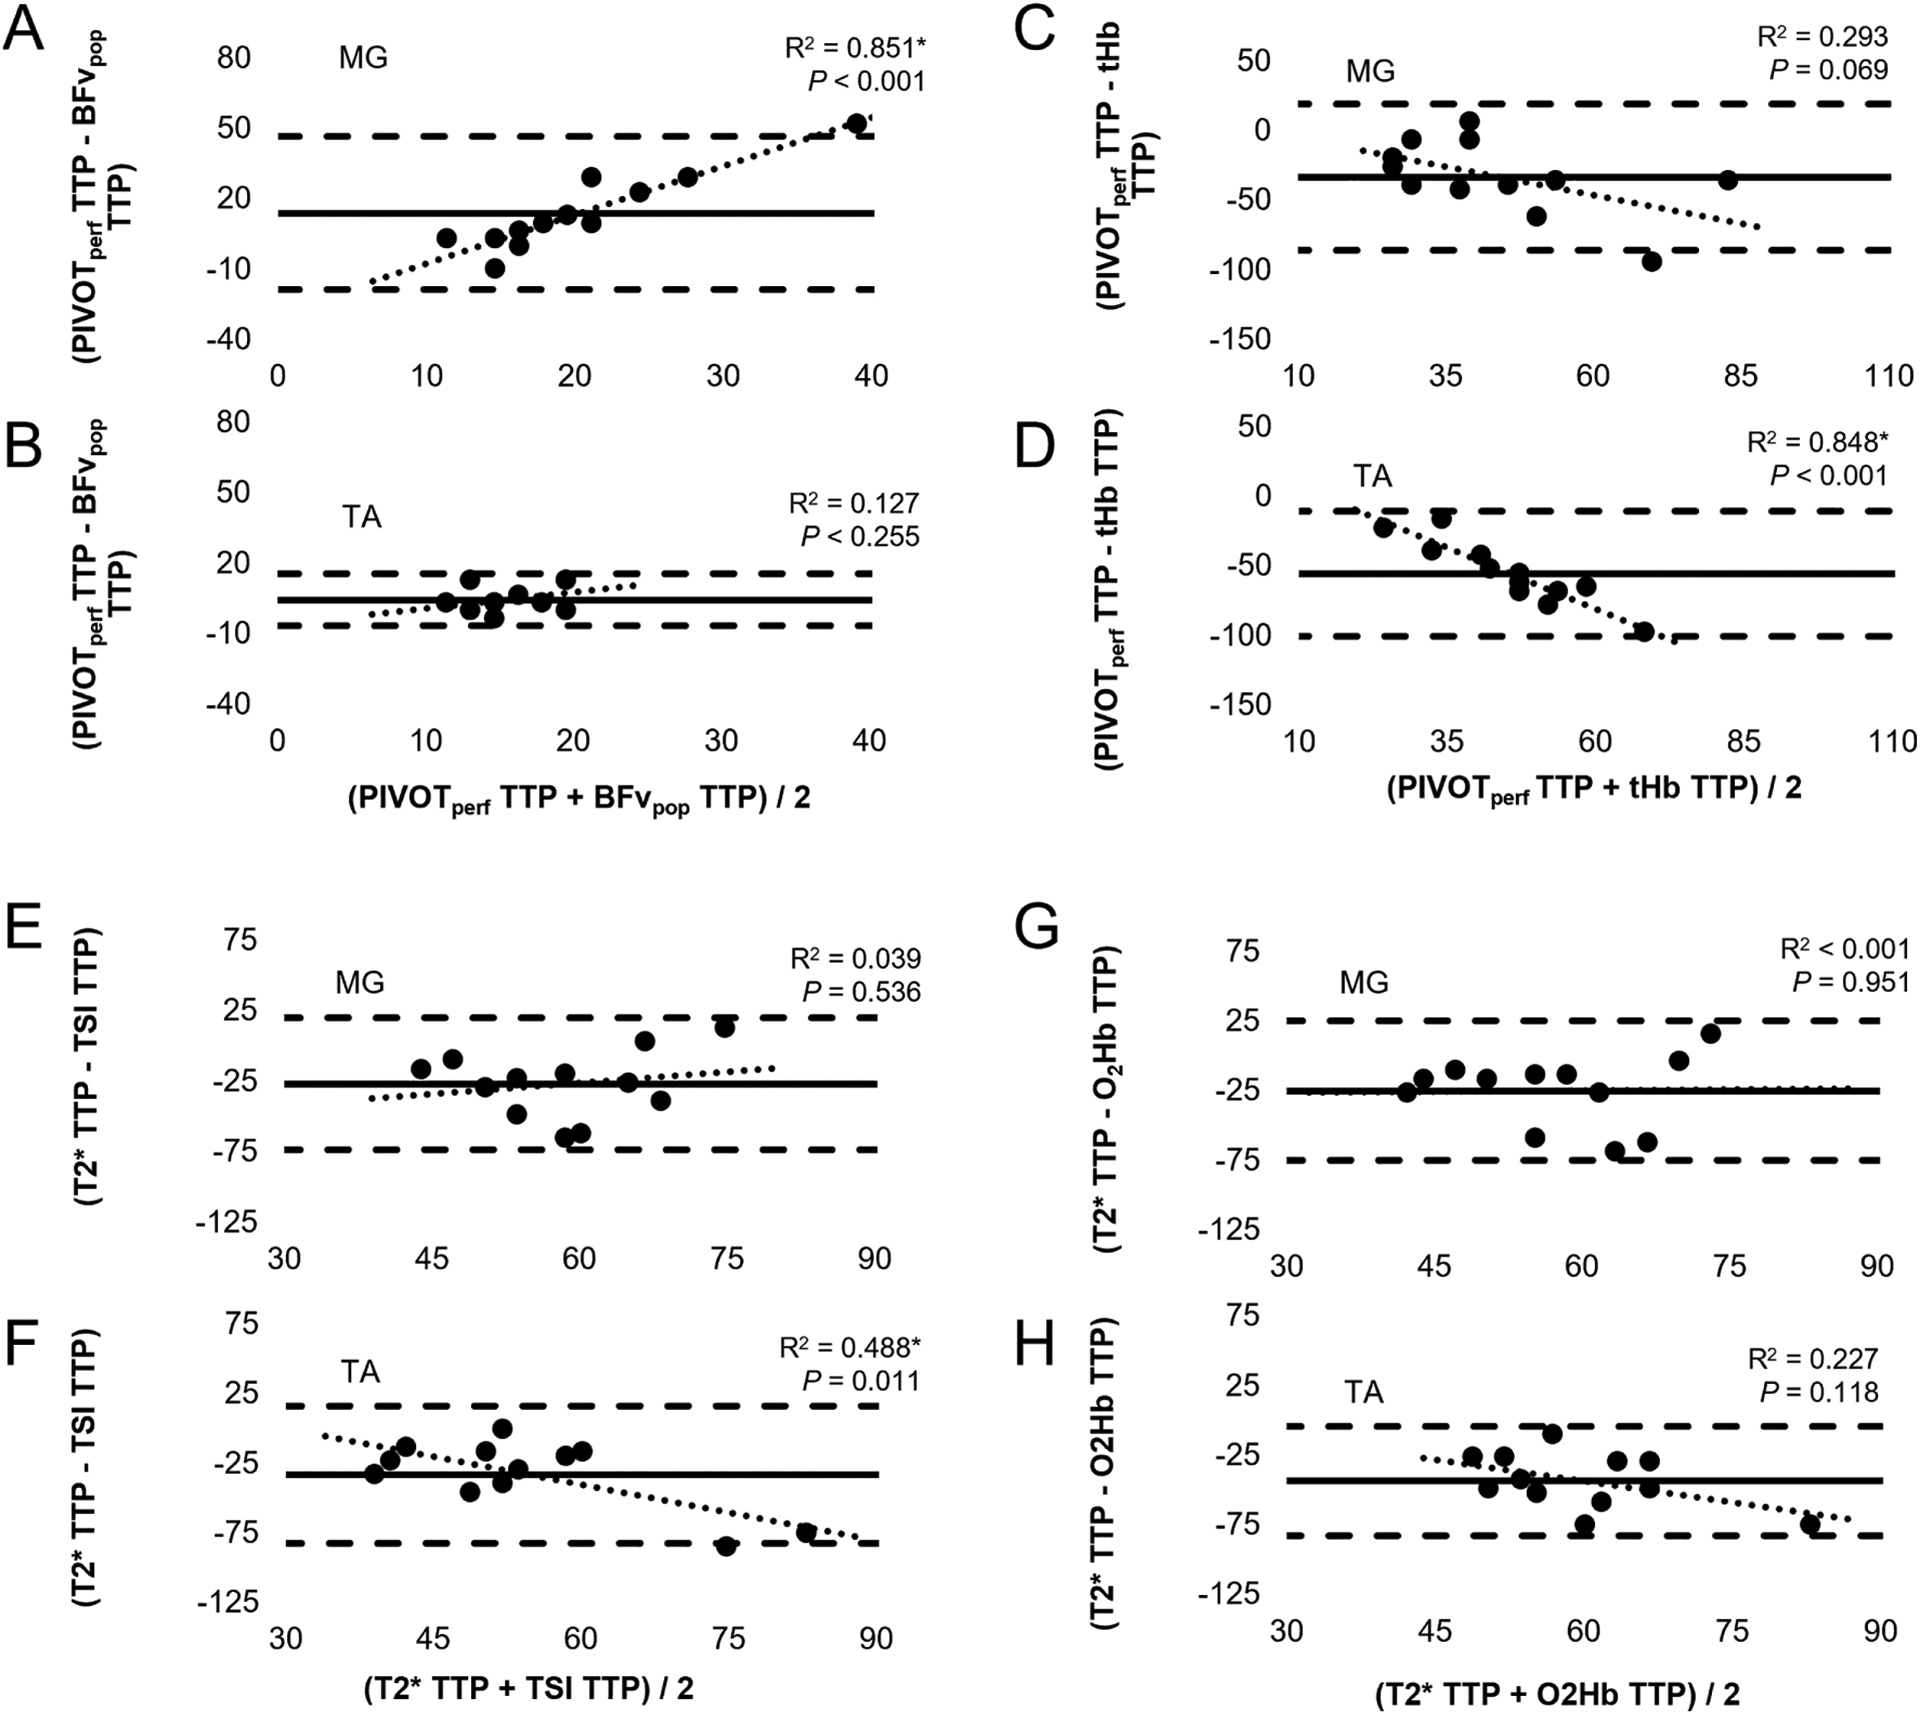
Results: The only significant bivariate relationships observed were between the T2* vs. TSI iAUC and PIVOTperf vs. BFvpop values recorded from the MG. Significant mean differences were observed for all comparisons (all P ≤ 0.038), and significant proportional biases were observed for the PIVOTperf vs. tHb TTP (R2 = 0.848, P < 0.001) and T2* vs. TSI TTP comparisons in the TA (R2 = 0.488, P = 0.011), and the PIVOTperf vs. BFvpop iAUC (R2 = 0.477, P = 0.013) and time to peak (R2 = 0.851, P < 0.001) comparisons in the MG.
Conclusions: Our findings suggest that the PIVOT technique has, at best, a moderate level of agreement with Doppler ultrasound and NIRS assessment methods and is subject to significant proportional bias. These findings do not challenge the accuracy of either measurement technique but instead reflect differences in the vascular compartments, sampling volumes, and parameters being evaluated.
Keywords: Leg blood flow; Muscle oxygenation; NIRS; Perfusion.
Copyright © 2022 Elsevier Inc. All rights reserved.
Conflict of interest statement
Declaration of Competing Interest The authors have no conflicts of interest to report.
Figures


Similar articles
-
Contrast Baths, Intramuscular Hemodynamics, and Oxygenation as Monitored by Near-Infrared Spectroscopy.J Athl Train. 2018 Aug;53(8):782-787. doi: 10.4085/1062-6050-127-17. Epub 2018 Sep 13. J Athl Train. 2018. PMID: 30212235 Free PMC article.
-
Combined measurement of perfusion, venous oxygen saturation, and skeletal muscle T2* during reactive hyperemia in the leg.J Cardiovasc Magn Reson. 2013 Aug 19;15(1):70. doi: 10.1186/1532-429X-15-70. J Cardiovasc Magn Reson. 2013. PMID: 23958293 Free PMC article. Clinical Trial.
-
Assessing functional sympatholysis during rhythmic handgrip exercise using Doppler ultrasound and near-infrared spectroscopy: sex differences and test-retest reliability.Am J Physiol Regul Integr Comp Physiol. 2022 Nov 1;323(5):R810-R821. doi: 10.1152/ajpregu.00123.2022. Epub 2022 Oct 3. Am J Physiol Regul Integr Comp Physiol. 2022. PMID: 36189987
-
The Use of Near Infrared Spectroscopy to Evaluate the Effect of Exercise on Peripheral Muscle Oxygenation in Patients with Lower Extremity Artery Disease: A Systematic Review.Eur J Vasc Endovasc Surg. 2021 May;61(5):837-847. doi: 10.1016/j.ejvs.2021.02.008. Epub 2021 Mar 30. Eur J Vasc Endovasc Surg. 2021. PMID: 33810977
-
Recent developments in near-infrared spectroscopy (NIRS) for the assessment of local skeletal muscle microvascular function and capacity to utilise oxygen.Artery Res. 2016 Dec;16:25-33. doi: 10.1016/j.artres.2016.09.001. Artery Res. 2016. PMID: 27942271 Free PMC article. Review.
References
-
- Barton TJ, Low DA, Janssen TWJ, Sloots M, Smit CAJ, Thijssen DHJ. Femoral Artery Blood Flow and Microcirculatory Perfusion During Acute, Low-Level Functional Electrical Stimulation in Spinal Cord Injury. Am J Phys Med Rehabil 2018;97(10):721–6. - PubMed
-
- Burns KJ, Pollock BS, Lascola P, McDaniel J. Cardiovascular responses to counterweighted single-leg cycling: implications for rehabilitation. Eur J Appl Physiol 2014;114(5):961–8. - PubMed
-
- Stavres J, Fischer SM, McDaniel J. Exaggerated post exercise hypotension following concentric but not eccentric resistance exercise: Implications for metabolism. Eur J Sport Sci 2019;19(7):983–93. - PubMed
Publication types
MeSH terms
Substances
Grants and funding
LinkOut - more resources
Full Text Sources
