Observational Study
. 2022 Nov 17;12(11):e056292.
doi: 10.1136/bmjopen-2021-056292.

Role of multiresolution vulnerability indices in COVID-19 spread in India: a Bayesian model-based analysis

Affiliations
Observational Study

Role of multiresolution vulnerability indices in COVID-19 spread in India: a Bayesian model-based analysis

Rupam Bhattacharyya et al. BMJ Open. .

Abstract

Objectives: COVID-19 has differentially affected countries, with health infrastructure and other related vulnerability indicators playing a role in determining the extent of its spread. Vulnerability of a geographical region to COVID-19 has been a topic of interest, particularly in low-income and middle-income countries like India to assess its multifactorial impact on incidence, prevalence or mortality. This study aims to construct a statistical analysis pipeline to compute such vulnerability indices and investigate their association with metrics of the pandemic growth.

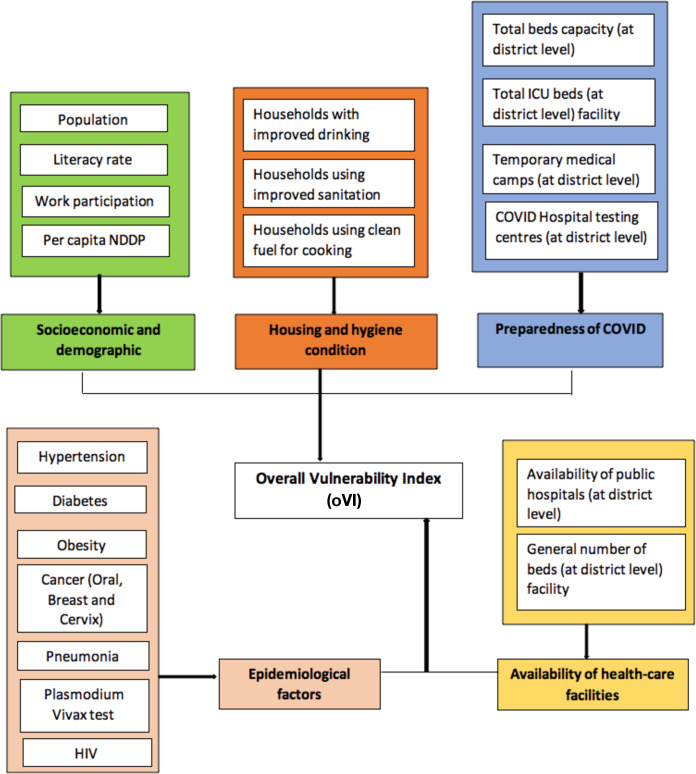
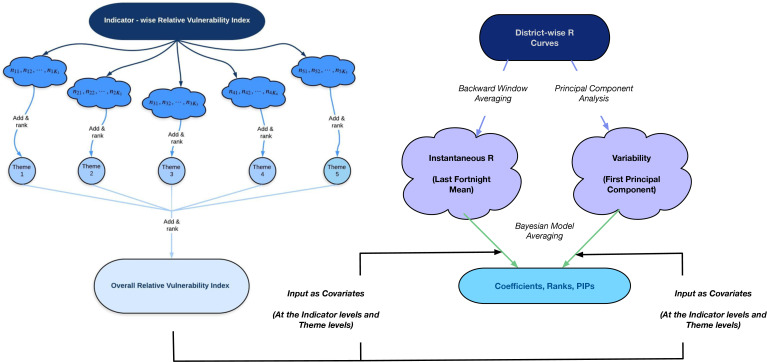
Design: Using publicly reported observational socioeconomic, demographic, health-based and epidemiological data from Indian national surveys, we compute contextual COVID-19 Vulnerability Indices (cVIs) across multiple thematic resolutions for different geographical and spatial administrative regions. These cVIs are then used in Bayesian regression models to assess their impact on indicators of the spread of COVID-19.

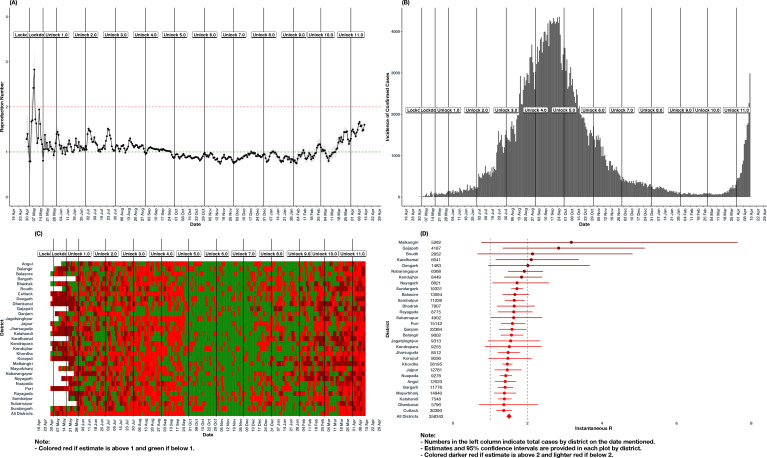
Setting: This study uses district-level indicators and case counts data for the state of Odisha, India.

Primary outcome measure: We use instantaneous R (temporal average of estimated time-varying reproduction number for COVID-19) as the primary outcome variable in our models.

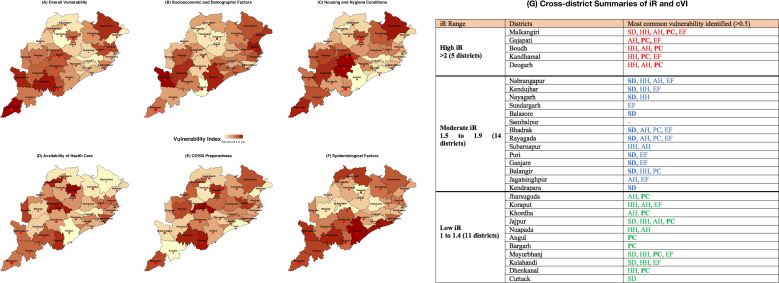
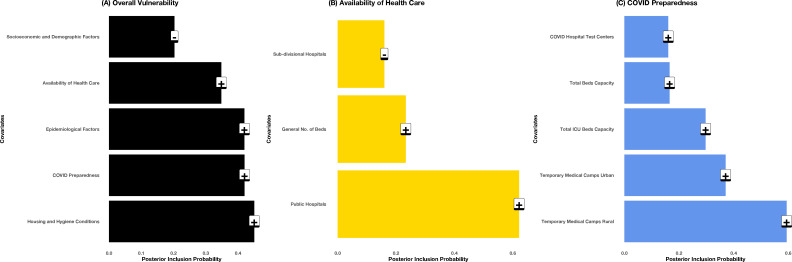
Results: Our observational study, focussing on 30 districts of Odisha, identified housing and hygiene conditions, COVID-19 preparedness and epidemiological factors as important indicators associated with COVID-19 vulnerability.

Conclusion: Having succeeded in containing COVID-19 to a reasonable level during the first wave, the second wave of COVID-19 made greater inroads into the hinterlands and peripheral districts of Odisha, burdening the already deficient public health system in these areas, as identified by the cVIs. Improved understanding of the factors driving COVID-19 vulnerability will help policy makers prioritise resources and regions, leading to more effective mitigation strategies for the present and future.

Keywords: COVID-19; Epidemiology; Public health.


Conflict of interest statement

Competing interests: None declared.

Figures

Figure 1
Figure 1
Summary of the five themes and the underlying variables used to compute the vulnerability indices. Each primary rectangle connected to the central oVI box contains the name of one theme, and the corresponding sublabels list the indicators included within that theme. All data sources are summarised in online supplemental table 1. ICU, intensive care unit; NDDP, net district domestic product; oVI, Overall Vulnerability Index.
Figure 2
Figure 2
Schematic representation of data layers and approaches of the analyses performed. The left panel exhibits the three-stage procedure used to define the indicator-specific, thematic and overall vulnerability indices (cVIs). the right panel summarises the processing of time-varying R to define instantaneous R and variability summaries and their usage in the Bayesian model averaging-based regression models with the cVIs as covariates. cVI, COVID-19 Vulnerability Index; PIP, posterior inclusion probability.
Figure 3
Figure 3
Summary of estimated time-varying R and COVID-19 incidence across Odisha districts. (A) Estimated time-varying R and 95% CI during 1 May 2020–15 April 2021 for Odisha. The red and green horizontal lines indicate R=2 and R=1, respectively. The vertical lines indicate the beginnings of the national lockdown and unlock periods as labelled. (B) Daily incidence of reported COVID-19 cases during 1 May 2020–15 April 2021 for Odisha. The vertical lines indicate the beginnings of the national lockdown and unlock periods as labelled. (C) The heat map of discretised estimated time-varying R shows the progression of COVID-19 in the state of Odisha over time. The map is read from left to right and colour coded to show the relative numbers of new cases from 1 May 2020–15 April 2021 by the 30 districts of the state. (D) The forest plot of instantaneous R and 95% CI at on 15 April 2021 for the 30 districts and the entire state of Odisha. The left and right vertical lines indicate R=1 and R=2, respectively.
Figure 4
Figure 4
Summary of overall and themed VIs and iR across the 30 districts of Odisha. (A) Overall Vulnerability Index. (B–F) Five themed VIs, as mentioned in the individual panel titles. The size of the red dots is proportional to the corresponding iR on 15 April 2021. (G) Summary of the clusters of districts colour coded and categorised by iR with associated vulnerability themes: SD, HH conditions, PC, EFs and AH. Colours red, blue and green indicate high, moderate and low iR districts, respectively. The theme in bold is the most commonly occurring vulnerability in the cluster. AH, availability of healthcare; cVI, COVID-19 Vulnerability Index; EF, epidemiological factor; HH, housing and hygiene; iR, instantaneous R; PC, preparedness for COVID-19; SD, socioeconomic and demographic; VI, vulnerability index.
Figure 5
Figure 5
Summary of regression models for iR with the VIs as covariates. (A) Themed VIs constituting the Overall Vulnerability Index. (B, C) Indicators within the themes ‘availability of healthcare’ and ‘COVID-19 preparedness’, as mentioned in the individual panel titles. In each case, a Bayesian averaging-based linear regression model is fit using iR as response and the indicators/themes as covariates. The heights of the bars indicate the posterior inclusion probabilities for the covariates in the fitted models, and the labels on top of the bars indicate the signs of the estimated coefficient as obtained in those models. iR, instantaneous R; VI, vulnerability index.

Similar articles

References

    1. Zhang T, Wu Q, Zhang Z. Probable Pangolin origin of SARS-CoV-2 associated with the COVID-19 outbreak. Curr Biol 2020;30:1578–78. 10.1016/j.cub.2020.03.063 - DOI - PMC - PubMed
    1. COVID-19 India. Coronavirus Outbreak in India - covid19india.org, 2021. Available: https://www.covid19india.org/ [Accessed 8 Feb 2021].
    1. The World Bank . Population density (people per SQ. Km of land area) 2021. Available: https://data.worldbank.org/indicator/EN.POP.DNST [Accessed 26 May 2021].
    1. Pal R, Yadav U. COVID-19 pandemic in India: present scenario and a steep Climb ahead. J Prim Care Community Health 2020;11:2150132720939402–02. 10.1177/2150132720939402 - DOI - PMC - PubMed
    1. Ebrahimi M, Malehi AS, Rahim F. COVID-19 patients: a systematic review and meta-analysis of laboratory findings, comorbidities, and clinical outcomes comparing medical staff versus the general population. Osong Public Health Res Perspect 2020;11:269–79. 10.24171/j.phrp.2020.11.5.02 - DOI - PMC - PubMed

Publication types