. 2023 Jan 4;43(1):173-182.
doi: 10.1523/JNEUROSCI.1237-22.2022. Epub 2022 Nov 17.

The Neural Signature of Impaired Inhibitory Control in Individuals with Heroin Use Disorder

Affiliations

The Neural Signature of Impaired Inhibitory Control in Individuals with Heroin Use Disorder

Ahmet O Ceceli et al. J Neurosci. .

Abstract

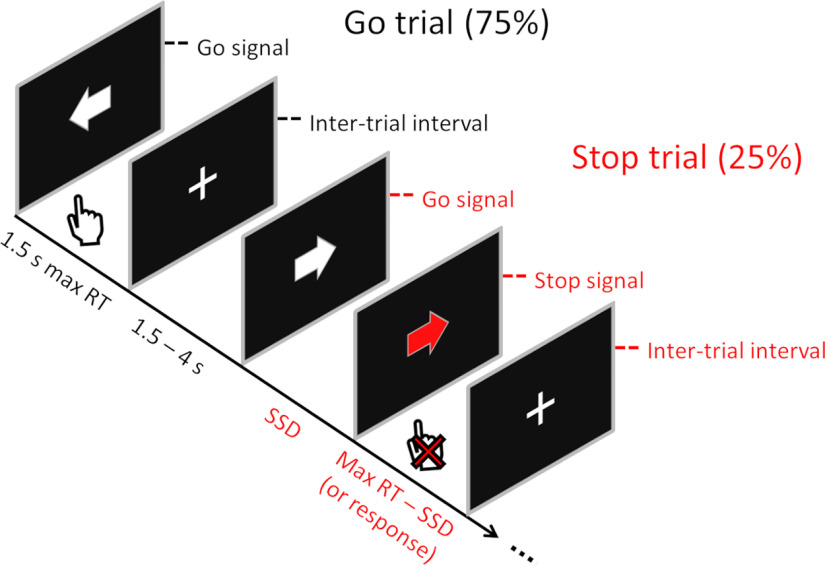
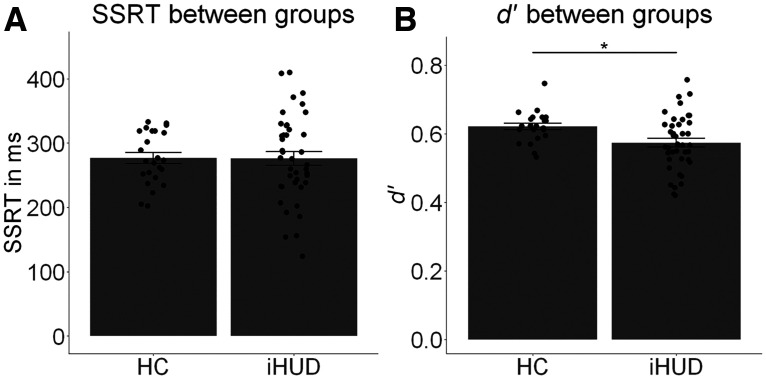
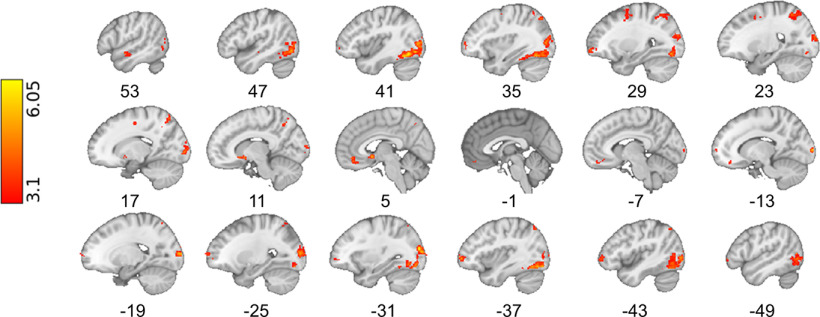
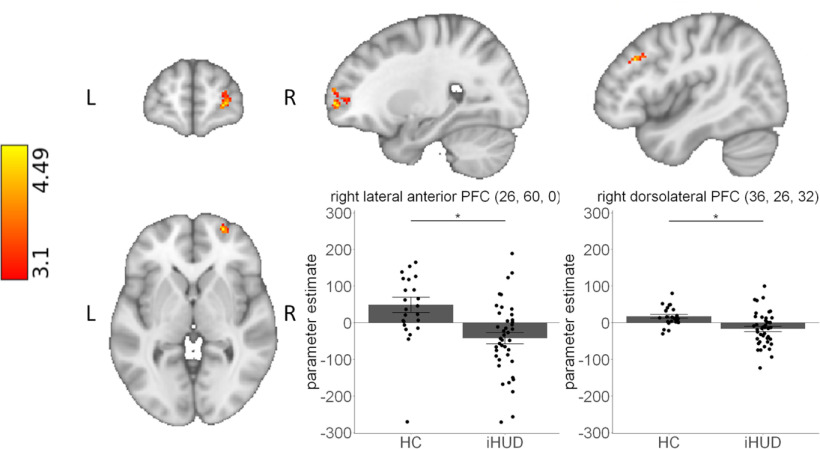
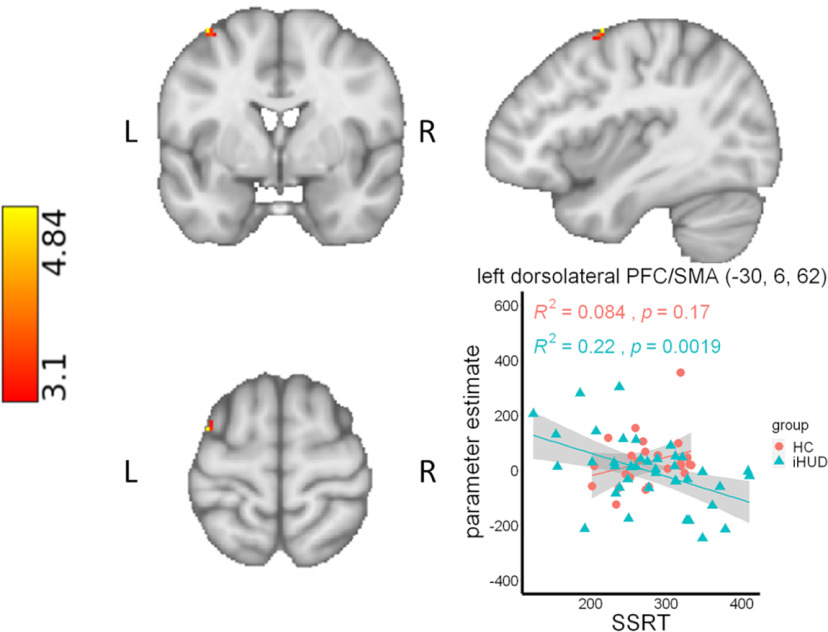
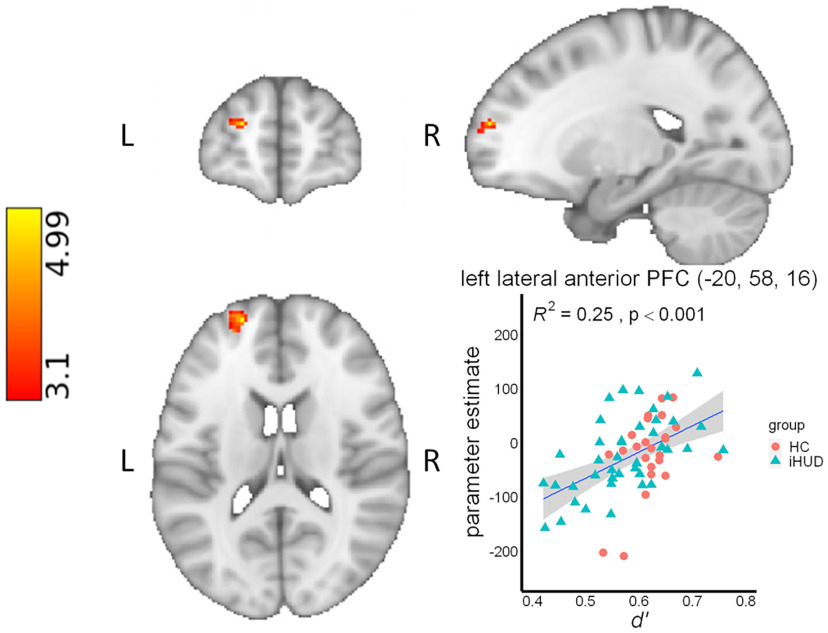
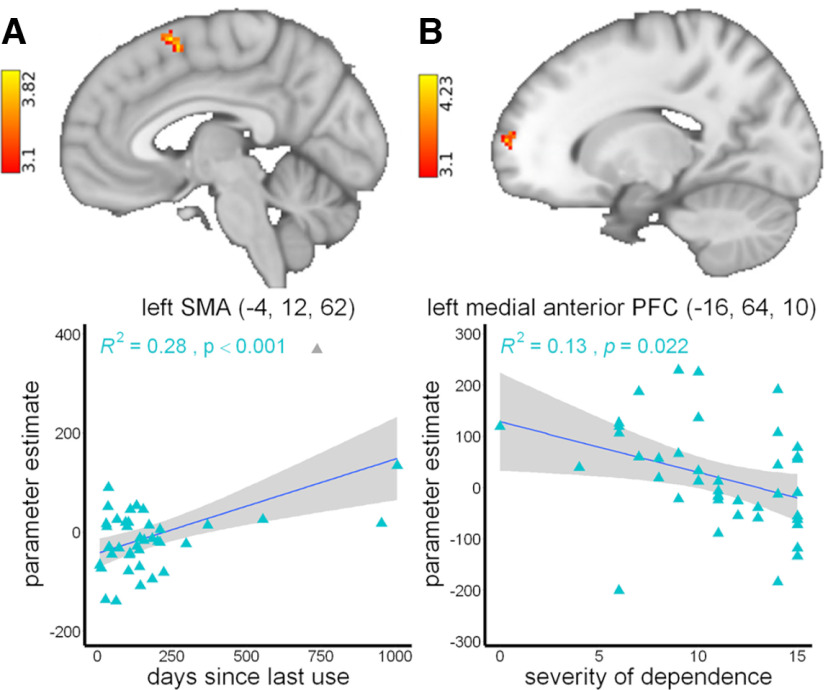
Heroin addiction imposes a devastating toll on society, with little known about its neurobiology. Excessive salience attribution to drug over nondrug cues/reinforcers, with concomitant inhibitory control decreases, are common mechanisms underlying drug addiction. Although inhibitory control alterations generally culminate in prefrontal cortex (PFC) hypoactivations across drugs of abuse, patterns in individuals with heroin addiction (iHUDs) remain unknown. We used a stop-signal fMRI task designed to meet recent consensus guidelines in mapping inhibitory control in 41 iHUDs and 24 age- and sex-matched healthy controls (HCs). Despite group similarities in the stop-signal response time (SSRT; the classic inhibitory control measure), compared with HCs, iHUDs exhibited impaired target detection sensitivity (proportion of hits in go vs false alarms in stop trials; p = 0.003). Additionally, iHUDs exhibited lower right anterior PFC (aPFC) and dorsolateral PFC (dlPFC) activity during successful versus failed stops (the hallmark inhibitory control contrast). Lower left dlPFC/supplementary motor area (SMA) activity was associated with slower SSRT specifically in iHUDs and lower left aPFC activity with worse target sensitivity across all participants (p < 0.05 corrected). Importantly, in iHUDs, lower left SMA and aPFC activity during inhibitory control was associated with shorter time since last use and higher severity of dependence, respectively (p < 0.05 corrected). Together, results revealed lower perceptual sensitivity and hypoactivations during inhibitory control in cognitive control regions (e.g., aPFC, dlPFC, SMA) as associated with task performance and heroin use severity measures in iHUDs. Such neurobehavioral inhibitory control deficits may contribute to self-control lapses in heroin addiction, constituting targets for prevention and intervention efforts to enhance recovery.SIGNIFICANCE STATEMENT Heroin addiction continues its deadly impact, with little known about the neurobiology of this disorder. Although behavioral and prefrontal cortical impairments in inhibitory control characterize addiction across drugs of abuse, these patterns remain underexplored in heroin addiction. Here, we illustrate a significant behavioral impairment in target discrimination in individuals with heroin addiction compared with matched healthy controls. We further show lower engagement during inhibitory control in the anterior and dorsolateral prefrontal cortex (key regions that regulate cognitive control) as associated with slower stopping, worse discrimination, and heroin use measures. Mapping the neurobiology of inhibitory control in heroin addiction for the first time, we identify potential treatment targets inclusive of prefrontal cortex-mediated cognitive control amenable for neuromodulation en route to recovery.

Keywords: cognitive control; opiate; prefrontal cortex; response inhibition; stop-signal task; substance use disorder.


Figures

Figure 1.
Figure 1.
The stop-signal task. Participants are instructed to make directional responses as quickly and accurately as possible to the white arrow stimuli and suppress their responses when the arrow color turns to red after a variable delay (i.e., SSD). Figure adapted from Verbruggen et al. (2019) with permission. RT: response time; s: seconds.
Figure 2.
Figure 2.
Stop-signal task performance. A, B, iHUD and HC participants' (A) SSRT (the classic inhibitory control measure of stopping latency), indicating no significant group differences (p = 0.960) and (B) target detection sensitivity (d′), indicating significantly lower d′ in iHUDs compared with HCs (p = 0.003). Swarm plots indicate individual data points. Error bars indicate SEM. No data points were 3 SDs above or below the mean. Significant group difference flagged with an asterisk.
Figure 3.
Figure 3.
Inhibitory control brain activity recruited by the task. Across all participants, the stop-signal task elicited higher activity in the right supplementary motor area/dorsolateral prefrontal cortex, right lateral anterior prefrontal cortex, and left ventromedial/orbitofrontal prefrontal cortex, among others (Table 3) during successful versus failed stops (the hallmark inhibitory control contrast). Significant results were detected using a cluster-defining threshold of Z > 3.1, corrected to p < 0.05. The labels below each slice indicate x-axis coordinates in the MNI-152 space.
Figure 4.
Figure 4.
Group differences in inhibitory control brain activity. iHUDs, compared with HCs, exhibited significantly lower right lateral anterior PFC (left plot) and right dorsolateral PFC (right plot) activity during successful versus failed stops (the hallmark inhibitory control contrast). Significant results were detected using a cluster-defining threshold of Z > 3.1, corrected to p < 0.05. Bar plots indicate parameter estimates from the voxel with the peak Z score in each cluster. The right dorsolateral PFC cluster is depicted using its center of gravity for visualization purposes. Swarm plots indicate individual data points. Error bars denote SEM. No data points were 3 SDs above or below the mean. Coordinates are in the MNI-152 space. Significant group differences are flagged with an asterisk.
Figure 5.
Figure 5.
Prefrontal cortex correlations with stop-signal response time in iHUDs and HCs. A significant relationship between slower SSRT (the classic inhibitory control measure of stopping latency) and lower left dlPFC/supplementary motor area activity during successful compared with failed stops (the hallmark inhibitory control contrast) was evident specifically in iHUDs compared with HCs. Significant results were detected within a small volume corrected PFC mask, using a cluster-defining threshold of Z > 3.1, corrected to p < 0.05. No data points were 3 SDs above or below the mean. Coordinates are in the MNI-152 space.
Figure 6.
Figure 6.
Prefrontal cortex correlations with target detection sensitivity in iHUDs and HCs. A significant relationship between worse target detection sensitivity (d′) and lower left lateral aPFC activity during successful compared with failed stops (the hallmark inhibitory control contrast) was evident across all participants. Significant results were detected within a small volume corrected PFC mask, using a cluster-defining threshold of Z > 3.1, corrected to p < 0.05. No data points were 3 SDs above or below the mean. Coordinates are in the MNI-152 space.
Figure 7.
Figure 7.
Prefrontal cortex correlations with heroin use severity measures in iHUDs. A, B, Fewer days since last use was associated with lower SMA activity (A), and higher severity of dependence was associated with lower aPFC activity (B) during successful compared with failed stops (the hallmark inhibitory control contrast) in iHUDs. Significant results were detected within a small volume corrected PFC mask, using a cluster-defining threshold of Z > 3.1, corrected for familywise error for five heroin use severity measures (p < 0.05/5 = 0.01). In A two participants' days since last use were 3 SDs above the mean. Excluding these outlier data points did not substantially affect the results (R2 = 0.34, p < 0.001). One participant's SMA activity was identified as an outlier, and excluding this data point reduced this correlation to a trend level when accounting for five heroin use severity measures (R2 = 0.16, p = 0.012, α = 0.01). Nevertheless, a robust regression including the outliers supported the significant effect when assuming a normal t distribution (t = 4.908, β = 1.147, SE = 0.23, p < 0.001). The SMA outlier data point is denoted in gray, with the regression line reflecting all data points. Coordinates are in the MNI-152 space.

References

    1. Ahn W-Y, Vassileva J (2016) Machine-learning identifies substance-specific behavioral markers for opiate and stimulant dependence. Drug Alcohol Depend 161:247–257. 10.1016/j.drugalcdep.2016.02.008 - DOI - PMC - PubMed
    1. Alderson-Day B, Fernyhough C (2015) Inner speech: development, cognitive functions, phenomenology, and neurobiology. Psychol Bull 141:931–965. 10.1037/bul0000021 - DOI - PMC - PubMed
    1. Aron AR (2007) The neural basis of inhibition in cognitive control. Neuroscientist 13:214–228. 10.1177/1073858407299288 - DOI - PubMed
    1. Aron AR, Poldrack RA (2006) Cortical and subcortical contributions to stop signal response inhibition: role of the subthalamic nucleus. J Neurosci 26:2424–2433. 10.1523/JNEUROSCI.4682-05.2006 - DOI - PMC - PubMed
    1. Aron AR, Robbins TW, Poldrack RA (2014) Inhibition and the right inferior frontal cortex: one decade on. Trends Cogn Sci 18:177–185. 10.1016/j.tics.2013.12.003 - DOI - PubMed

Publication types