. 2022 Nov 17;12(1):19759.
doi: 10.1038/s41598-022-23806-5.

Evidence, detailed characterization and clinical context of complement activation in acute multisystem inflammatory syndrome in children

Affiliations

Evidence, detailed characterization and clinical context of complement activation in acute multisystem inflammatory syndrome in children

György Sinkovits et al. Sci Rep. .

Abstract

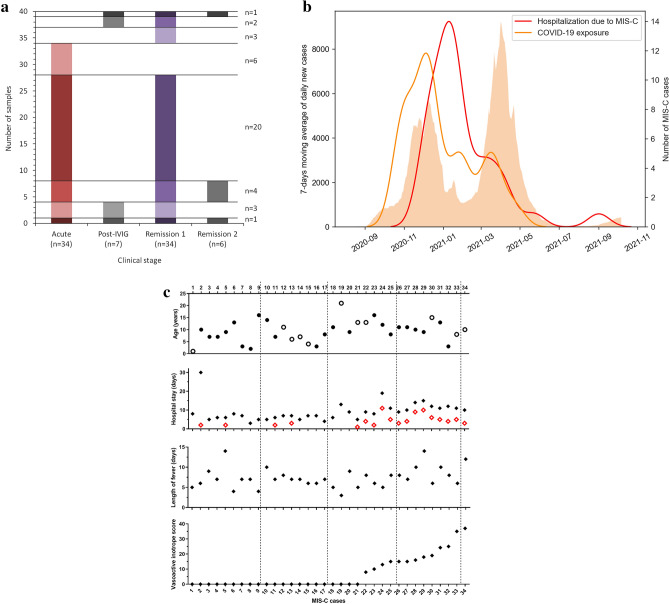
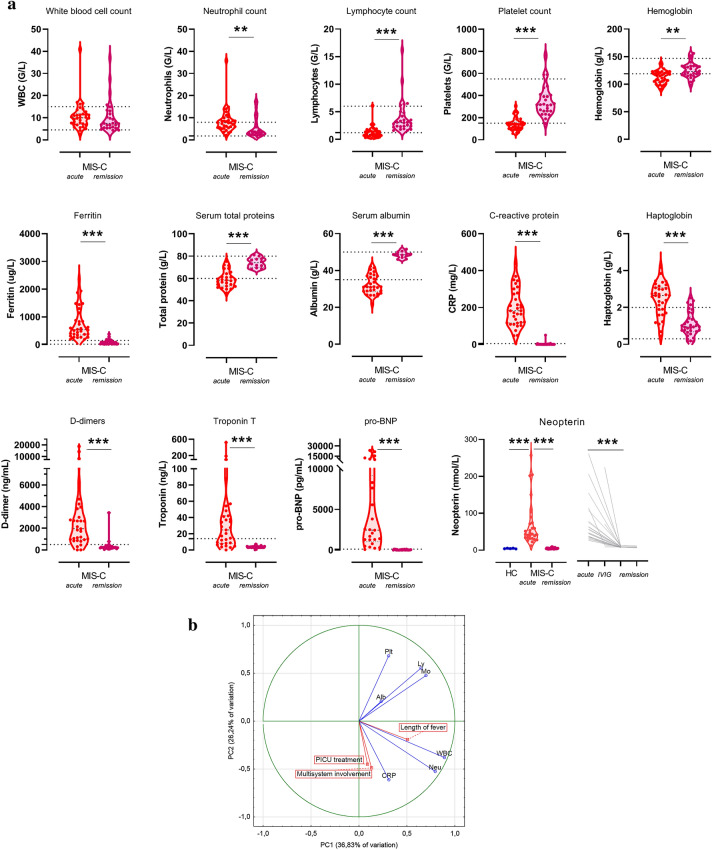
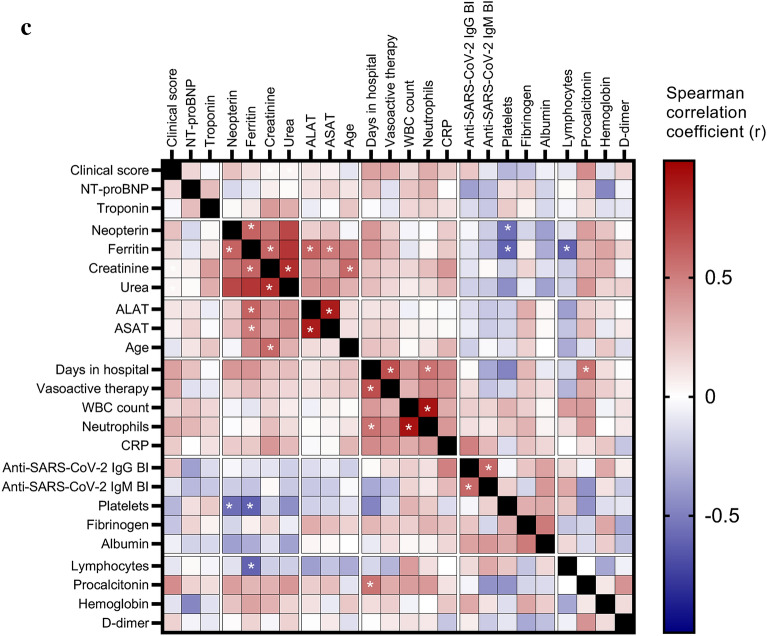
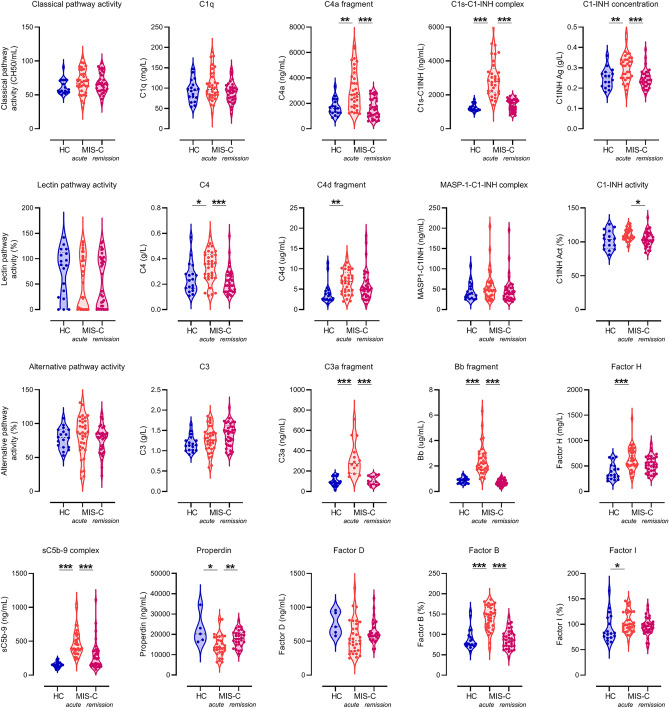
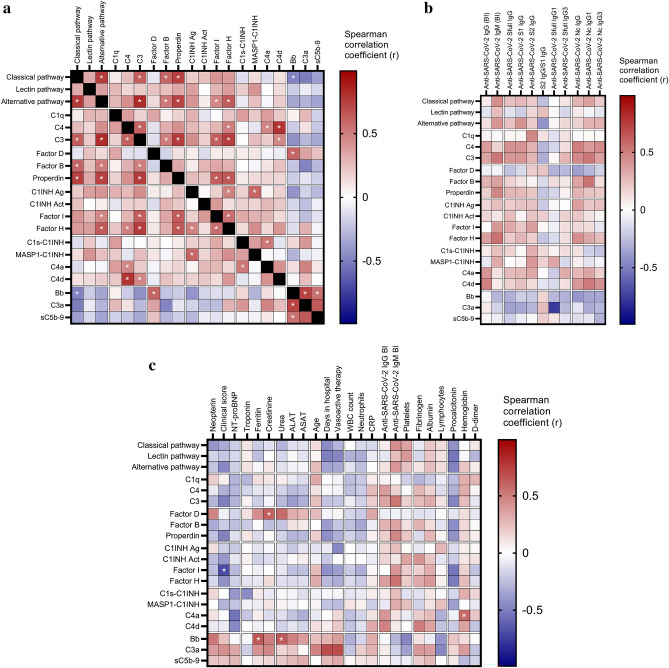
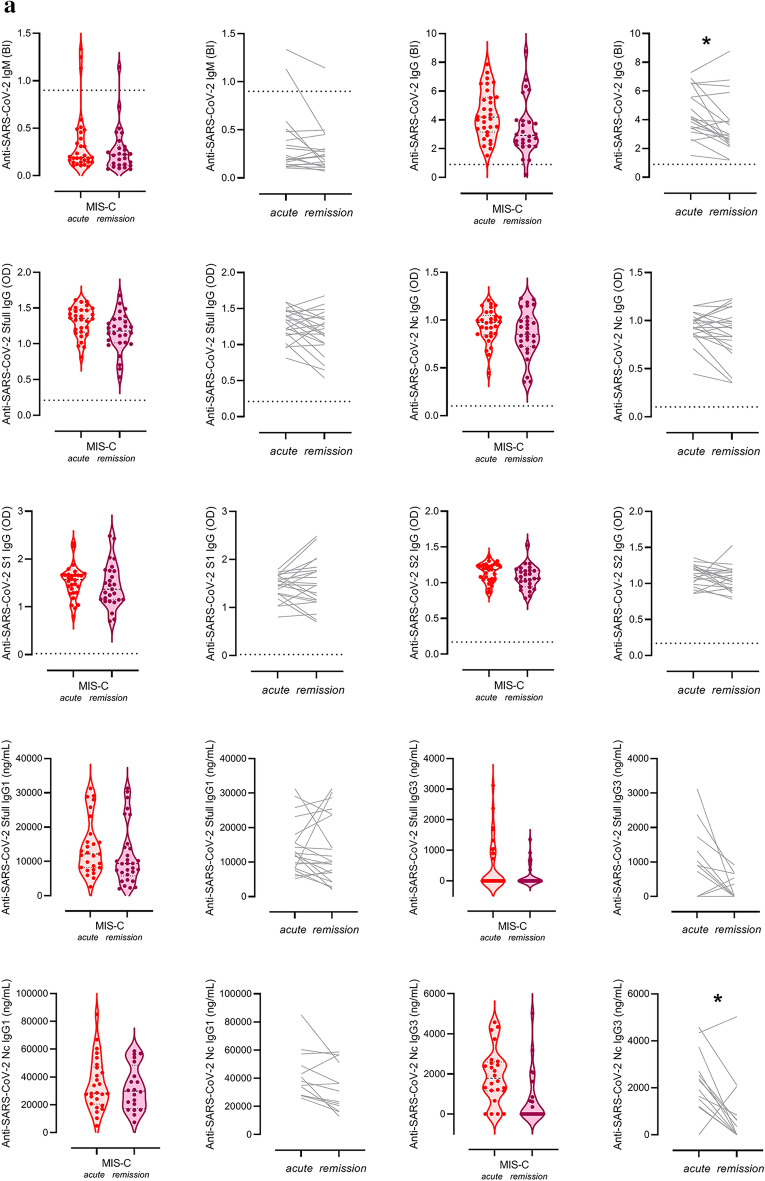
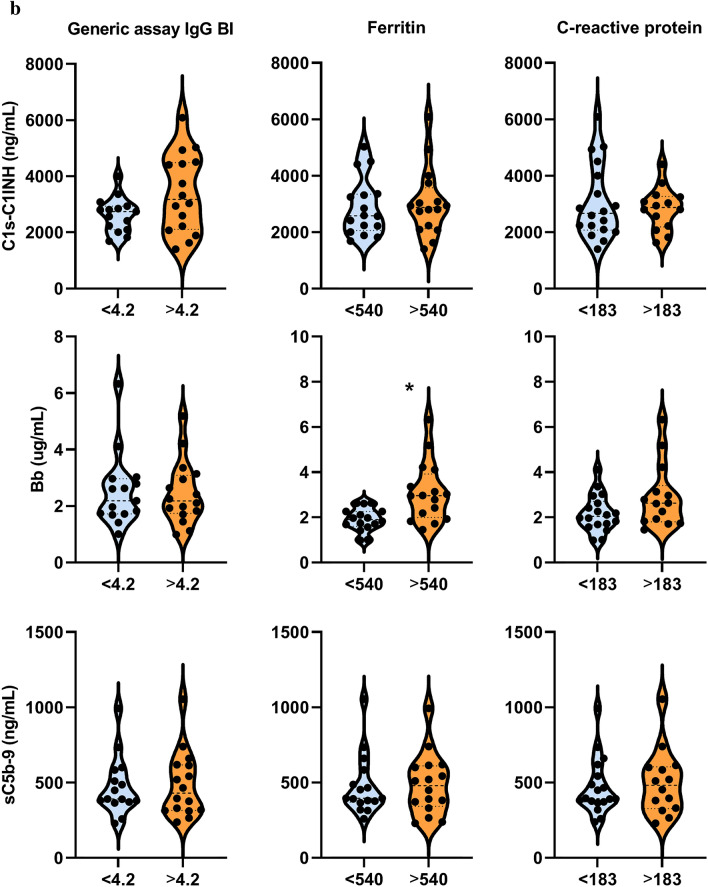
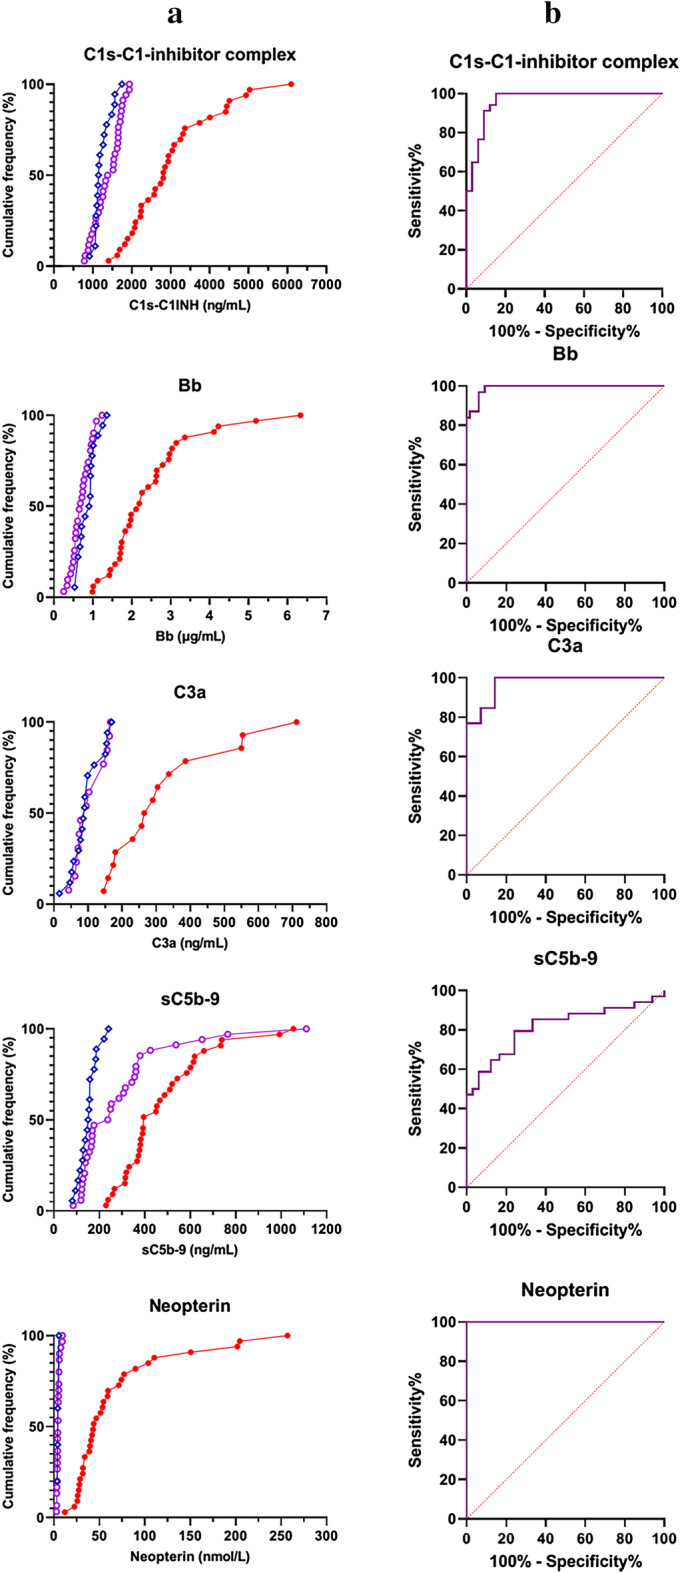
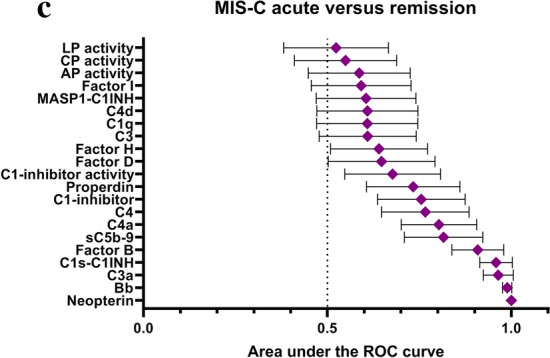
Multisystem inflammatory syndrome in children (MIS-C) is a rare, life-threatening complication of severe acute respiratory syndrome coronavirus 2 (SARS-CoV-2) infection. MIS-C develops with high fever, marked inflammation and shock-like picture several weeks after exposure to, or mild infection with SARS-CoV-2. Deep immune profiling identified activated macrophages, neutrophils, B-plasmablasts and CD8 + T cells as key determinants of pathogenesis together with multiple inflammatory markers. The disease rapidly responds to intravenous immunoglobulin (IVIG) treatment with clear changes of immune features. Here we present the results of a comprehensive analysis of the complement system in the context of MIS-C activity and describe characteristic changes during IVIG treatment. We show that activation markers of the classical, alternative and terminal pathways are highly elevated, that the activation is largely independent of anti-SARS-CoV-2 humoral immune response, but is strongly associated with markers of macrophage activation. Decrease of complement activation is closely associated with rapid improvement of MIS-C after IVIG treatment.


Conflict of interest statement

L. W. and E. T. are employees of Hycult Biotech. Other authors have no conflict of interest to declare.

Figures

Figure 1
Figure 1
Demographic and clinical data of the MIS-C cohort. (a): Study samples included shown by clinical stage. The left axis shows number of cases, case numbers (n) written on the right sum up cases falling into the various sample combination groups. (b): 7-days moving average of daily new COVID-19 cases in Hungary (orange columns, left y axis), as identified by PCR or rapid antigen testing (source: koronavirus.gov.hu, downloaded 27-01-2022). Red line: Kernel density estimation (KDE) plot fitted on the MIS-C cases admitted to the Heim Pál National Pediatric Institute and University of Szeged between 25-11-2020 and 27-08-2021. Orange line: KDE plot fitted on COVID-19 exposures for 24/34 MIS-C cases, for whom information on contact was available. The KDE curves indicate the estimated number of COVID-19 exposures or MIS-C cases, respectively, expressed as cases per 30 days (right axis). (c) Age (solid symbols: males, open symbols: females) and disease severity indicators of MIS-C cases (for hospital stay solid diamonds: days hospitalized, open diamonds days in PICU). For calculation of vasoactive inotrope score see the "materials and methods" section.
Figure 2
Figure 2
Disease severity marker levels before and after IVIG therapy in the MIS-C cohort. (a): Pre- and > 10 days post-IVIG treatment (denoted acute and remission) absolute blood counts and clinical laboratory results of the 34 MIS-C cases. The horizontal lines indicate the age-specific reference ranges. Since no established reference range was available for neopterin, results of healthy controls are shown for this marker, together with individual changes of levels during IVIG treatment and in remission. P value symbols (**p < 0.01, ***p < 0.001) indicate significant results after 5% false discovery rate correction using the Benjamini–Hochberg method. (b): Principal component analysis loading plot of the top 7 features contributing to principal components one and two. Loading of length of fever, PICU treatment and extent of multisystem involvement (indicated by boxes) are shown as supplementary variables. (c): Heatmap of correlation matrix of clinical and laboratory markers of MIS-C. Clinical score indicates the total number of organ systems involved, including skin (rash, feet and hands signs), mucosal (conjunctivitis, cheilits, oral mucositis), gastrointestinal (diarrhea, vomiting, abdominal pain) and cardiac involvement. Color-coding indicates the strength of each correlation (Spearman correlation coefficients) with asterisks indicating significance (* indicate p < 0.003 significant results, the limit was obtained after 5% false discovery rate correction using the Benjamini–Hochberg method). Non-significant differences are not marked.
Figure 2
Figure 2
Disease severity marker levels before and after IVIG therapy in the MIS-C cohort. (a): Pre- and > 10 days post-IVIG treatment (denoted acute and remission) absolute blood counts and clinical laboratory results of the 34 MIS-C cases. The horizontal lines indicate the age-specific reference ranges. Since no established reference range was available for neopterin, results of healthy controls are shown for this marker, together with individual changes of levels during IVIG treatment and in remission. P value symbols (**p < 0.01, ***p < 0.001) indicate significant results after 5% false discovery rate correction using the Benjamini–Hochberg method. (b): Principal component analysis loading plot of the top 7 features contributing to principal components one and two. Loading of length of fever, PICU treatment and extent of multisystem involvement (indicated by boxes) are shown as supplementary variables. (c): Heatmap of correlation matrix of clinical and laboratory markers of MIS-C. Clinical score indicates the total number of organ systems involved, including skin (rash, feet and hands signs), mucosal (conjunctivitis, cheilits, oral mucositis), gastrointestinal (diarrhea, vomiting, abdominal pain) and cardiac involvement. Color-coding indicates the strength of each correlation (Spearman correlation coefficients) with asterisks indicating significance (* indicate p < 0.003 significant results, the limit was obtained after 5% false discovery rate correction using the Benjamini–Hochberg method). Non-significant differences are not marked.
Figure 3
Figure 3
Detailed complement profile of the MIS-C cohort before, during and after IVIG therapy, and of healthy controls. Levels of the complement pathway (classical-, lectin- and alternative) activities, factors (C1q, C4, C3, Factors D, B and properdin) and regulators (C1-inhibitor antigen and activity, Factors H and I) were determined in serum, whereas that of activation products (C1s-C1-inhibitor complex, MASP1-C1-inhibitor complex, C4a, C4d, C3a, Bb and sC5b-9) in EDTA plasma. Violin plots (with dashed horizontal lines indicating the median values, dotted lines indicating the quartiles) show results for the 18 healthy control children (HC), and for all MIS-C cases who had samples from acute stage, before IVIG treatment, or from stable remission after hospital discharge. P values for the pair-wise group comparisons (HC-acute and acute-remission groups) on the violin plots were calculated by the Mann–Whitney test. Non-significant differences are not marked, and p value symbols (*p < 0.05, **p < 0.01, ***p < 0.001) indicate significant results after 5% false discovery rate correction using the Benjamini–Hochberg method.
Figure 4
Figure 4
Associations between complement markers, clinical, laboratory and anti-SARS-CoV-2 humoral immune response features in the MIS-C cohort. Heatmap of correlation matrix of complement markers (Panel (a), complement markers and clinical and laboratory features (Panel b), complement markers and SARS-CoV-2 humoral immune response measures (Panel c). Color-coding indicates the strength of each correlation (Spearman correlation coefficients) with asterisks indicating significance (* indicate on Panel (a) p < 0.007, on Panel (c) p < 0.005 significant results, the limit was obtained after 5% false discovery rate correction using the Benjamini–Hochberg method).
Figure 5
Figure 5
Association between biochemical markers of complement and anti-SARS-CoV2 antibody response, macrophage activation, acute phase reaction and clinical severity of MIS-C. (a): Violin plots (with horizontal lines indicating the median values) show results for the MIS-C cases that had samples from acute stage, before IVIG treatment, or from stable remission after hospital discharge. Grey lines show changes of marker levels for individual MIS-C cases from before treatment ('acute') after hospital discharge in remission ('remission"). P values for the line charts were obtained by the Wilcoxon matched-pairs ranked sum test. Non-significant differences are not marked, and p value symbols (*p < 0.05, **p < 0.01, ***p < 0.001) indicate significant results after 5% false discovery rate correction using the Benjamini–Hochberg method. (b): Violin plots showing classical- (C1s-C1-inhibitor complex), alternative- (Bb fragment) and terminal pathway (sC5b-9 complex) activation marker levels in groups with low (below median) or high (above median) anti-SARS-CoV-2 spike and nucleocapsid IgG levels (Generic assay IgG binding index), macrophage activation (ferritin levels) or acute phase reaction (CRP concentration). * indicates p = 0.002, considered significant after 5% false discovery rate correction using the Benjamini–Hochberg method.
Figure 5
Figure 5
Association between biochemical markers of complement and anti-SARS-CoV2 antibody response, macrophage activation, acute phase reaction and clinical severity of MIS-C. (a): Violin plots (with horizontal lines indicating the median values) show results for the MIS-C cases that had samples from acute stage, before IVIG treatment, or from stable remission after hospital discharge. Grey lines show changes of marker levels for individual MIS-C cases from before treatment ('acute') after hospital discharge in remission ('remission"). P values for the line charts were obtained by the Wilcoxon matched-pairs ranked sum test. Non-significant differences are not marked, and p value symbols (*p < 0.05, **p < 0.01, ***p < 0.001) indicate significant results after 5% false discovery rate correction using the Benjamini–Hochberg method. (b): Violin plots showing classical- (C1s-C1-inhibitor complex), alternative- (Bb fragment) and terminal pathway (sC5b-9 complex) activation marker levels in groups with low (below median) or high (above median) anti-SARS-CoV-2 spike and nucleocapsid IgG levels (Generic assay IgG binding index), macrophage activation (ferritin levels) or acute phase reaction (CRP concentration). * indicates p = 0.002, considered significant after 5% false discovery rate correction using the Benjamini–Hochberg method.
Figure 6
Figure 6
Ranking of complement and macrophage measures as markers of acute MIS-C and therapy response (a): Cumulative frequencies (%) of MIS-C cases in acute (red, solid circles) or in remission (purple, open circles) stage, and of healthy controls (blue, open rhombus), plotted against the range of selected complement- and macrophage activation markers. (b): Performance of complement activation marker and neopterin levels to describe therapy responses in MIS-C (ROC-analysis). (c): Area under the curve (AUC) values with 95% confidence intervals.
Figure 6
Figure 6
Ranking of complement and macrophage measures as markers of acute MIS-C and therapy response (a): Cumulative frequencies (%) of MIS-C cases in acute (red, solid circles) or in remission (purple, open circles) stage, and of healthy controls (blue, open rhombus), plotted against the range of selected complement- and macrophage activation markers. (b): Performance of complement activation marker and neopterin levels to describe therapy responses in MIS-C (ROC-analysis). (c): Area under the curve (AUC) values with 95% confidence intervals.

References

    1. Payne AB, et al. Incidence of multisystem inflammatory syndrome in children among US persons infected with SARS-CoV-2. JAMA Netw. Open. 2021;4:e2116420. doi: 10.1001/jamanetworkopen.2021.16420. - DOI - PMC - PubMed
    1. Abrams JY, et al. Factors linked to severe outcomes in multisystem inflammatory syndrome in children (MIS-C) in the USA: A retrospective surveillance study. Lancet Child Adolesc. Health. 2021;5:323–331. doi: 10.1016/s2352-4642(21)00050-x. - DOI - PMC - PubMed
    1. Syrimi E, et al. The immune landscape of SARS-CoV-2associated multisystem inflammatory syndrome in children (MISC) from acute disease to recovery. iScience. 2021;24:103215. doi: 10.1016/j.isci.2021.103215. - DOI - PMC - PubMed
    1. Ramaswamy A, et al. Immune dysregulation and autoreactivity correlate with disease severity in SARS-CoV-2-associated multisystem inflammatory syndrome in children. Immunity. 2021;54:1083–1095.e1087. doi: 10.1016/j.immuni.2021.04.003. - DOI - PMC - PubMed
    1. Porritt RA, et al. The autoimmune signature of hyperinflammatory multisystem inflammatory syndrome in children. J. Clin. Invest. 2021 doi: 10.1172/jci151520. - DOI - PMC - PubMed

Publication types

Substances

Supplementary concepts

Grants and funding