

Relationship between red blood cell aggregation and dextran molecular mass
- PMID: 36396711
- PMCID: PMC9670059
- DOI: 10.1038/s41598-022-24166-w
Relationship between red blood cell aggregation and dextran molecular mass
Abstract
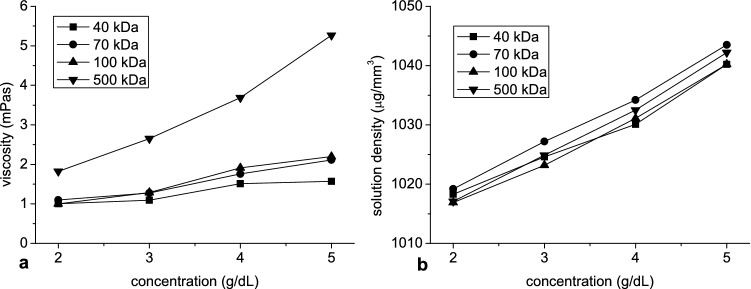
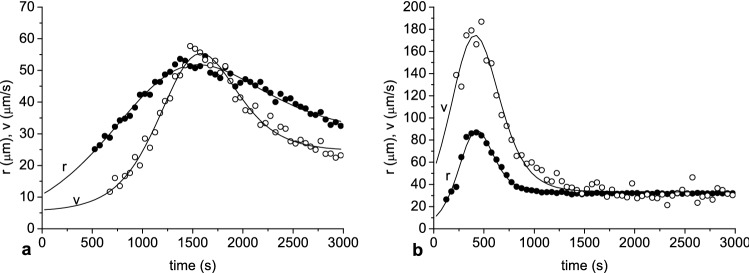
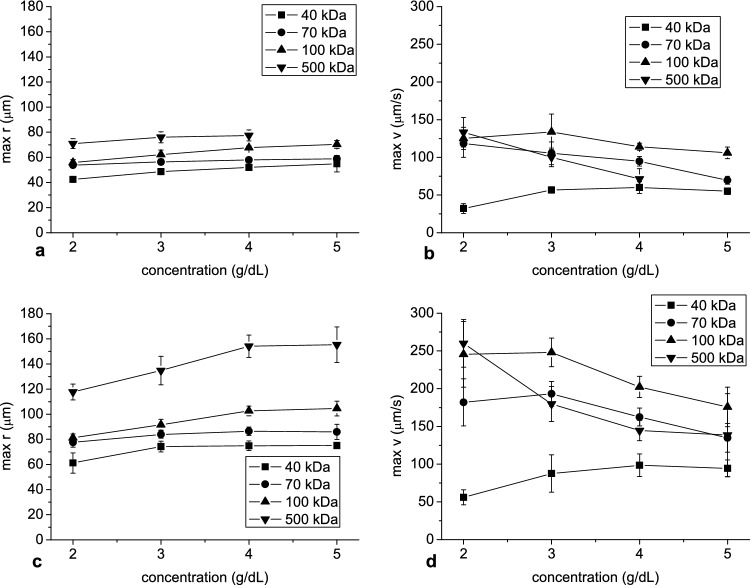
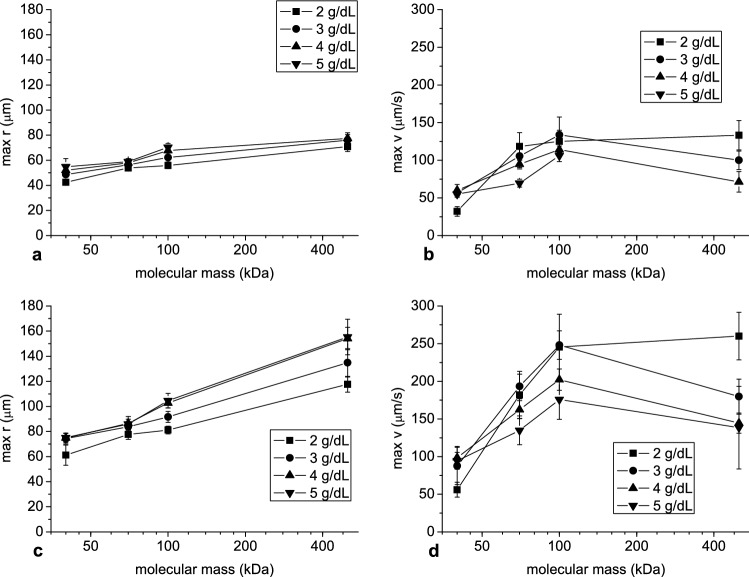
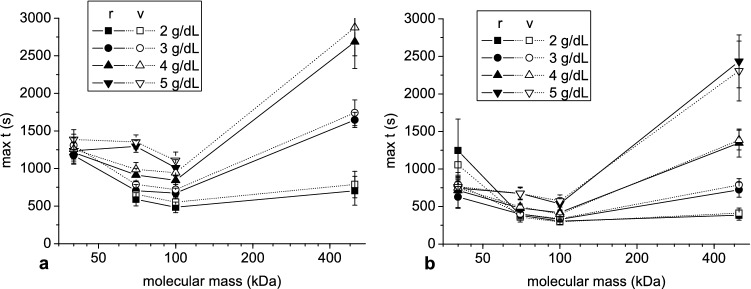
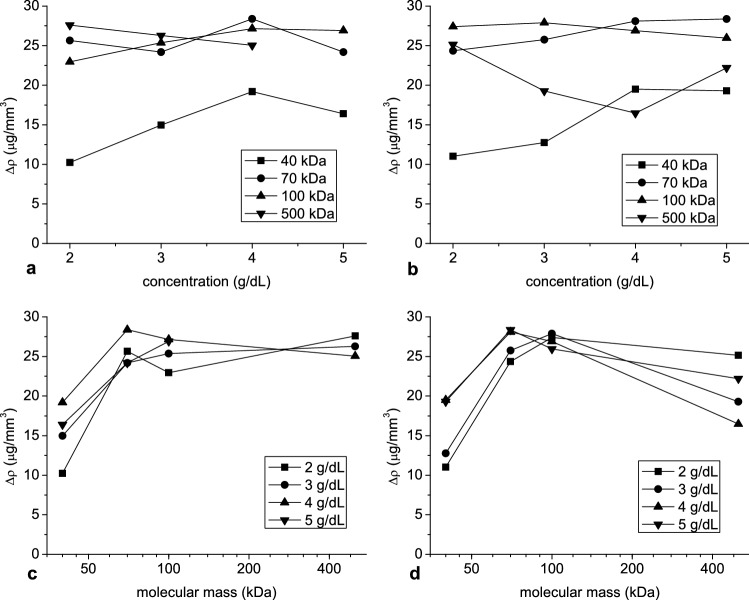
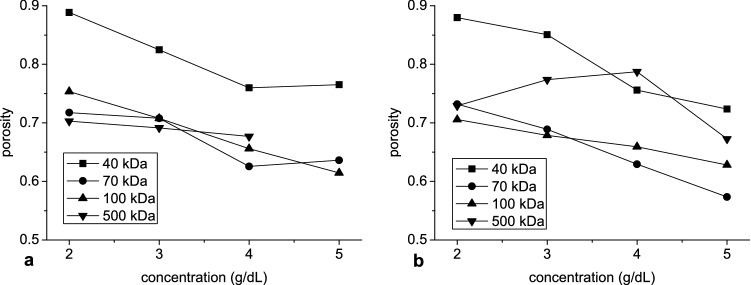
The aim of this study was to investigate the aggregation of red blood cells (RBCs) suspended in dextran solution at various levels of molecular mass. Dextran solutions at molecular mass 40, 70, 100 and 500 kDa at concentration from 2 to 5 g/dL were used to suspend the RBCs. The radius and velocity of sedimenting RBC aggregates were investigated using image analysis. The radius and sedimentation velocity of aggregates increased initially, then decreased after achieving maxima. The maximal velocity of RBC aggregates showed a bell-shaped dependence on dextran molecular mass and concentration, whereas maximal radius showed monotonic increase with both factors. Difference between aggregate and solution density was estimated using aggregate radius and sedimentation velocity and dextran solution viscosity, and was consistent across most molecular mass and concentration levels. This allowed to calculate the porosity of aggregates and to show that it monotonically decreased with the increase in the solution density, caused by the increase in the dextran concentration. The results provide insight into the RBC aggregation process in solutions of proteins of different size, reflecting various pathological conditions. The currently reported data can be potentially applied to specific pathophysiological conditions giving an interpretation that is not yet fully discussed in the literature.
© 2022. The Author(s).
Conflict of interest statement
The authors declare no competing interests.
Figures

Similar articles
-
Size determination of red blood cell aggregates induced by dextran using ultrasound backscattering phenomenon.Biorheology. 1990;27(1):39-46. doi: 10.3233/bir-1990-27104. Biorheology. 1990. PMID: 1694460
-
Assessment of red blood cell aggregation with dextran by ultrasonic interferometry.Biorheology. 1991;28(1-2):89-97. doi: 10.3233/bir-1991-281-209. Biorheology. 1991. PMID: 1710940
-
Aggregation of human RBC in binary dextran-PEG polymer mixtures.Biorheology. 2001;38(1):53-68. Biorheology. 2001. PMID: 11381165
-
Effects of dextran molecular weight on red blood cell aggregation.Biophys J. 2008 Sep 15;95(6):3059-65. doi: 10.1529/biophysj.108.130328. Epub 2008 Jun 27. Biophys J. 2008. PMID: 18586848 Free PMC article.
-
Erythrocyte aggregation: basic aspects and clinical importance.Clin Hemorheol Microcirc. 2013;53(1-2):23-37. doi: 10.3233/CH-2012-1573. Clin Hemorheol Microcirc. 2013. PMID: 22975932 Review.
Cited by
-
Aggregation and disaggregation of red blood cells: Depletion versus bridging.Biophys J. 2025 Apr 15;124(8):1285-1297. doi: 10.1016/j.bpj.2025.03.007. Epub 2025 Mar 13. Biophys J. 2025. PMID: 40087863 Free PMC article.
-
A Coordinated Translational Control Mediated by eEF2 Phosphorylation Safeguards Erythroid Differentiation.Int J Mol Sci. 2025 May 16;26(10):4801. doi: 10.3390/ijms26104801. Int J Mol Sci. 2025. PMID: 40429942 Free PMC article.
-
Heparin-like effect of a dual antiplatelet and anticoagulant (APAC) agent on red blood cell deformability and aggregation in an experimental model.J Thromb Thrombolysis. 2024 Dec;57(8):1329-1338. doi: 10.1007/s11239-024-03040-8. Epub 2024 Sep 4. J Thromb Thrombolysis. 2024. PMID: 39231863 Free PMC article.
-
The Impact of Targeted Therapies on Red Blood Cell Aggregation in Patients with Chronic Lymphocytic Leukemia Evaluated Using Software Image Flow Analysis.Micromachines (Basel). 2025 Jan 15;16(1):95. doi: 10.3390/mi16010095. Micromachines (Basel). 2025. PMID: 39858750 Free PMC article.
-
Microfluidic Chip for Quantitatively Assessing Hemorheological Parameters.Micromachines (Basel). 2025 May 8;16(5):567. doi: 10.3390/mi16050567. Micromachines (Basel). 2025. PMID: 40428693 Free PMC article.
References
-
- Nader E, et al. Increased blood viscosity and red blood cell aggregation in patients with COVID-19. Am. J. Hematol. 2022;97(3):283–292. - PubMed
-
- Ponder E. On Sedimentation and rouleaux formation – II. Exp. Physiol. 1926;16:173–194.
MeSH terms
Substances
LinkOut - more resources
Full Text Sources
