. 2022 Dec;19(12):1563-1567.
doi: 10.1038/s41592-022-01669-y. Epub 2022 Nov 17.

RS-FISH: precise, interactive, fast, and scalable FISH spot detection

Affiliations

RS-FISH: precise, interactive, fast, and scalable FISH spot detection

Ella Bahry et al. Nat Methods. 2022 Dec.

Abstract

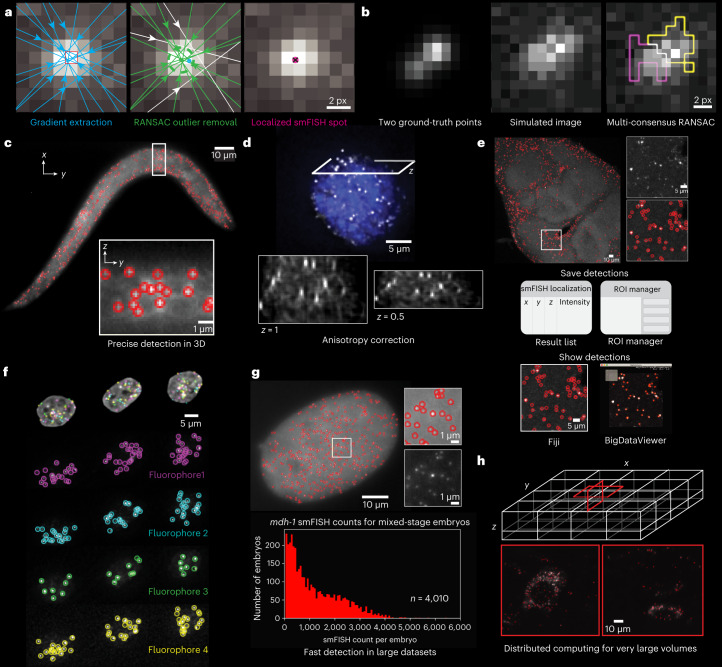
Fluorescent in-situ hybridization (FISH)-based methods extract spatially resolved genetic and epigenetic information from biological samples by detecting fluorescent spots in microscopy images, an often challenging task. We present Radial Symmetry-FISH (RS-FISH), an accurate, fast, and user-friendly software for spot detection in two- and three-dimensional images. RS-FISH offers interactive parameter tuning and readily scales to large datasets and image volumes of cleared or expanded samples using distributed processing on workstations, clusters, or the cloud. RS-FISH maintains high detection accuracy and low localization error across a wide range of signal-to-noise ratios, a key feature for single-molecule FISH, spatial transcriptomics, or spatial genomics applications.


Conflict of interest statement

The authors declare no competing interests.

Figures

Fig. 1
Fig. 1. RS-FISH accurately detects fluorescent spots.
a, Illustration depicting single fluorescent spot detection using RS-based RANSAC. Left, gradients (blue lines) calculated in a local patch around a DoG-detected location (red square) for RS fitting. Middle, intensity gradients that agree on a common center point (green gradients, green dot) given a defined error (green dotted circle) are identified using RANSAC outlier removal, and rejected gradients are plotted in white. Using all gradients would lead to a different center point (blue). Right, the final RS-FISH center spot (pink dot with black cross) is computed by intersecting all green (inlier) gradients. b, Detecting two close spots using multi-consensus RANSAC. Both points are detected as a single DoG spot owing to a high noise level. Multi-consensus RANSAC identified two independent spots visualized as yellow and pink sets of pixels (that is, gradients). c, Single zslice through the 3D image of a C. elegans larva expressing lea-1 mRNA (smFISH labeling). Red circles highlight the RS-FISH-detected spots, and the encircled area is shown as x-slice below. Images are representative of four experimental replicates. d, To correctly detect spots in anisotropic images, a global scale factor estimated from the data is computed. The example image shows a mouse embryonic stem cell labeled by smFISH for Cdx2 mRNA. e, RS-FISH detections can be exported as result table or CSV file or transferred to the ROI manager, and can be overlayed onto data for inspection using Fiji or BigDataViewer. The example image shows a max projection of five z-slices of a Drosophila brain with smFISH labeled for Pura mRNA. f, OligoFISSEQ-labeled PGP1f cells using barcodes with four different fluorophores showing one round of labeling. RS-FISH detected spots are labeled in four different colors. (Images by Nguyen et al.). g, RS-FISH scales to large datasets, shown for 4,010 mixed-stage C. elegans embryos with mdh-1 mRNA smFISH labeling. h, Large N5 image volumes, like the EASI-FISH 148-GB lightsheet image of a tissue section of the lateral hypothalamus (data by Wang et al.), were analyzed with the Apache Spark version of RS-FISH.
Fig. 2
Fig. 2. Performance of different spot localization tools.
a, Detection accuracy for different tools was analyzed using the F1 score calculated from true-positive (red circle, white spot), false-positive (red circle, no spot), and false-negative (no circle, white spot) detection. Corresponding false-positive and false-negative values can be found in Supplementary Figure SN4.2, in which data are represented as a boxplot with the full outlier range. F1 score and localization error were determined using a set of 50 simulated images (256 × 256 × 32 pixels), with different noise levels (example images in Supplementary Fig. 4.1) containing either 30 spots (n = 39) or 300 spots (n = 11). The best detection parameters for each tool were determined by a grid search over the parameter space (details in Supplementary Notes). b, Localization error was measured as Euclidean distance (pixels) between the detected spot center and the ground-truth center of simulated spots for the same set of images described in a. c, Histograms of distance deltas of the ground truth to its corresponding localized spot separated by image dimensions (x,y,z) for the different tools, showing that all methods are highly accurate while precision varies. The corresponding localization error for each dimension separately can be found in Supplementary Fig. SN4.2d,e. d, Comparison of processing speed for 13 real 3D smFISH images of C. elegans embryos, with images sized around 30 MB containing an average of ~350 spots per image (example images in Supplementary Fig. SN4.1). Bar plots in a, b, and d, as well as the line plots in e and f, show the mean and a 95% confidence interval of the 50 measured detections. e, Influence of different image noise levels on spot detection. Plot displays detection accuracy measured as F1 score (y axis) against the s.d. of image noise (x axis). Example images corresponding to the different noise levels are displayed below the graph. f, Influence of image noise on the localization error measured in Euclidean distance to the center of simulated points (ground truth) against the s.d. of image noise, using the same data as shown in b. For af, details on run parameters and tables with raw values are in Supplementary Notes.

References

    1. Raj A, van den Bogaard P, Rifkin SA, van Oudenaarden A, Tyagi S. Imaging individual mRNA molecules using multiple singly labeled probes. Nat. Publ. Group. 2008;5:877–879. - PMC - PubMed
    1. Femino AM, Fay FS, Fogarty K, Singer RH. Visualization of single RNA transcripts in situ. Science. 1998;280:585–590. doi: 10.1126/science.280.5363.585. - DOI - PubMed
    1. Nguyen HQ, et al. 3D mapping and accelerated super-resolution imaging of the human genome using in situ sequencing. Nat. Methods. 2020;17:822–832. doi: 10.1038/s41592-020-0890-0. - DOI - PMC - PubMed
    1. Beliveau BJ, et al. Versatile design and synthesis platform for visualizing genomes with Oligopaint FISH probes. Proc. Natl Acad. Sci. 2012;109:21301–21306. doi: 10.1073/pnas.1213818110. - DOI - PMC - PubMed
    1. Wang F, et al. RNAscope a novel in situ RNA analysis platform for formalin-fixed, paraffin-embedded tissues. J. Mol. Diagnostics. 2012;14:22–29. doi: 10.1016/j.jmoldx.2011.08.002. - DOI - PMC - PubMed

Publication types

Substances