. 2022 Dec;7(12):2039-2053.
doi: 10.1038/s41564-022-01261-2. Epub 2022 Nov 17.

PCRCR complex is essential for invasion of human erythrocytes by Plasmodium falciparum

Affiliations

PCRCR complex is essential for invasion of human erythrocytes by Plasmodium falciparum

Stephen W Scally et al. Nat Microbiol. 2022 Dec.

Abstract

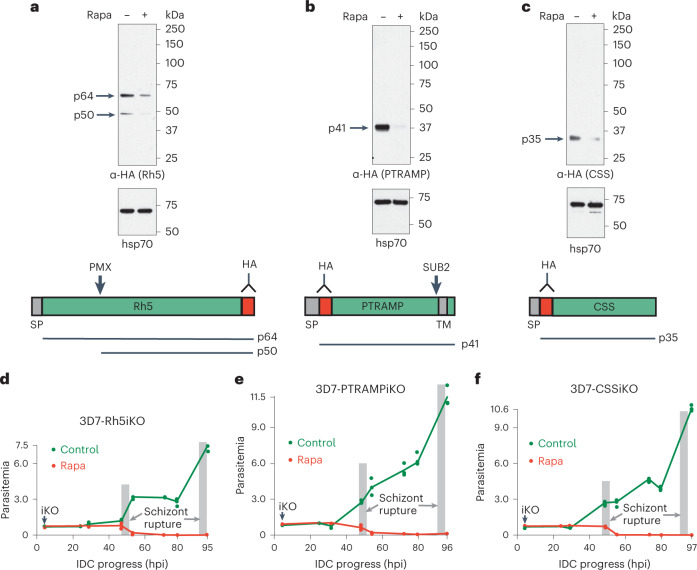
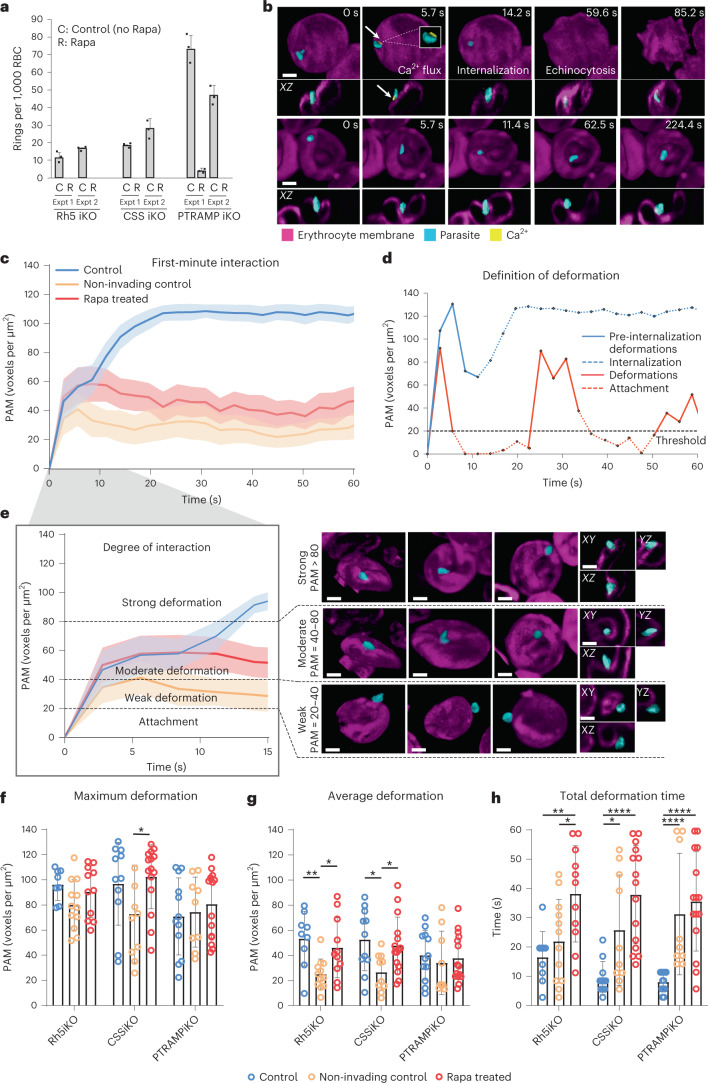
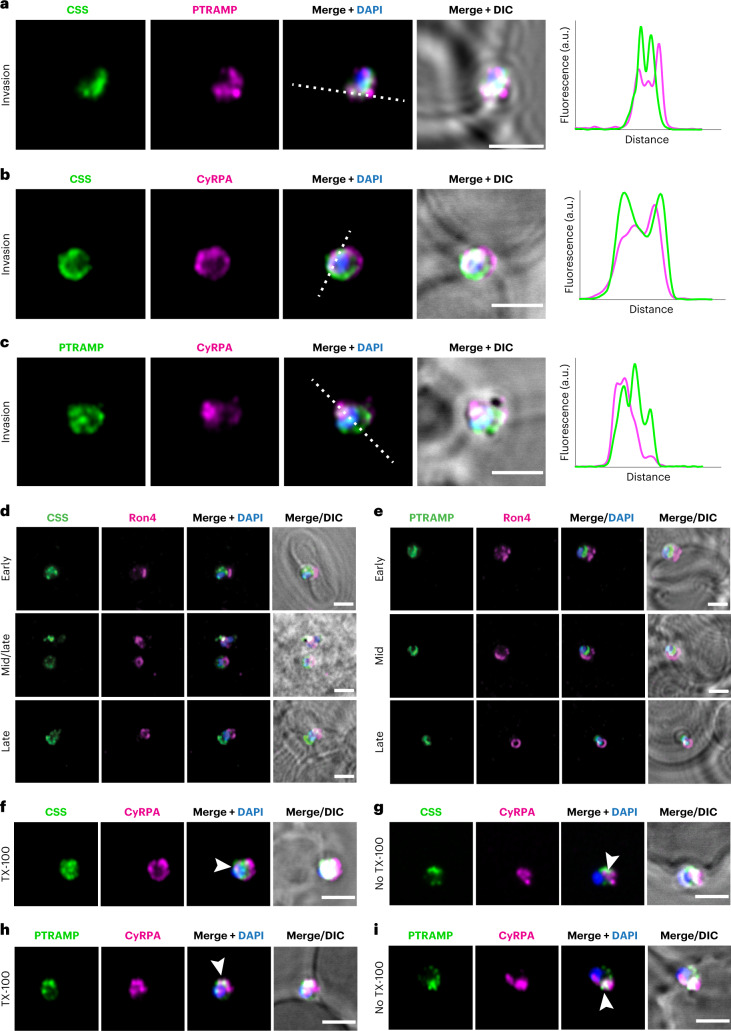
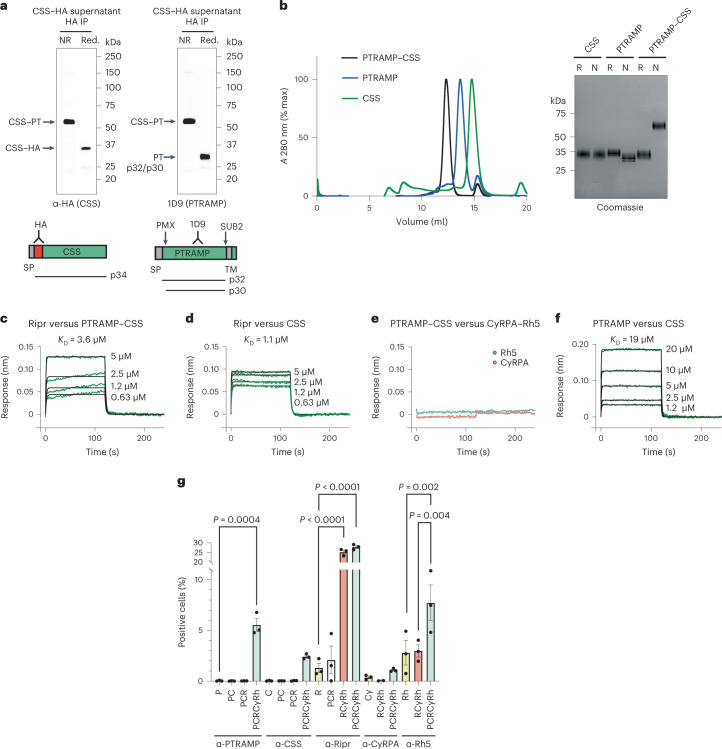
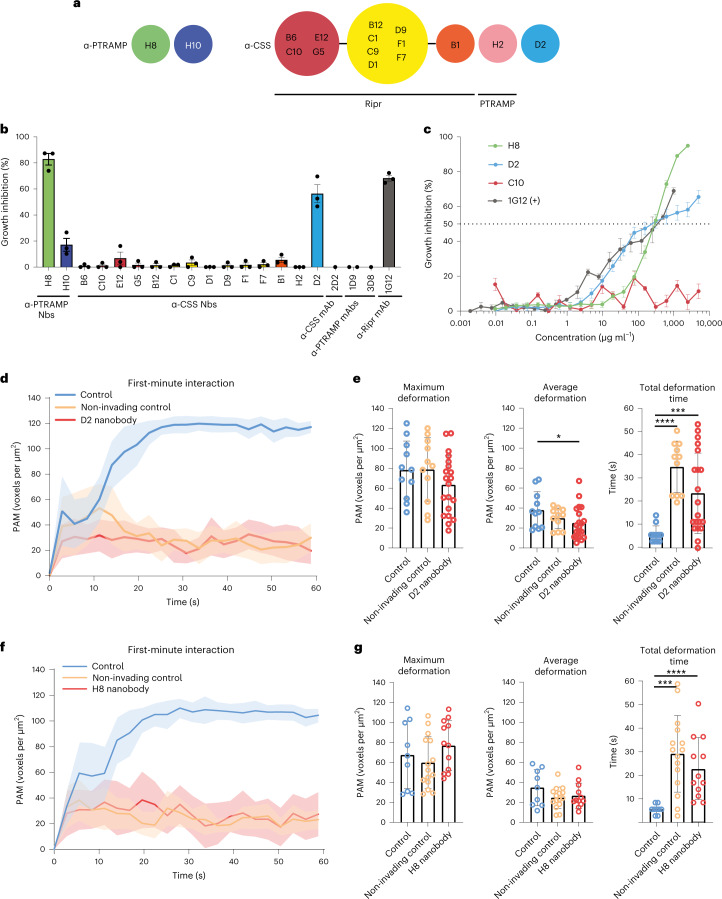
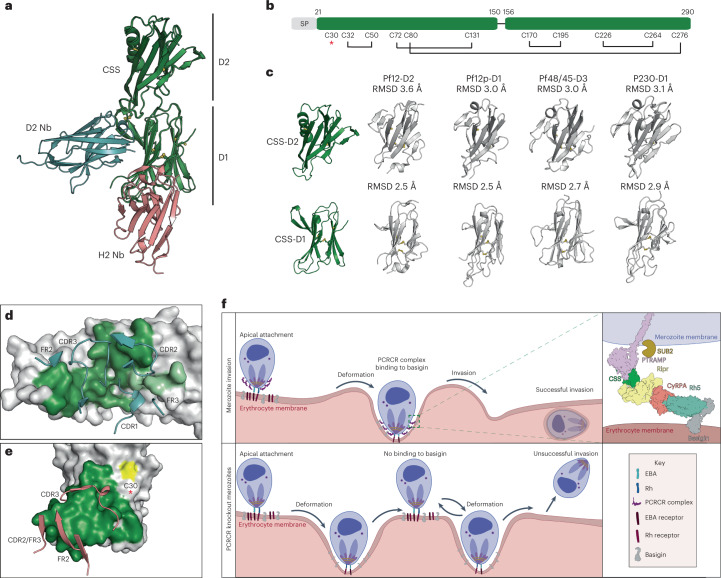
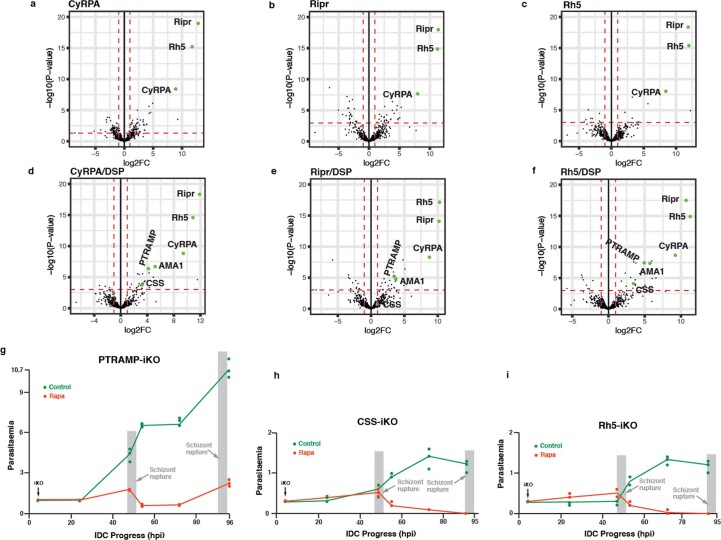
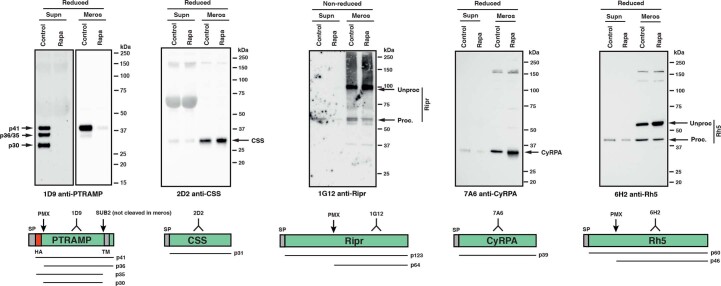
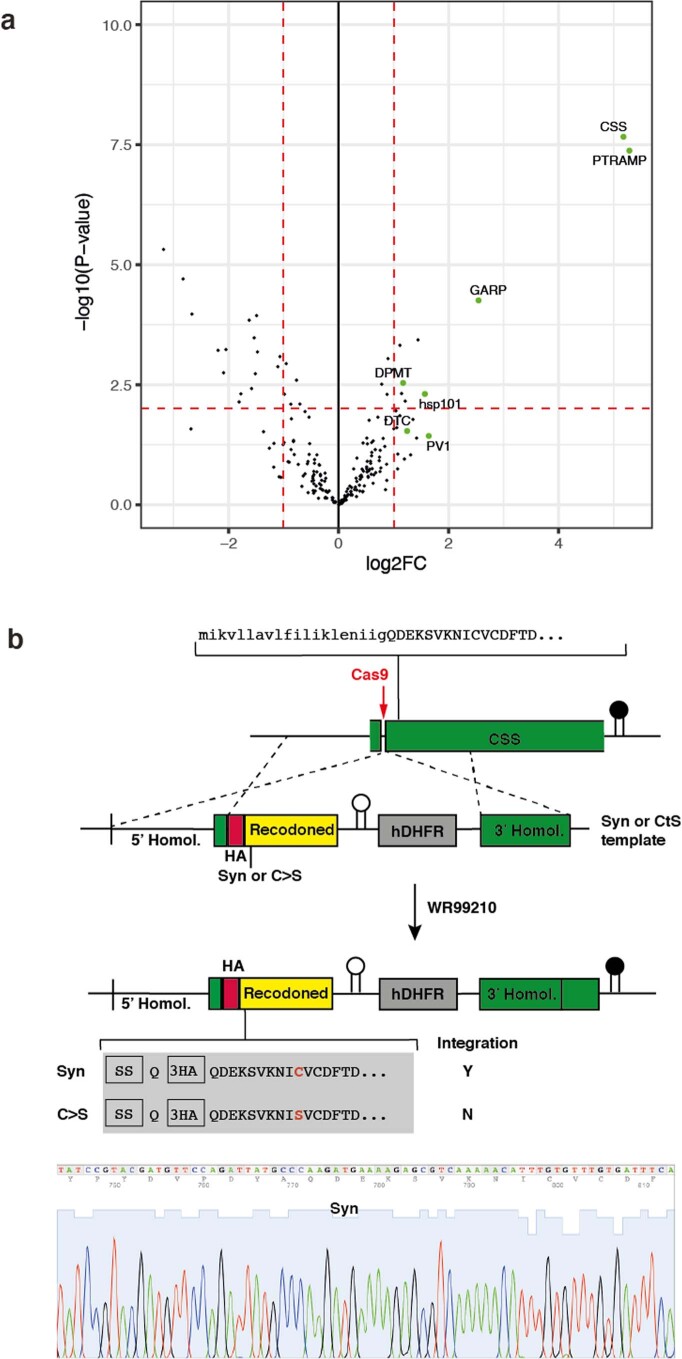
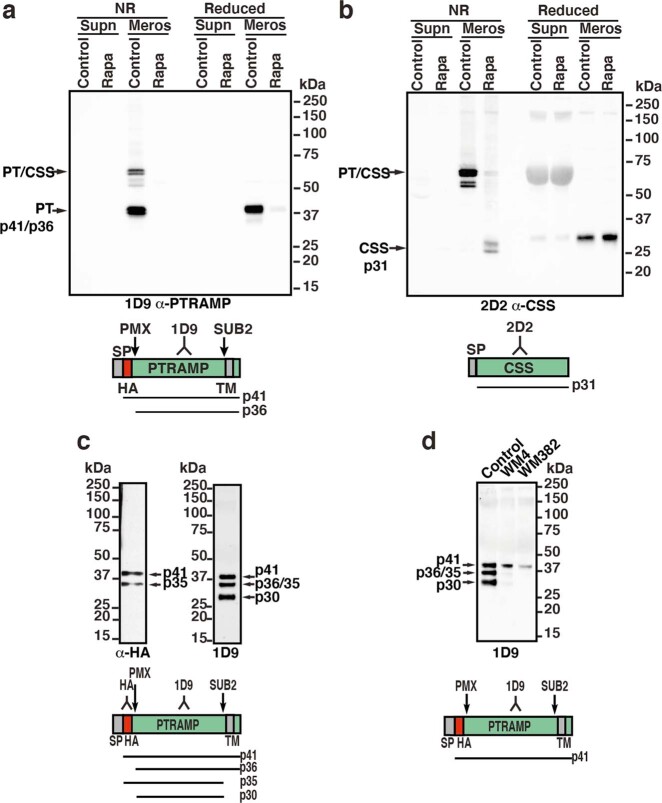
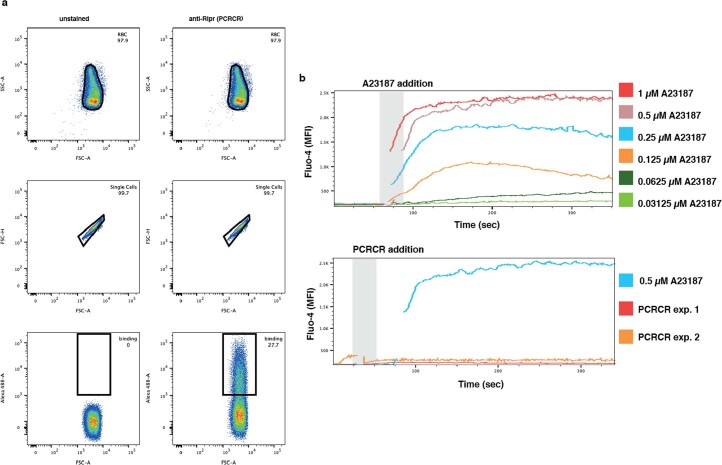
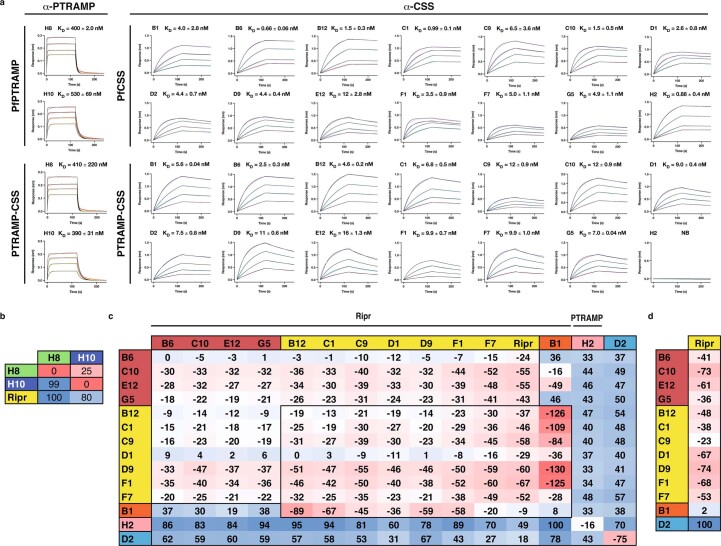
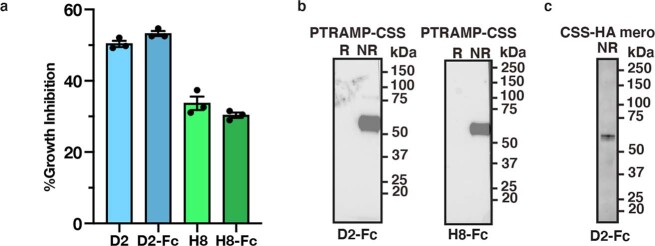
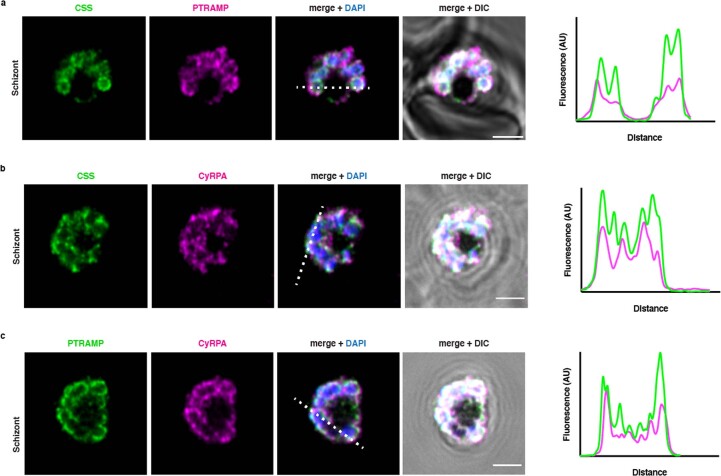
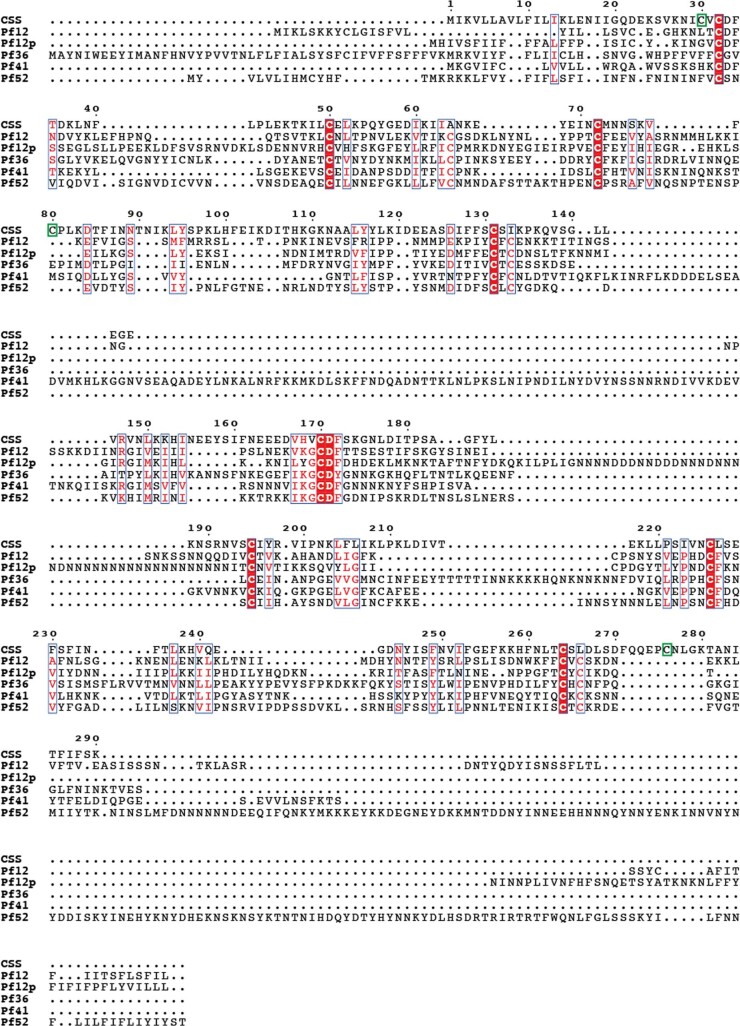
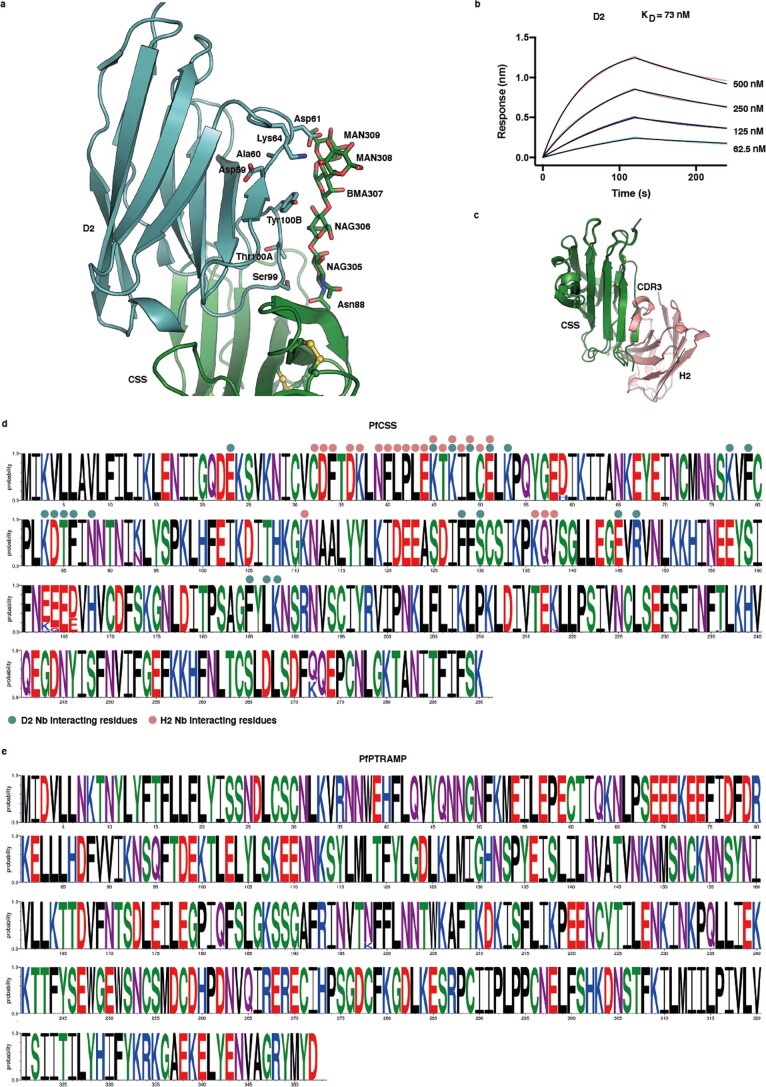
The most severe form of malaria is caused by Plasmodium falciparum. These parasites invade human erythrocytes, and an essential step in this process involves the ligand PfRh5, which forms a complex with cysteine-rich protective antigen (CyRPA) and PfRh5-interacting protein (PfRipr) (RCR complex) and binds basigin on the host cell. We identified a heteromeric disulfide-linked complex consisting of P. falciparum Plasmodium thrombospondin-related apical merozoite protein (PfPTRAMP) and P. falciparum cysteine-rich small secreted protein (PfCSS) and have shown that it binds RCR to form a pentameric complex, PCRCR. Using P. falciparum lines with conditional knockouts, invasion inhibitory nanobodies to both PfPTRAMP and PfCSS, and lattice light-sheet microscopy, we show that they are essential for merozoite invasion. The PCRCR complex functions to anchor the contact between merozoite and erythrocyte membranes brought together by strong parasite deformations. We solved the structure of nanobody-PfCSS complexes to identify an inhibitory epitope. Our results define the function of the PCRCR complex and identify invasion neutralizing epitopes providing a roadmap for structure-guided development of these proteins for a blood stage malaria vaccine.


Conflict of interest statement

The authors declare no competing interests.

Figures

Fig. 1
Fig. 1. PfPTRAMP, PfCSS and PfRh5 are essential for growth of P. falciparum.
ac, Inducible knockdown of PfRh5 (a), PfPTRAMP (b) and PfCSS (c) expression. Rapa minus and plus rapamycin. HA-tagged PfRh5, PfPTRAMP and PfCSS were detected using anti-HA antibodies. Molecular weight markers (kDa) are shown on the right. Below each panel is a diagram of the protein with the position of the HA tag (red) marked with an antibody symbol. The relevant PMX and SUB2 protease cleavage sites are shown for PfRh5. Signal peptide sequence (SP) at N-terminus and transmembrane sequence (TM) are grey. The predicted (p) size of each processed polypeptide is shown. df, Representative experiments showing P. falciparum parasitemia over time plus (red lines) and minus (green lines) rapamycin for inducible knockdown of PfRh5 (3D7–Rh5iKO) (d), PfPTRAMP (3D7–PTRAMPiKO) (e) and PfCSS (3D7–CSSiKO) (f). Intraerythrocytic developmental cycle (IDC). Hours post invasion (hpi). Also shown in Extended Data Fig. 1g–i is a second independent representative experiment. Source data
Fig. 2
Fig. 2. Conditional knockout of PfRh5, PfPTRAMP and PfCSS shows their function was essential for invasion of human erythrocytes by P. falciparum merozoites.
a, Quantitation of merozoite invasion of erythrocytes when expression of PfRh5, PfPTRAMP or PfCSS was knocked down using rapamycin. Shown are each P. falciparum parasite line in which either PfRh5 (3D7–PfRh5iKO), PfPTRAMP (3D7–PTRAMPiKO) or PfCSS (3D7–CSSiKO) is under inducible knockout control with rapamycin (R) compared with control with no rapamycin (C). Histogram represents two independent experiments (Expt 1 and Expt 2) of each parasite line with mean ± s.e.m. b, Representative snapshots showing parasites (cyan) interacting with erythrocytes (magenta) pre-loaded with Ca2+ indicator (yellow) displayed using Imaris in 3D Blend mode and XZ views. In the control condition (top; 3D7–PfRh5iKO), the parasite shows a Ca2+ flux with internalization and echinocytosis. In rapamycin-treated (Rapa) (bottom; 3D7–PfRh5iKO), the parasite caused deformations on the erythrocyte but no invasion or echinocytosis. Scale bars, 2 μm. c, PAM time plot showing the first-minute interaction by invading control (blue, n = 32), non-invading control (orange, n = 31) and Rapa-treated parasites (red, n = 41) with neighbouring erythrocytes after parasite egress, where t = 0 represents the timepoint immediately before interaction began. Solid lines represent mean values, and shaded regions represent ±95% confidence interval (CI). d, PAM time plot from two parasite–erythrocyte interactions showing the definition of deformation (solid red and blue lines), which exclude the internalization period and beyond (dashed blue line), as well as periods where PAM ≤ 20 voxels per μm2 (dashed red lines). e, PAM time plot from c labelled with thresholds for defining the degree of parasite–erythrocyte interaction and respective images for visualization. Images show three examples in 3D Blend mode view and one example in XY, YZ and XZ views each for weak, moderate and strong deformations, displayed with Imaris. Scale bars, 2 μm. fh, Bar graphs showing maximum deformation (*P = 0.0308) (f), average deformation (P values from left to right: **P = 0.0043, *P = 0.0268, *P = 0.0197, *P = 0.0137) (g) and total deformation time (P values from left to right: **P = 0.0051, *P = 0.0233, ****P < 0.0001, *P = 0.0155, ****P < 0.0001, ****P < 0.0001) (h) during the first-minute interaction by invading control (blue), non-invading control (orange) and Rapa-treated (red) parasites from 3D7–PfRh5iKO (n = 9 for control, n = 12 for non-invading control, n = 11 for Rapa-treated), 3D7–CSSiKO (n = 11 for control, n = 10 for non-invading control, n = 15 for Rapa-treated) and 3D7–PTRAMPiKO (n = 12 for control, n = 9 for non-invading control, n = 15 for Rapa-treated) parasite lines. Bar heights represent mean values, and error bars represent standard deviation (s.d.). Mann–Whitney two-tailed test. Source data
Fig. 3
Fig. 3. PfCSS and PfPTRAMP co-localize with each other and with CyRPA during invasion.
Super-resolution imaging of invading merozoites. a, PfCSS was detected using an HA antibody, and PfPTRAMP was detected using the 3D8 mouse monoclonal antibody. Both proteins overlap during merozoite invasion. b,c, HA-tagged PfCSS (b) and PfPTRAMP (c) were co-stained with CyRPA and overlapped during merozoite invasion. Scale bars, 2 µm. Intensity plots along the drawn dashed line are displayed on the right side. d,e, Invading merozoites were fixed and stained for PfCSS–HA (d) or HA–PfPTRAMP (e) together with RON4. RON4 was used as a marker of the tight junction and allowed to differentiate between early, mid, and late invasion events. fi, PfCSS–HA (f,g) or HA–PfPTRAMP (h,i) invading merozoites were fixed and either permeabilized (TX-100, f,h) or not (no TX-100, g,i) before staining for HA and CyRPA. Positive signal in the absence of permeabilization suggests that the labelled proteins are exposed at this stage, allowing for the access of antibodies. Arrows show signal overlap. 4′,6-diamidino-2-phenylindole (DAPI). Differential interference contrast (DIC). Scale bars, 2 µm.
Fig. 4
Fig. 4. PfPTRAMP and PfCSS form a functional heterodimer and a complex with PfRipr, CyRPA and PfRh5 to enhance PfRh5 binding to erythrocytes.
a, The P. falciparum line PfCSS–HA was used for immunoprecipitation (IP) from merozoite supernatants of PfCSS using anti-HA antibodies (left) and PfPTRAMP using monoclonal antibody 1D9 (right) under non-reduced (NR) and reduced (Red.) conditions. The positions of the PTRAMP–CSS heterodimer, PfCSS–HA and PfPTRAMP (p32 and p30) proteins detected are arrowed. Shown are cartoons of PfCSS and PfPTRAMP with the position of antibody epitopes, the processing by PMX and SUB2 and the polypeptides detected. b, Size exclusion chromatography profiles for PTRAMP–CSS (black), PfPTRAMP (blue) and PfCSS (green) from a Superdex 200 Increase 10/300 GL column. Absorbance (A). SDS–PAGE of the final purified PfPTRAMP, PfCSS and PTRAMP–CSS proteins in reducing (R) and non-reducing (N) conditions. The molecular weight markers are shown on the left in kDa. cf, Representative sensorgrams and 1:1 model best fit (black). c, PfRipr binding to PTRAMP–CSS (Ripr versus PTRAMP–CSS). d, PfRipr binding to PfCSS (Ripr versus CSS). e, PTRAMP–CSS does not bind to PfRh5 or CyRPA (PTRAMP–CSS versus Rh5 and CyRPA). f, PfPTRAMP binding to PfCSS (PTRAMP versus CSS). g, Fluorescence-Activated Cell Sorting (FACS) analysis of different combinations of PfPTRAMP (P), PfCSS (C), PfRipr (R), CyRPA (Cy) and PfRh5 (Rh) binding to erythrocytes. N = 3; experiments were performed at least 3 times with biologically independent samples and were reproducible. Error bars represent s.e.m. Statistical significance was determined by an ordinary one-way analysis of variance with Tukey’s multiple comparisons test. Exact P values are shown in the figure where applicable. Source data
Fig. 5
Fig. 5. α-PfPTRAMP and α-PfCSS nanobodies inhibit merozoite invasion of erythrocytes.
a, Epitope bins of α-PfPTRAMP and α-PfCSS nanobodies (Nbs). α-PfCSS nanobodies that compete with PfRipr and PfPTRAMP are indicated. See also Extended Data Fig. 6. b, Growth inhibition of parasites by α-PfPTRAMP and α-PfCSS nanobodies at 1 mg ml−1. N = 3; data are shown from three independent experiments, with data points representing the mean from one experiment, performed in triplicate. c, Growth inhibition dilution series for α-PfPTRAMP nanobody H8 and α-PfCSS nanobodies D2 and C10. α-PfRipr mAb 1G12 was used as a positive control. Per cent growth inhibition is the mean of three independent experiments, performed in triplicate. The s.e.m. is shown. d, PAM time plot showing the first-minute interaction by invading control (blue, n = 11), non-invading control (orange, n = 11) and D2 nanobody-treated parasites (5 mg ml−1) (red, n = 20) with neighbouring erythrocytes after parasite egress, where t = 0 represents the timepoint immediately before interaction began. Solid lines represent mean values, and shaded regions represent ±95% CI. e, Maximum deformation, average deformation and total deformation time during the first-minute interaction by invading control (blue, n = 11), non-invading control (orange, n = 11) and D2 nanobody-treated (red, n = 20) parasites. Bar heights represent mean values, and error bars represent s.d. Mann–Whitney two-tailed test; P values left to right: *P = 0.0487, ****P < 0.0001, ****P = 0.0007. f, PAM time plot showing the first-minute interaction by invading control (blue, n = 10), non-invading control (orange, n = 15) and H8 nanobody-treated parasites (red, n = 12) (1.25 mg ml−1) with neighbouring erythrocytes after parasite egress, where t = 0 represents the timepoint immediately before interaction began. Solid lines represent mean values, and shaded regions represent ±95% CI. g, Maximum deformation, average deformation and total deformation time during the first-minute interaction by invading control (blue, n = 9), non-invading control (orange, n = 15) and H8 nanobody-treated (red, n = 12) parasites. Bar heights represent mean values, and error bars represent s.d. Mann–Whitney two-tailed test P values left to right: ****P < 0.0001, ***P = 0.0004. Source data
Fig. 6
Fig. 6. Anti-PfCSS nanobody recognition of the 6-Cys protein PfCSS.
a, Crystal structures of D2 nanobody–PfCSS and H2 nanobody–PfCSS superimposed. b, Schematic representation of PfCSS showing disulfide bond pairing. The unpaired Cys30 is indicated by a red asterisk. c, Comparison of PfCSS D1 and D2 domains with previously determined crystal structures Pf12, Pf12p, Pfs48/45 and Pfs230. d, D2 nanobody CDRs and FRs interacting with PfCSS D1 (dark green) and PfCSS D2 (light green) domains. e, H2 CDRs and FRs interacting with PfCSS D1 domain near Cys30 (yellow) and highlighted by a red asterisk. f, Model depicting the role of the PCRCR complex in merozoite invasion. Top left: P. falciparum apical binding to human erythrocytes that occurs after initial interaction and membrane wrapping. Bottom: merozoites with either pfptramp, pfcss, pfrh5 conditional knockouts, D2 or H8 nanobody. Top right: arrangement of the PCRCR complex binding to basigin on the erythrocyte membrane. SUB2 cleaves the ectodomain of PfPTRAMP.
Extended Data Fig. 1
Extended Data Fig. 1. PfPTRAMP and PfCSS interact with the PfRh5 complex and play an essential role for growth of P. falciparum.
a-f. Volcano plots illustrating the log2 fold change (log2FC) of immunoprecipitated HA-tagged CyRPA, PfRipr, or PfRh5 versus 3D7 before and after cross-linking with DSP versus significance of the change (-log10 P value). Differential protein expression analysis was performed using Limma which involves a moderated t-test. Benjamini and Hochberg’s method was used to adjust the p-values for multiple testing. Proteins were deemed differentially regulated in the log2 fold change in protein expression was 1-fold and exhibited an adjusted p-value ≤ 0.05. Proteins that were significantly immunoprecipitated with PfCyRPA-HA, PfRipr-HA and PfRh5-HA were analysed further and this included PfPTRAMP, PfCSS and Apical Membrane Protein 1 (AMA1). In this study we concentrated on PfPTRAMP and PfCSS. We are testing a potential link of AMA1 with the function of the PCRCR complex and this will be published elsewhere. An additional protein that was significantly found in all three immunoprecipitation experiments was heat shock protein 70 (PF3D7_0917900) but this was not considered further because it is a highly expressed chaperone protein and frequently immuno-precipitates in experiments such as these. Proteins that immunoprecipitated significantly in less than the three conditions were analysed with respect to subcellular location, timing of expression and potential role in merozoite invasion and because they did not match these criteria were not analysed further. a. Immuno-precipitated HA-tagged CyRPA. b. Immunoprecipitated HA-tagged PfRipr. c. Immuno-precipitated HA-tagged PfRh5. d. Immunoprecipitated HA-tagged CyRPA after cross-linking proteins with DSP. e. Immuno-precipitated HA-tagged PfRipr after cross-linking proteins with DSP. f. Immuno-precipitated HA-tagged PfRh5 after cross-linking proteins with DSP. g. Parasitemia of P. falciparum parasites with rapamycin inducible knockdown of PfPTRAMP. h. Parasitemia of P. falciparum parasites with rapamycin inducible knockdown of PfCSS. i. Parasitemia of P. falciparum parasites with rapamycin inducible knockdown of PfRh5. Source data
Extended Data Fig. 2
Extended Data Fig. 2. PfCSS, PfRipr, CyRPA and PfRh5 are expressed at normal levels when PfPTRAMP expression is removed by conditional gene knockout.
3D7-PTRAMPiKO was grown without (Control) and with rapamycin (Rapa) to mature schizonts and merozoites and supernatants prepared and analysed by SDS-PAGE and immunoblots that were probed with mAbs, 1D9 (PfPTRAMP), 2D2 (PfCSS), 1G12 (PfRipr), 7A6 (CyRPA) and 6H2 (PfRh5). At bottom of each panel is structure of the relevant protein with the domain recognised by each mAb with respect to PMX protease processing. The PfPTRAMP protein had a HA tag towards the N-terminus (red). The grey domains correspond to the Signal Sequence (SP). The molecular weight of the processed polypeptides and position within each protein is shown. Supernatants were prepared from purified schizonts placed back in culture and allowed to egress. Merozoites were centrifuged as pellets and prepared for SDS-PAGE analysis. Source data
Extended Data Fig. 3
Extended Data Fig. 3. PfPTRAMP and PfCSS form a complex and the PfCSS C30 residue appears to be essential.
a. Volcano plot illustrating the log2 protein ratios of immunoprecipitated PfCSS-HA proteins versus 3D7 control as analysed by mass spectrometry analysis. Differential protein expression analysis was performed using Limma which involves a moderated t-test. Benjamini and Hochberg’s method was used to adjust the p-values for multiple testing. Proteins were deemed differentially regulated in the log2 fold change in protein expression was 1-fold and exhibited an adjusted p-value ≤ 0.05. N = 3 biologically independent samples used. b. Scheme to construct P. falciparum lines that express PfCSS with the amino acid Cys30 mutated to Ser30 using CRISPR. Shown is the Cas9 cleavage site (red) near the protospacer adjacent motif and the resulting recombination event that replaces the endogenous pfcss gene with one mutated to encode Ser30. Both constructs included a HA-tag near the N-terminus of the PfCSS protein. In the grey box is the expected amino acid sequence expected after each insertion event. The HA-tagged pfcss gene that retained expression of C30 but inserted a HA-tag was successfully obtained and confirmed by sequencing (bottom panel). Parasites from multiple transfections with the construct that was identical to the former but would result in mutation of C30 to S30 was not successfully obtained. Therefore, we conclude that the C30 amino acid and the disulfide bond with PfPTRAMP was essential.
Extended Data Fig. 4
Extended Data Fig. 4. Conditional knockdown of PfPTRAMP and PfCSS confirms they form a heterodimer.
a and b. Merozoites (Meros) and supernatants (Supn) probed with 1D9 monoclonal antibody to detect PfPTRAMP (a) and 2D2 monoclonal antibody to detect PfCSS (b) from 3D7 iKO PfPTRAMP and 3D7 iKO PfCSS in the absence (control) or presence of rapamycin (Rapa) and proteins run on SDS/PAGE under non-reducing (NR) or reducing (Reduced) conditions and an immuno-blot performed. Position of detected PTRAMP-CSS heterodimer and PfPTRAMP and PfCSS monomers are arrowed. Cartoons below panels show structure of PfPTRAMP and PfCSS, the position of the monoclonal epitopes and the processing due to PMX and SUB2. SP, Signal sequence. TM, transmembrane. c. Aspartic protease PMX processes PfTRAMP at the N-terminus. P. falciparum parasites that express a HA-tagged PfPTRAMP were probed with anti-HA or a specific monoclonal (1D9) to detect processed polypeptides. Molecular weight markers are shown in kDa on the left and predicted (p) sizes of the processed proteins on the right. Cartoon of PfPTRAMP is shown below the panels. Antibody symbol shows the position of the HA-tag (red) and the domain to which the monoclonal antibody 1D9 binds. Signal sequence SP and transmembrane TM (grey). SUB2 protease and the identified PMX cleavage site are shown with an arrow. Below the protein are the predicted molecular weights of each processed polypeptide. d. WM4 and WM382 inhibitors block processing of PfPTRAMP. PMX inhibitor WM4 used at 40 nM, dual PMX and PMIX inhibitor WM382, 2.5 nM. On the left are the predicted (p) molecular weights of each detected polypeptide. The molecular weight markers shown on the right in kDa. PfPTRAMP detected using the monoclonal antibody 1D9. A cartoon of the PfPTRAMP protein is shown below. An antibody symbol shows the position of 1D9 binding to the domain. Signal sequence SP and transmembrane TM (grey). SUB2 protease and the identified PMX cleavage site are shown with an arrow. Below the protein is predicted molecular weight due to WM4 and WM382 inhibition of PMX processing. Western blot in all panels were performed at least twice.
Extended Data Fig. 5
Extended Data Fig. 5. Gating strategy for detection of erythrocyte binding Ca2+ uptake by flow cytometry.
a. Example scatter plots of the gating strategy for the erythrocyte binding assay showing unstained erythrocytes and erythrocytes incubated with PCRCR and detected with anti-PfRipr polyclonal sera and Alexa-488. The erythrocyte population was gated with SSC-A and FSC-A (top), then doublets were excluded using FSC-H and FSC-A (middle). For determining complex binding to erythrocytes, a cutoff of >103 was used (bottom). Gating was performed in an identical manner for all other antibody and antigen combinations. b. Kinetic plot of A23187 stimulation of erythrocytes pre-loaded with Fluo-4 AM. A titration of A23187 shows the responsiveness of the Fluo-4 AM labelled erythrocytes to the calcium ionophore (top). The mean fluorescence intensity for the Fluo-4 AM signal is plotted. Kinetic plot of PCRCR addition to erythrocytes in comparison to 0.5 μM A23187 stimulation (bottom).
Extended Data Fig. 6
Extended Data Fig. 6. Characterization of α-PfPTRAMP and α-PfCSS nanobodies.
a. Representative sensorgrams and 1:1 model best fit (black) for nanobody binding to PfTRAMP, PfCSS and PTRAMP-CSS, determined by biolayer interferometry. A 2-fold dilution series was used, starting at 2500 nM (brown), 1250 nM (red), 625 nM (orange), 313 nM (yellow) and 156 nM (wheat) for α-PfPTRAMP nanobodies and 250 nM (light pink), 125 nM (purple), 62.5 nM (cyan), 31.25 nM (teal) and 15.63 nM (pink) for α-PfCSS nanobodies. Epitope binning of α-PfPTRAMP nanobodies against b. PTRAMP-CSS and α-PfCSS nanobodies against c. PfCSS or d. PTRAMP-CSS. Primary nanobodies tested are listed in the left column, while secondary competing nanobodies are listed at the top. Data indicate the percent of competing nanobody or PfRipr binding compared to the maximum competing nanobody response. Boxes are coloured on a sliding scale, with red representing competition and blue representing non-competition. Nanobodies are coloured according to their epitope bins as in Fig. 5a.
Extended Data Fig. 7
Extended Data Fig. 7. Nanobody-Fc fusion proteins specific to PfPTRAMP and PfCSS inhibit parasite growth and recognize PTRAMP-CSS in merozoites.
a. Growth inhibition of parasites by D2 and H8 nanobodies and nanobody-Fc fusion proteins. Nanobodies and nanobody-Fc fusion proteins were tested at the EC50 concentration for growth inhibition of P. falciparum; D2 at 283 μg/ml and D2-Fc at 1.68 mg/mL or 21.2 μM; H8 at 288 μg/mL and H8-Fc at 1.72 mg/mL or 21.7 μM. Data is shown from one independent experiment, performed in triplicate. Error bars indicate standard error of the mean. b. Recombinant PTRAMP-CSS were probed with D2-Fc or H8-Fc fusion proteins under reduced (R) and non-reduced (NR) conditions. Western blot experiment has been performed at least twice. c. PfCSS-HA merozoites were probed with D2-Fc under non-reduced conditions to detect PTRAMP-CSS. Western blot experiment was performed once.
Extended Data Fig. 8
Extended Data Fig. 8. Co-localisation of PfCSS, PfPTRAMP and CyRPA in late schizonts of P. falciparum by immunofluorescence and super resolution microscopy.
a. Localisation of PfCSS-HA (green) detected with anti-HA antibodies compared to PfPTRAMP detected using mAb 3D8 (purple). b. Localisation of PfCSS-HA (green) detected with anti-HA antibodies compared to CyRPA detected using mAb 8B9 (purple). c. Localisation of PfPTRAMP (green) detected with anti-HA antibodies compared to CyRPA detected using mAb 8B9 (purple). Shown for all panels is merge+DAPI where nuclei have been stained and PfCSS, PfPTRAMP and DAPI channels have been merged. Fourth panels on the right includes merge of all as well as DIC (differential interference contrast). The far-right panels indicate co-localisation of each protein across the broken white line of the merge+DAPI panels. The scale bar in merge + DIC panels is 2 μM and is relevant for all panels.
Extended Data Fig. 9
Extended Data Fig. 9. Amino acid sequence comparisons of the 6-cys family members including PfCSS, Pf12, Pf12p, Pf36, Pf41 and Pf52.
Conserved cysteine residues are shown in dark red. The C30 cysteine in PfCSS that likely forms the disulfide bond with PfPTRAMP is marked in green. Less conserved residues are marked in light red.
Extended Data Fig. 10
Extended Data Fig. 10. Nanobody recognition of PfCSS and sequence conservation of PfCSS and PfPTRAMP.
a. D2 contacts an N-linked glycan on Asn88 of recombinant PfCSS. Interacting residues are shown as sticks. b. Representative sensorgram and 1:1 model best fit (black) for D2 binding to non-glycosylated PTRAMP-CSS determined by biolayer interferometry. A 2-fold dilution series was used, starting at 500 nM (light pink), 250 nM (lilac), 125 nM (purple), 62.5 nM (cyan). c. Superposition of the D1 domains from the D2-PfCSS and H2-PfCSS structures showing the β-strand is replaced by the H2 CDR3. d. Weblogo representation of PfCSS sequence diversity from 212 sequences from the PlasmoDB. D2 and H2 interacting residues are denoted with teal and pink circles, respectively. e. Weblogo representation of PfPTRAMP sequence diversity from 214 sequences from the PlasmoDB.

References

    1. Gilson PR, Crabb BS. Morphology and kinetics of the three distinct phases of red blood cell invasion by Plasmodium falciparum merozoites. Int. J. Parasitol. 2009;39:91–96. doi: 10.1016/j.ijpara.2008.09.007. - DOI - PubMed
    1. Cowman AF, Tonkin CJ, Tham WH, Duraisingh MT. The molecular basis of erythrocyte invasion by malaria parasites. Cell Host Microbe. 2017;22:232–245. doi: 10.1016/j.chom.2017.07.003. - DOI - PubMed
    1. Baum J, et al. Reticulocyte-binding protein homologue 5—an essential adhesin involved in invasion of human erythrocytes by Plasmodium falciparum. Int. J. Parasitol. 2009;39:371–373. doi: 10.1016/j.ijpara.2008.10.006. - DOI - PubMed
    1. Frenal K, et al. Functional dissection of the apicomplexan glideosome molecular architecture. Cell Host Microbe. 2010;8:343–357. doi: 10.1016/j.chom.2010.09.002. - DOI - PubMed
    1. Yahata, K. et al. Gliding motility of Plasmodium merozoites. Proc. Natl Acad. Sci. USA10.1073/pnas.2114442118 (2021). - PMC - PubMed

Publication types