. 2022 Nov 17;13(1):6941.
doi: 10.1038/s41467-022-34327-0.

The endocannabinoid anandamide is an airway relaxant in health and disease

Affiliations

The endocannabinoid anandamide is an airway relaxant in health and disease

Annika Simon et al. Nat Commun. .

Abstract

Chronic obstructive airway diseases are a global medical burden that is expected to increase in the near future. However, the underlying mechanistic processes are poorly understood so far. Herein, we show that the endocannabinoid anandamide (AEA) induces prominent airway relaxation in vitro and in vivo. In contrast to 2-arachidonlyglycerol-induced airway relaxation, this is mediated by fatty acid amide hydrolase (FAAH)-dependent metabolites. In particular, we identify mouse and also human epithelial and airway smooth muscle cells as source of AEA-induced prostaglandin E2 production and cAMP as direct mediator of AEA-dependent airway relaxation. Mass spectrometry experiments demonstrate reduced levels of endocannabinoid-like compounds in lungs of ovalbumin-sensitized mice indicating a pathophysiological relevance of endocannabinoid signalling in obstructive airway disease. Importantly, AEA inhalation protects against airway hyper-reactivity after ovalbumin sensitization. Thus, this work highlights the AEA/FAAH axis as a critical regulator of airway tone that could provide therapeutic targets for airway relaxation.


Conflict of interest statement

The authors declare no competing interests.

Figures

Fig. 1
Fig. 1. Anandamide (AEA) induces airway relaxation via fatty acid amide hydrolase (FAAH) in mouse trachea ex vivo.
a Original trace of isometric force measurements in a myograph demonstrates strong tone decrease of tracheal ring from C57BL/6J mouse by a single dose of AEA (10 µM). b Original trace of isometric force measurements shows no effect by application of the solvent ethanol (EtOH). c Statistical analysis of airway tone in response to AEA indicates that AEA (n = 5) evokes relaxation independent from CB1 and CB2 receptors (Cnr1/Cnr2−/−, n = 9); URB597 (URB, 1 µM, n = 6), methanandamide (Met-AEA, 10 µM, n = 5); (EtOH, n = 7, FAAH−/−, n = 8). Measurements were performed in independent samples. One way ANOVA, Tukey’s post hoc test (AEA vs EtOH ***p = 4.8 × 10−12; AEA vs URB ***p = 1.1 × 10−11; AEA vs FAAH−/− ***p = 1.6 × 10−11; AEA vs Met-AEA ***p = 1.5 × 10−10). d Dose response curves of AEA from trachea of C57BL/6J mice (n = 6 independent samples) show that the AEA-dependent airway relaxation is dose-dependent. e Statistical analysis of isometric force measurements demonstrates that the extent of airway relaxation by AEA (10 µM) is different in tracheas with and without epithelium in C57BL/6J mice (+n = 5, −n = 6 independent samples), unpaired two-tailed Student’s t test **p = 0.0012. f Immunostaining reveals FAAH expression in epithelial as well as smooth muscle cells of C57BL/6J mouse trachea (red = FAAH, green = alpha smooth muscle actin, staining was performed twice), scale bar = 20 µm. ce) Data are presented as mean values ± SEM. Source data are provided as a Source Data file.
Fig. 2
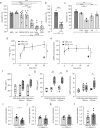
Fig. 2. AEA induces airway relaxation by cyclooxydase (COX)-dependent prostaglandin E2 (PGE2) and cAMP generation.
a Statistical analysis of airway tone in tracheal rings from C57BL/6J mice indicates that AEA (10 µM, n = 5)-dependent airway relaxation is mediated via arachidonic acid (AA) and COX-dependent metabolites; arachidonic acid (AA, 10 µM, n = 7), nordihydroguaiaretic acid (NDGA, 10 µM; n = 9), 17-octadecynoic acid (ODYA, 1 µM, n = 8), indomethacin (Indo, 10 µM, n = 8), and Indo+URB597 (n = 8). Note that data for URB (n = 6) are taken from Fig. 1c. All results were derived from independent samples. One-way ANOVA, Tukey’s post hoc test (AEA vs URB ***p = 1.6 × 10−6; AEA vs Indo+URB ***p = 4.4 × 10−7; AEA vs Indo ***p = 2.3 × 10−4; NDGA vs Indo ***p = 2.5 × 10−4; ODYA vs Indo **p = 0.0014). b Statistical analysis of airway tone in tracheal rings from C57BL/6J mice demonstrates strong inhibition of AA-dependent relaxation by Indo (AA, n = 7; Indo n = 6, independent samples). Unpaired two-tailed Student’s t test ***p = 1.4 × 10−6. c Statistical analysis of airway tone in tracheal rings from C57BL/6J mice reveals that AEA-induced airway relaxation is dependent on EP2 and EP4 receptors, AEA (n = 5), CAY10441 (CAY, 3 µM, n = 3), AH + L (n = 4), AH6809 (AH, 10 µM, n = 4), and L161,982 (L, 2 µM, n = 4). Results were derived from independent samples. One way ANOVA, Tukey’s post hoc test (AEA vs AH **p = 0.0047; AEA vs AH + L ***p = 3.2 × 10−5; CAY vs AH + L **p = 0.0014; AH + L vs L **p = 0.0035. d AEA evokes PGE2 production in the supernatant of trachea (C57BL/6J mice, n = 6 independent samples) in a time-dependent manner. Unpaired two-tailed t test with Welch correction **p = 0.0079. e AEA induces cAMP production in tracheal tissue from C57BL/6J mice (n = 4 independent samples) in a time-dependent manner. Unpaired two-tailed Student’s t test *p = 0.022. f AEA increases PGE2 production in the supernatant of human tracheal epithelial cells (hTEPC) after 60 min (n = 5 independent samples). Two way ANOVA, Bonferroni’s post hoc test *p = 0.037. Values are expressed as box and whiskers plot, with boxes indicating the Q1 and Q3 ranges, center line representing the median and whiskers as minimum and maximum values. g AEA increases PGE2 production in human airway smooth muscle cells (hASMC) after 30 and 60 min (n = 5 independent samples). Two way ANOVA, Bonferroni’s post hoc test (30 min: **p = 3.5 × 10−5, 60 min: **p = 7.1 × 10−5. Values are expressed as box and whiskers plot, with boxes indicating the Q1 and Q3 ranges, center line representing the median and whiskers as minimum and maximum values. h AEA increases cAMP production in hASMC after 60 min (n = 5 independent samples). Two way ANOVA, Bonferroni’s post hoc test *p = 0.012. Values are expressed as box and whiskers plot, with boxes indicating the Q1 and Q3 ranges, center line representing the median and whiskers as minimum and maximum values. il Statistical analysis of airway relaxation by isoprenaline (ISO, 10 µM) (i, k) or AEA (10 µM) (j, l) after long-term treatment of tracheal rings from C57BL/6J mice with medium (left bar, n = 7 (i, j), n = 8 (k, l)), ISO (right bar, n = 8 (i, j)) or AEA (right bar, n = 7 (k, l)) reveals that prolonged ISO incubation reduces ISO-dependent but not AEA-dependent relaxation while AEA incubation has no effect. Unpaired two-tailed Student’s t test *p = 0.012 (I). ae, il Data are presented as mean values ± SEM. Source data are provided as a Source Data file.
Fig. 3
Fig. 3. FAAH activity can be detected in mouse lung.
a Analysis of FAAH expression in different generations of C57BL/6J mouse airways (trachea, 1st, 2nd, 3rd airway generation n = 3), lung (n = 4), heart (n = 4), and brain (n = 4) demonstrates high FAAH levels. Organs were derived from independent animals. b, c FAAH activity can be found in C57BL/6J mouse trachea, original graph (b), statistical analysis (c) (n = 3 independent animals), unpaired two-tailed Student’s t test ***p = 7.0 × 10−4. d, e FAAH activity can be also found in C57BL/6J mouse lung tissue, original graph (d), statistical analysis (e) (n = 3 independent animals), unpaired two-tailed Student’s t test **p = 0.0023). f, g Analysis demonstrates high FAAH activity in mouse brain (positive control, f) but not in mouse heart (negative control, g) (n = 3 independent animals), unpaired two-tailed Student’s t test ***p = 3.3 × 10−6 (f). h, i In human cells FAAH activity can be detected in hTEPC (h) but not in hASMC (i) (n = 5 independent samples), unpaired two-tailed Student’s t test **p = 0.0013 (h); URB597 (URB, 10 µM). All data are presented as mean values ± SEM, 7-amino-4-methylcoumarin (AMC). Source data are provided as a Source Data file.
Fig. 4
Fig. 4. AEA induces airway relaxation ex vivo and in vivo in healthy mice.
a, b Top: phase contrast microscopy pictures of a small intrapulmonary C57BL/6J mouse airway. 1–3) Pictures represent time points during perfusion in the graph (bottom), scale bar = 50 µm. Bottom: Original trace of changes in airway lumen area. AEA (10 µM) completely reverses the reduction of lumen area by serotonin (5-HT, 0.1 µM) (a) while the solvent EtOH has no effect (b). c Statistical analysis reveals strong airway relaxation by AEA in intrapulmonary airways of C57BL/6J mice (AEA n = 5, EtOH n = 6 independent samples) that is attenuated in FAAH−/− mice (n = 5, independent samples), one way ANOVA, Tukey´s post hoc test (AEA vs EtOH ***p = 3.2 × 10−7; AEA vs AEA + FAAH−/− ***p = 2.6 × 10−4). d Analysis of airway resistance at baseline and after the subsequent inhalation of 25 mg/ml 5-HT together with AEA (0.5 mg per mouse, n = 5 independent animals) or the solvent EtOH (n = 4 independent animals) in healthy C57BL/6J mice. AEA limits the increase of airway resistance by 5-HT. Repeated measures two way ANOVA, Bonferroni’s post hoc test *p = 0.014. e Analysis of right ventricular systolic pressure (RVSP) before (pre) and after (post) inhalation of AEA (0.5 mg per mouse) or 5-HT (50 mg/ml) as positive control in C57BL/6J mice (n = 5 independent animals); AEA inhalation has no effect on RVSP. Repeated measures two way ANOVA, Bonferroni’s post hoc test **p = 0.0026. f Analysis of heart rate (HR) of C57BL/6J mice (n = 5 independent animals) before (pre) and after (post) inhalation of AEA (0.5 mg per mouse) or 5-HT (50 mg/ml); AEA and 5-HT have no effect on HR. All data are presented as mean values ± SEM. Source data are provided as a Source Data file.
Fig. 5
Fig. 5. Endocannabinoids as well as expression levels of enzymes promoting AEA synthesis are reduced in lungs of OVA-sensitized mice.
ae Tissue levels of AEA (a), 2-Arachidonylglycerol (2-AG, b), AA (c), oleoylethanolamine (OEA, d), and palmitoylethanolamine (PEA, e) are reduced in OVA lungs of Balb/c mice (n = 10 independent animals). Unpaired two-tailed Student’s t test (AEA *p = 0.026; 2-AG **p = 0.0034; AA **p = 0.003; OEA **p = 0.005; PEA *p = 0.032). fi Expression of N-acyl-phosphatidyl-ethanolamine phospholipase D (NAPE-PLD, f), a/b-hydrolase domain-containing protein (ABDH4, g), glycerophosphodiesterase 1 (GDE1, h) but not protein tyrosine phosphatase nonreceptor type 22 (PTPN22, i) is diminished in OVA-sensitized Balb/c mice (n = 5 independent animals), unpaired two-tailed Student’s t test (NAPE *p = 0.010; ABDH4 *p = 0.013; GDE *p = 0.037). All data are presented as mean values ± SEM. Source data are provided as a Source Data file.
Fig. 6
Fig. 6. AEA induces airway relaxation ex and in vivo in OVA-sensitized mice.
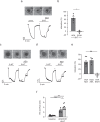
a Top: phase contrast microscopy pictures of a small intrapulmonary Balb/c mouse airway. 1–3) Pictures represent time points during perfusion in the graph (bottom), scale bar = 50 µm. Bottom: Original trace of changes in airway lumen area. AEA (10 µM) reverses the reduction of lumen area by 5-HT (0.1 µM) in the acute OVA model. b Statistical analysis reveals strong airway relaxation by AEA (n = 5 independent animals) but not EtOH (n = 3 independent animals) in intrapulmonary airways of OVA-sensitized mice with acute asthma, unpaired two-tailed Student’s t test *p = 0.012). c, d Top: phase contrast microscopy pictures of a small intrapulmonary Balb/c mouse airway. (1–3) Pictures represent time points during perfusion in the graph (bottom), scale bar = 50 µm. Bottom: original trace of changes in airway lumen area. AEA (10 µM) reverses the reduction of lumen area by 5-HT (0.1 µM) (c) in the chronic OVA model, a similar effect is found in controls without asthma (NaCl) (d). e Statistical analysis reveals strong airway relaxation by AEA (n = 6 independent animals) but not EtOH (n = 3 independent animals) in intrapulmonary airways of OVA-sensitized Balb/c mice with chronic asthma as well as in control mice (NaCl, n = 3 independent animals), one way ANOVA, Tukey’s post hoc test (OVA AEA vs OVA EtOH **p = 0.0025). f Analysis of airway resistance at baseline and after the subsequent inhalation of 25 mg/ml 5-HT together with AEA (0.5 mg per mouse, n = 7 independent animals) or the solvent EtOH (n = 8 independent animals) in Balb/c mice with acute OVA asthma. AEA limits the increase of airway resistance by 5-HT. Repeated measures two way ANOVA, Bonferroni’s post hoc test (baseline vs AEA ***p = 3.6 × 10−4; baseline vs EtOH ***p = 8.7 × 10−7; AEA vs EtOH **p = 0.0032). All data are presented as mean values ± SEM. Source data are provided as a Source Data file.

Similar articles

Cited by

References

    1. Skaper SD, Di Marzo V. Endocannabinoids in nervous system health and disease: the big picture in a nutshell. Philos. Trans. R. Soc. Lond. Ser. B Biol. Sci. 2012;367:3193–3200. doi: 10.1098/rstb.2012.0313. - DOI - PMC - PubMed
    1. Wahn H, Wolf J, Kram F, Frantz S, Wagner JA. The endocannabinoid arachidonyl ethanolamide (anandamide) increases pulmonary arterial pressure via cyclooxygenase-2 products in isolated rabbit lungs. Am. J. Physiol. Heart Circ. Physiol. 2005;289:H2491–H2496. doi: 10.1152/ajpheart.00718.2005. - DOI - PubMed
    1. Calignano A, et al. Bidirectional control of airway responsiveness by endogenous cannabinoids. Nature. 2000;408:96–101. doi: 10.1038/35040576. - DOI - PubMed
    1. Baranowska-Kuczko M, MacLean MR, Kozłowska H, Malinowska B. Endothelium-dependent mechanisms of the vasodilatory effect of the endocannabinoid, anandamide, in the rat pulmonary artery. Pharmacol. Res. 2012;66:251–259. doi: 10.1016/j.phrs.2012.05.004. - DOI - PubMed
    1. Su JY, Vo AC. 2-Arachidonylglyceryl ether and abnormal cannabidiol-induced vascular smooth muscle relaxation in rabbit pulmonary arteries via receptor-pertussis toxin sensitive G proteins-ERK1/2 signaling. Eur. J. Pharmacol. 2007;559:189–195. doi: 10.1016/j.ejphar.2006.12.016. - DOI - PubMed

Publication types

LinkOut - more resources