. 2022 Nov 17;12(1):19806.
doi: 10.1038/s41598-022-24392-2.

Protective potential of piroxicam on human peripheral blood mononuclear cells against the suppressive capacity of glioblastoma cell lines

Affiliations

Protective potential of piroxicam on human peripheral blood mononuclear cells against the suppressive capacity of glioblastoma cell lines

Jahangir Abdesheikhi et al. Sci Rep. .

Abstract

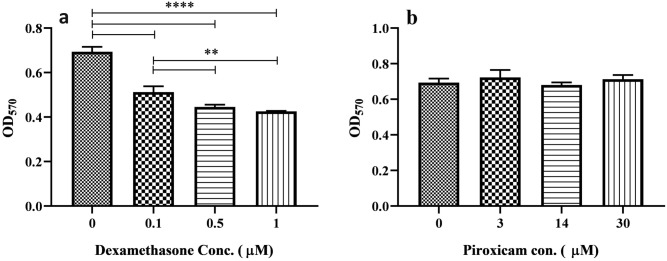
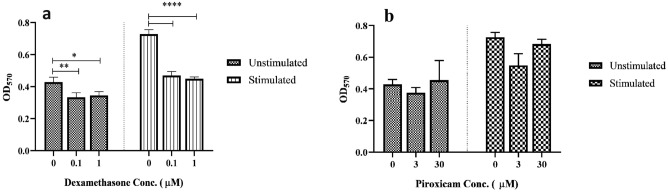
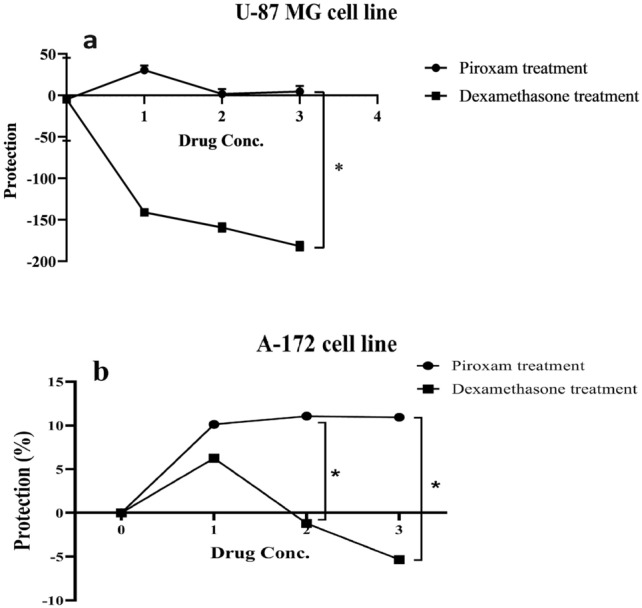
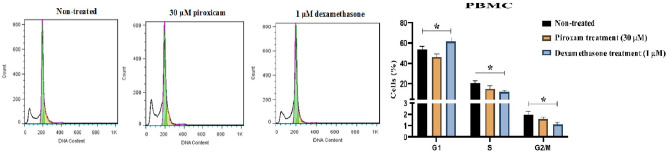
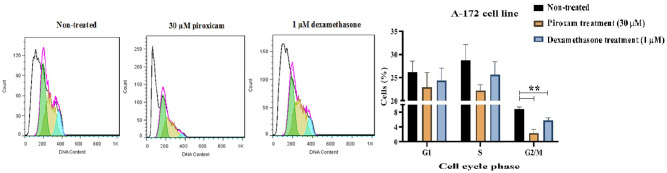
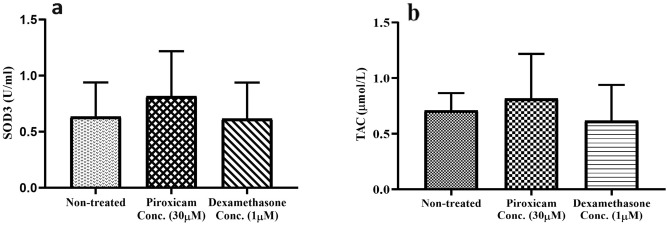
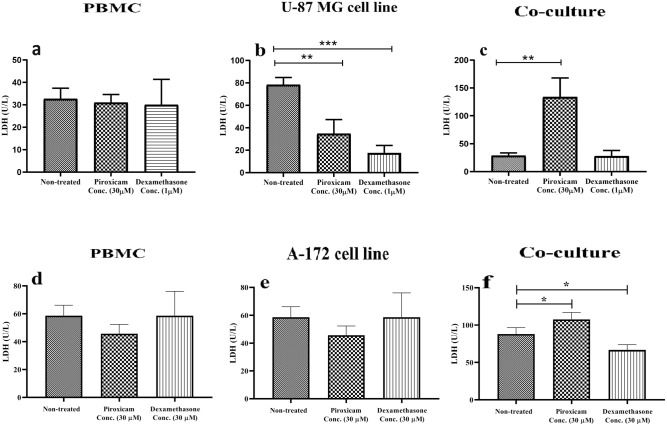
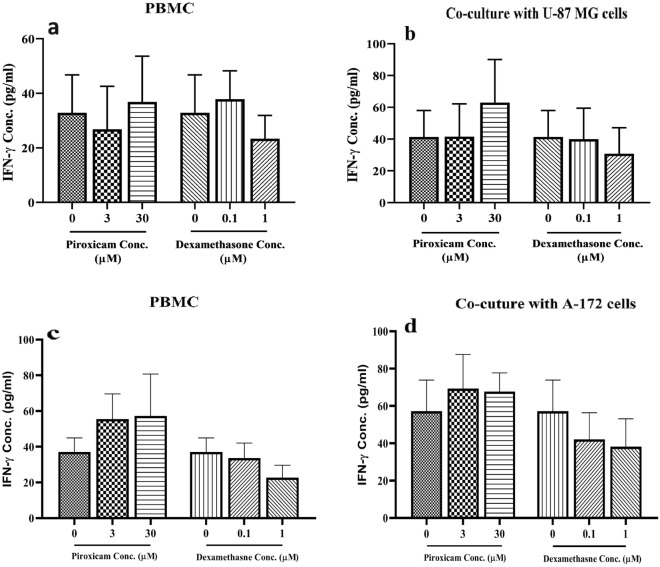
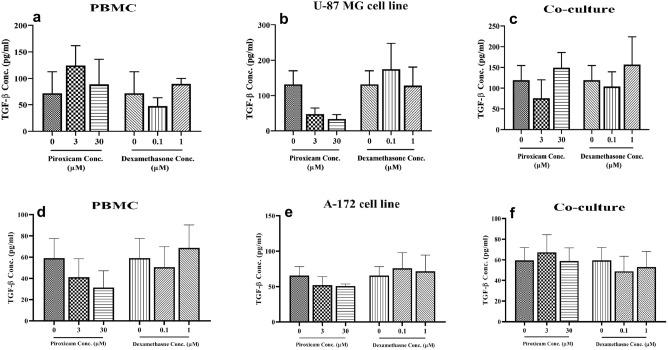
Dexamethasone, a common medication used in the treatment regimen of glioblastoma, has broad inhibitory effects on the immune responses. Here, in an in vitro study, we examined the effects of piroxicam, a potent substitute for dexamethasone, on peripheral blood mononuclear cells (PBMCs) co-cultured with two glioblastoma cell lines, U-87 MG and A-172 cells. MTT assay was used to determine the proliferation of PBMCs treated with piroxicam, or dexamethasone. In addition, to evaluate the effects of drugs on the cell cycle distribution, DNA content per cell was analyzed in PBMCs and A-172 cell lines using flow cytometry. Oxidative parameters, including superoxide dismutase-3 (SOD3) activity and total anti-antioxidant capacity, lactate dehydrogenase (LDH) activity, as well as IFN-γ and TGF-β levels were measured in PBMCs alone or in the presence of cell lines using ELISA. Unlike dexamethasone, piroxicam showed a protective effect on PBMCs against both glioblastoma cell lines. Furthermore, while dexamethasone reduced the proliferation of PBMCs, piroxicam had no adverse effect on the proliferation. Cell cycle analysis showed a reduction in the G2/M phase in piroxicam-treated A-172 cells. Additionally, dexamethasone limited the cell cycle progression by increasing the fraction of PBMCs in G0/G1. Interestingly, after co-culturing piroxicam-treated PBMCs with cell lines, a remarkable rise in the LDH activity was observed. Although not significant, piroxicam partially decreased TGF-β levels in both cell lines. Our findings suggested a protective effect of piroxicam, but not dexamethasone, on PBMCs against inhibitory mechanisms of two glioblastoma cell lines, U-87 and A-172 cells.


Conflict of interest statement

The authors declare no competing interests.

Figures

Figure 1
Figure 1
The effect of drugs on the proliferation of T cells in PBMCs. The effect of three different concentrations of dexamethasone (a) and piroxicam (b) was assessed on the proliferation of T cells in PBMCs (n = 3). The graphs show the mean ± SD. Significant changes are indicated with asterisk (*p < 0.05, **p < 0.01, ***p < 0.001, ****p < 0.0001).
Figure 2
Figure 2
The effect of drugs on the proliferation of T cells in PBMCs in stimulated and non-stimulated conditions. The effect of two different concentrations of dexamethasone (a) and piroxicam (b) on the proliferation of T cells in PBMCs was compared in stimulated and non-stimulated conditions (n = 3). The graphs show the mean ± SD. Significant changes are indicated with asterisk (*p < 0.05, **p < 0.01, ***p < 0.001, ****p < 0.0001).
Figure 3
Figure 3
The effect of drugs on the protection of T cells in PBMCs co-cultured with U-87 MG and A-172 cell lines. The effect of three different concentrations of dexamethasone and piroxicam was determined on the protection of T cells in PBMCs cocultured with U-87 MG (a) (n = 3), and A-172 (b) (n = 4) cell lines. The graphs show the mean ± SD. Significant changes are indicated with asterisk (*p < 0.05, **p < 0.01, ***p < 0.001, ****p < 0.0001).
Figure 4
Figure 4
The effect of drugs on the cell cycle phase of T cells in PBMCs. The effect of dexamethasone and piroxicam was measured on the cell cycle phase of T cells in non-treated PBMCs, PBMCs treated with 30 μM piroxicam or with 1 μM dexamethasone (n = 3). The graphs show the mean ± SD. Significant changes are indicated with asterisk (*p < 0.05, **p < 0.01, ***p < 0.001, ****p < 0.0001).
Figure 5
Figure 5
The effect of drugs on the cell cycle phase of A-172 cell line. The effect of dexamethasone and piroxicam was measured on the cell cycle phase of A-172 cells in non-treated, and treated with 30 μM piroxicam or with 1 μM dexamethasone (n = 3). The graphs show the mean ± SD. Significant changes are indicated with asterisk (*p < 0.05, **p < 0.01, ***p < 0.001, ****p < 0.0001).
Figure 6
Figure 6
The effect of drugs on the oxidative activity of T cells in PBMCs. The effect of dexamethasone and piroxicam was measured on the SOD3 activity (a) and TAC levels (b) of T cells in PBMCs (n = 3). The graphs show the mean ± SD. Significant changes are indicated with asterisk (*p < 0.05, **p < 0.01, ***p < 0.001, ****p < 0.0001).
Figure 7
Figure 7
The effect of drugs on the LDH activity of T cells in PBMCs alone or in co-culture condition. The effect of dexamethasone and piroxicam on the LDH activity was compared in PBMCs cells alone (a, d), U-87 MG cell line (b), A-172 cell line (e), and in the co-culture condition (c, f) (n = 3). The graphs show the mean ± SD. Significant changes are indicated with asterisk (*p < 0.05, **p < 0.01, ***p < 0.001, ****p < 0.0001).
Figure 8
Figure 8
The effect of drugs on the IFN-γ levels of T cells in PBMCs alone or in co-culture condition. The effect of dexamethasone and piroxicam was measured on the IFN-γ levels of T cells in PBMCs alone (a, c), and in co-culture with U-87 (b) (n = 5), and A-172 (d) (n = 4) cells. The graphs show the mean ± SD. Significant changes are indicated with asterisk (*p < 0.05, **p < 0.01, ***p < 0.001, ****p < 0.0001).
Figure 9
Figure 9
The effect of drugs on the TGF-β levels of T cells in PBMCs alone or in the co-culture condition. The effect of dexamethasone and piroxicam was measured on the TGF-β levels of T cells in PBMCs alone (a, d), U-87 MG cell line (b), A-172 cells (e), and in the co-culture with U-87 MG (c) and A-172 cells (f) (n = 4). The graphs show the mean ± SD. Significant changes are indicated with asterisk (*p < 0.05, **p < 0.01, ***p < 0.001, ****p < 0.0001).

Similar articles

Cited by

References

    1. Grech, N., Dalli, T., Mizzi, S., Meilak, L., Calleja, N., Zrinzo, A. Rising incidence of glioblastoma multiforme in a well-defined population. Cureus. 12(5) (2020). - PMC - PubMed
    1. Sasmita AO, Wong YP, Ling APK. Biomarkers and therapeutic advances in glioblastoma multiforme. Asia Pac. J. Clin. Oncol. 2018;14(1):40–51. - PubMed
    1. Stylli, S. S. Novel treatment strategies for glioblastoma. Multidisciplinary Digital Publishing Institute. p. 2883 (2020).
    1. Chen P-Y, Wu CY-J, Fang J-H, Chen H-C, Feng L-Y, Huang C-Y, et al. Functional change of effector tumor-infiltrating CCR5+ CD38+ HLA-DR+ CD8+ T cells in glioma microenvironment. Front. Immunol. 2019;10:2395. - PMC - PubMed
    1. Stupp R, Taillibert S, Kanner A, Read W, Steinberg DM, Lhermitte B, et al. Effect of tumor-treating fields plus maintenance temozolomide vs maintenance temozolomide alone on survival in patients with glioblastoma: A randomized clinical trial. JAMA. 2017;318(23):2306–2316. - PMC - PubMed

Publication types