. 2022 Dec;29(12):1188-1195.
doi: 10.1038/s41594-022-00859-8. Epub 2022 Nov 17.

Structure determination of inactive-state GPCRs with a universal nanobody

Affiliations

Structure determination of inactive-state GPCRs with a universal nanobody

Michael J Robertson et al. Nat Struct Mol Biol. 2022 Dec.

Abstract

Cryogenic electron microscopy (cryo-EM) has widened the field of structure-based drug discovery by allowing for routine determination of membrane protein structures previously intractable. Despite representing one of the largest classes of therapeutic targets, most inactive-state G protein-coupled receptors (GPCRs) have remained inaccessible for cryo-EM because their small size and membrane-embedded nature impedes projection alignment for high-resolution map reconstructions. Here we demonstrate that the same single-chain camelid antibody (nanobody) recognizing a grafted intracellular loop can be used to obtain cryo-EM structures of inactive-state GPCRs at resolutions comparable or better than those obtained by X-ray crystallography. Using this approach, we obtained structures of neurotensin 1 receptor bound to antagonist SR48692, μ-opioid receptor bound to alvimopan, apo somatostatin receptor 2 and histamine receptor 2 bound to famotidine. We expect this rapid, straightforward approach to facilitate the broad exploration of GPCR inactive states without the need for extensive engineering and crystallization.


Conflict of interest statement

Competing interests

The authors declare no competing interests.

Figures
Extended Data Fig. 1 |
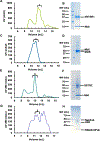
Extended Data Fig. 1 |. Biochemical characterization of receptor Nb6/Mb6 complexes.
(A) Size exclusion chromatography (SEC) profile of hNTSR1/Nb6 complex; bracket indicates fractions harvested for cryoEM. (B) SDS-PAGE gel of hNTSR1/Nb6 complex. (C) SEC profile of MOR/Mb6 complex; bracket indicates fractions harvested for cryoEM. (D) SDS-PAGE gel of MOR/Mb6 complex. (E) SEC profile of SSTR2/Nb6 complex; bracket indicates fractions harvested for cryoEM. (F) SDS-PAGE gel of SSTR2/Nb6 complex. (G) SEC profile of H2R/Nb6M/NabFab/Anti-Fab Nb (H) SDS-PAGE gel of H2R/Nb6M/NabFab/Anti-Fab Nb. All gels are from a single experiment, uncropped versions are provided as source data.
Extended Data Fig. 2 |
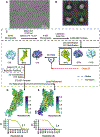
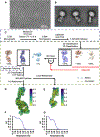
Extended Data Fig. 2 |. hNTSR1/Nb6 cryo-EM data collection and processing.
(A) Representative micrograph of hNTSR1/Nb6 complex, one micrograph of 5,818. (B) Example final 2D classes of hNTSR1/Nb6 complex. (C) Cryo-EM data processing workflow. (D) Local resolution of hNTSR1/Nb6 global refinement with FSC curve below. (E) Local resolution of hNTSR1/Nb6 local refinement with FSC curve below.
Extended Data Fig. 3 |
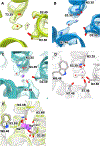
Extended Data Fig. 3 |. Comparison between hNTSR1/Nb6 cryoEM structure and rNTSR1H4/DARPin crystal structure.
(A) 2Fo-Fc crystallography map at 2.7 Å of rNTSR-H4bmx contoured at σ=1.0. (B) 2Fo-Fc crystallography map at 2.7 Å of rNTSR-H4bmx bound SR antagonist contoured at σ=1.0. (C) Structure of hNTSR1 (green) in the extracellular ligand binding pocket showing water molecules and corresponding cryoEM map features. (D) Overlay of hNTSR1 (green) and rNTSR1H4 (gray) highlighting the movement of TM1 (E) Overlay of hNTSR1 (green) and rNTSR1H4 (gray) with the cryoEM map for hNTSR1 (green) for ECL1 (F) Overlay of hNTSR1 (green) and rNTSR1H4 (gray) with the rNTSR1H4 crystal structure 2Fo-Fc map contoured at σ = 1.0. (G) Overlay of hNTSR1 (green), rNTSR1H4 (gray), and MOR PDB 4DKL (blue) showing the position of NPXXY motif Y7.53.
Extended Data Fig. 4 |
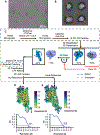
Extended Data Fig. 4 |. MOR/Mb6 cryo-EM data collection and processing.
(A) Representative micrograph of MOR/Mb6 complex, one micrograph of 14,635. (B) Example final 2D classes of MOR/Mb6 complex. (C) Cryo-EM data processing workflow. (D) Local resolution of MOR/Mb6 global refinement with FSC curve below. (E) Local resolution of MOR/Mb6 local refinement with FSC curve below.
Extended Data Fig. 5 |
Extended Data Fig. 5 |. Inactive MOR bound to avlimopan.
(A) overlay of snapshots from Mb6 molecular dynamics simulations aligned on the nanobody portion. (B) Comparison of Inactive MOR (dark blue) bound to alvimopan (magenta) and bound water in density modified map (grey) (C) Comparison of Inactive MOR (dark blue) bound to alvimopan (magenta) and carfentanyl (yellow) docked into the active state MOR receptor (light blue).
Extended Data Fig. 6 |
Extended Data Fig. 6 |. SSTR2/Nb6 cryo-EM data collection and processing.
(A) Representative micrograph of SSTR2/Nb6 complex, one micrograph of 6,846. (B) Example final 2D classes of SSTR2/Nb6 complex. (C) Cryo-EM data processing workflow. (D) Local resolution of SSTR2/Nb6 global refinement with FSC curve below.
Extended Data Fig. 7 |
Extended Data Fig. 7 |. Comparison of CryoEM Maps and Putative Ion Sites.
(A) Sodium ion site of hNTSR1 with cryoEM map. (B) Probable sodium ion site of MOR with cryoEM map. (C) Probable sodium ion site of SSTR2 with cryoEM map. (D) Sodium ion site of DOR (PDB 4N6H) with 2Fo-Fc map contoured at σ = 2.0 (E) Overlay of NTSR1 (green) cryoEM structures sodium ion binding site with the DOR sodium coordination site structure (gray, PDB 4N6H).
Extended Data Fig. 8 |
Extended Data Fig. 8 |. Inactive H2R/Nb6M/NabFab/Anti-Fab Nb cryoEM data collection and processing.
(A), Representative micrograph of H2R complex, one micrograph of 7,728. (B), Example final 2D classes of H2R complex. (C), CryoEM data processing workflow. (D), Local resolution of H2R global refinement (E), Local resolution of H2R local refinement (F), FSC curve of H2R global refinement (G) FSC curve of H2R local refinement.
Extended Data Fig. 9 |
Extended Data Fig. 9 |. Inactive H2R Structure and Comparison to H1R.
(A) Cryo-EM map of H2R with lipid density between TM1 and TM7 colored in orange. (B-D) Chemical structures of doxepin (B), loratadine (C), and cetirizine (D) with protonated amine highlighted and crystal structure of H1R (magenta) bound to doxepin (teal) (PDB 3RZE) loratadine (teal, docked pose) and cetirizine (teal, docked pose). (E-G) Chemical structures of famotidine (E), ranitidine (F), and cimetidine (G) with protonated amines highlighted in dashed (high pKa) and dotted (low pKa) boxes, together with cryoEM structure of H2R (lavender) bound to famotidine (goldenrod, this work), ranitidine (goldenrod, docked pose) and cimetidine (goldenrod, docked pose).
Extended Data Fig. 10 |
Extended Data Fig. 10 |. Map-Model Agreements.
(A) Map-model comparison for NTSR1. (B) Map-model comparison for MOR. (C) Map-Model comparison for SSTR2. (D) Map-Model comparison for H2R.
Fig. 1 |
Fig. 1 |. Construct design and evaluation for inactive-state GPCR structure determination.
a, RMSF in atomic positions averaged over triplicate molecular dynamics simulations for Nb6 bound to KOR. b, Local resolution plot of Nb6 from the SSTR2–Nb6 complex cryo-EM map. c, Overlay of the four KOR ICL3 constructs used to enable Nb6 binding for MOR (two point mutations), SSTR2 (5.68–6.31), hNTSR1 (5.59–6.38) and H2R (5.56–6.45). dg, Dose–response curves representing loss of BRET transfer (net BRET) between Receptor-rLuc and Nb6-mVenus for NTSR1κ and neurotensin (NT) (d), SSTR2κ and SST14 (e), MORκ and DAMGO (f) and H2Rκ and histamine (g). All error bars are s.e.m., experiments performed in technical duplicate and biological triplicate.
Fig. 2 |
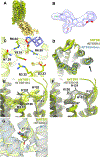
Fig. 2 |. Comparison of cryo-EM structure of hNTSR1 and crystal structure of rNTSR1–H4 and rNTSR1–H4bmx.
a, 2.4 Å global resolution cryo-EM map of hNTSR1. b, 2Fo-Fc crystallography map at 2.6 Å of rNTSR–H4 contoured at σ = 1.0. c, hNTSR1 TM5 with cryo-EM map. d, Local EM map around bound inverse agonist SR48692. e, Local 2Fo-Fc map around SR48692 contoured at σ = 1.25. f, Waters resolved in the core of the hNTSR1 receptor overlaid with the cryo-EM map. g, Overlay of the hNTSR cryo-EM structure (protein in green, SR48692 in purple) with the rNTSR–H4 crystal structure (protein in gray, SR48692 in pink) highlighting differences in ECL2. h, Overlay of the hNTSR cryo-EM structure (protein in green, SR48692 in purple) with the rNTSR–H4 crystal structure (protein in gray, SR48692 in pink) highlighting the residue shift and probable loss of bound water molecule caused by the F7.42 V thermostabilizing mutation. i, Overlay of the hNTSR cryo-EM structure (protein in green, SR48692 in purple) with the rNTSR–H4bmx crystal structure (protein in gray, SR48692 in pink).
Fig. 3 |
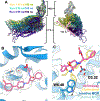
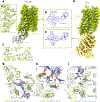
Fig. 3 |. Comparison of cryo-EM structure of alvimopan-bound MOR with crystal structures of MOR–β-FNA and KOR–JDTic.
a, Cryo-EM map of MOR at 2.8 Å global resolution. b, 2Fo-Fc crystallography map of MOR at 2.8 Å contoured at σ = 2.0. c, Cryo-EM density and model for inverse agonist alvimopan. d, Local 2Fo-Fc map around β-FNA contoured at σ = 1.5. e, Overlay of the alvimopan pose in the MOR cryo-EM structure (protein in blue, alvimopan in magenta) with the JDTic pose in the KOR crystal structure (protein in gray, JDTic in orange). f, Comparison of JDTic and alvimopan chemical structures highlighting similar phenol-piperidine scaffold.
Fig. 4 |
Fig. 4 |. Cryo-EM structure of the apo SSTR2 and comparison of sodium ion binding site.
a, Cryo-EM map of SSTR2 at 3.1 Å global resolution. b, Comparison of the model and cryo-EM maps of apo SSTR2 (teal) and SSTR2 in complex with either SST14 (magenta) or octreotide (purple). c, Comparison of the cryo-EM structure of SSTR2 (teal) with AlphaFold (tan) and RoseTTAfold (gray) predictions. d, Overlay of SSTR2 (teal), MOR (blue) and NTSR1 (green) cryo-EM structures around the canonical family A sodium ion binding site with the DOR sodium coordination site structure (gray, PDB 4N6H).
Fig. 5 |
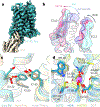
Fig. 5 |. Cryo-EM structure of the H2R–famotidine–Nb6M–NabFab–anti-Fab complex and comparison with H1R/doxepin.
a, 3.0 Å global resolution cryo-EM map of inactive-state H2R complex. b, Famotidine in the cryo-EM density and chemical schematic; protonatable amine groups are boxed in blue, with the moiety protonated near neutral pH on the right in large dashed lines, and the moiety likely protonated at low pH on the left in small dotted lines. c, Overlay of H1R (magenta) and doxepin (teal) crystal structure with the H2R (lavender) and famotidine (gold) cryo-EM structure.

References

    1. Robertson MJ, Meyerowitz JG & Skiniotis G Drug discovery in the era of cryo-electron microscopy. Trends Biochem. Sci. 47, 124–135 (2021). - PMC - PubMed
    1. Hauser AS, Attwood MM, Rask-Andersen M, Schiöth HB & Gloriam DE Trends in GPCR drug discovery: new agents, targets and indications. Nat. Rev. Drug Discov. 16, 829–842 (2017). - PMC - PubMed
    1. Koehl A et al. Structure of the μ-opioid receptor-Gi protein complex. Nature 558, 547–552 (2018). - PMC - PubMed
    1. Tsutsumi N et al. Structure of a human Frizzled5 by fiducial-assisted cryo-EM supports a heterodimeric mechanism of canonical Wnt signaling. eLife 9, e58464 (2020). - PMC - PubMed
    1. Che T et al. Nanobody-enabled monitoring of kappa opioid receptor states. Nat. Commun. 11, 1145 (2020). - PMC - PubMed

Publication types

Substances