

Measuring the geographic disparity of comorbidity in commercially insured individuals compared to the distribution of physicians in South Africa
- PMID: 36397001
- PMCID: PMC9673280
- DOI: 10.1186/s12875-022-01899-1
Measuring the geographic disparity of comorbidity in commercially insured individuals compared to the distribution of physicians in South Africa
Abstract
Background: Measuring and addressing the disparity between access to healthcare resources and underlying health needs of populations is a prominent focus in health policy development. More recently, the fair distribution of healthcare resources among population subgroups have become an important indication of health inequities. Single disease outcomes are commonly used for healthcare resource allocations; however, leveraging population-level comorbidity measures for health disparity research has been limited. This study compares the geographical distribution of comorbidity and associated healthcare utilization among commercially insured individuals in South Africa (SA) relative to the distribution of physicians.
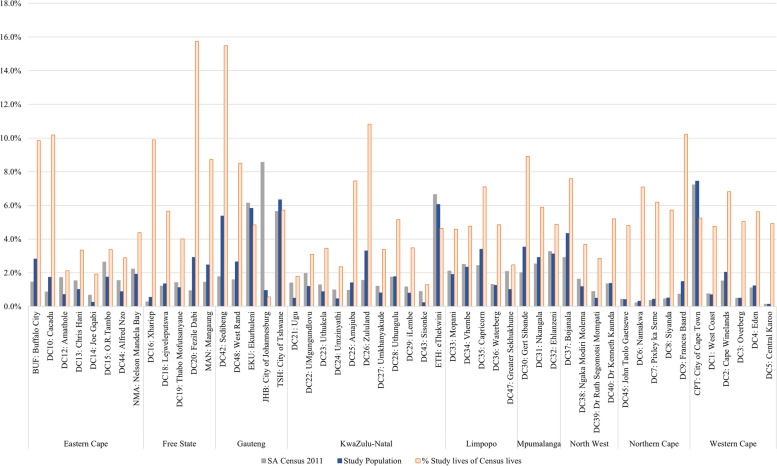
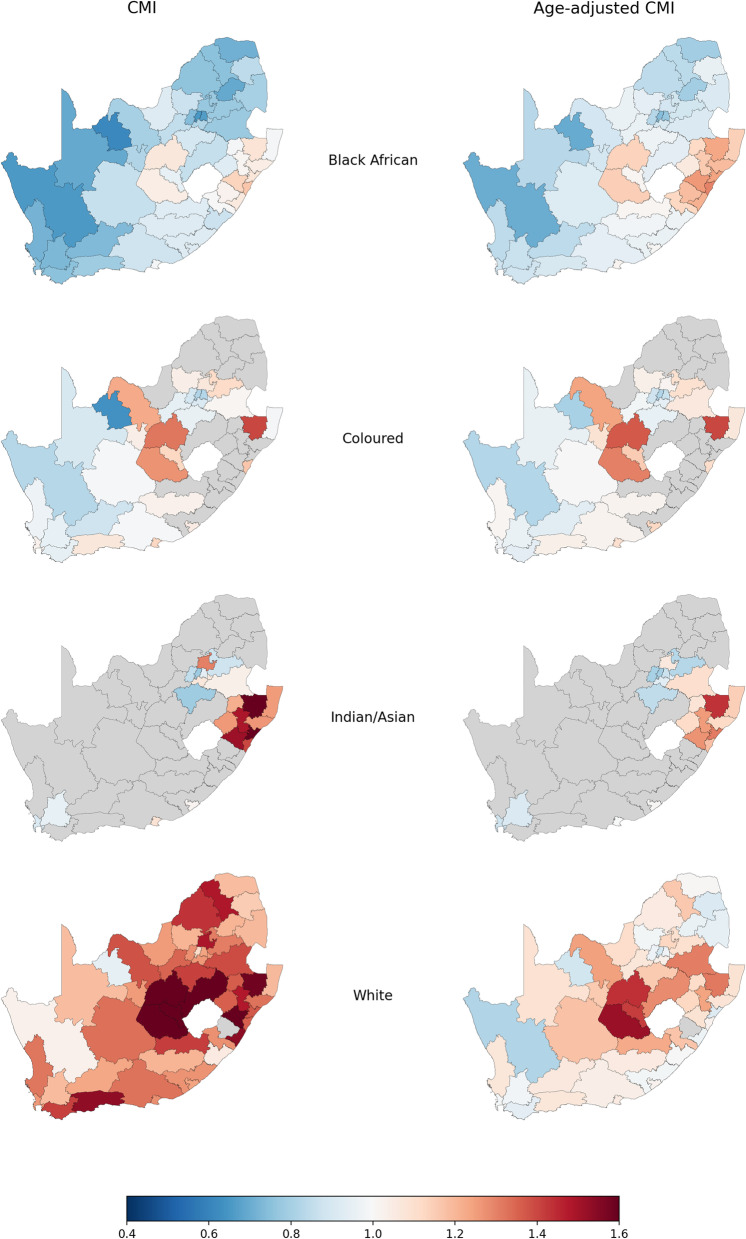
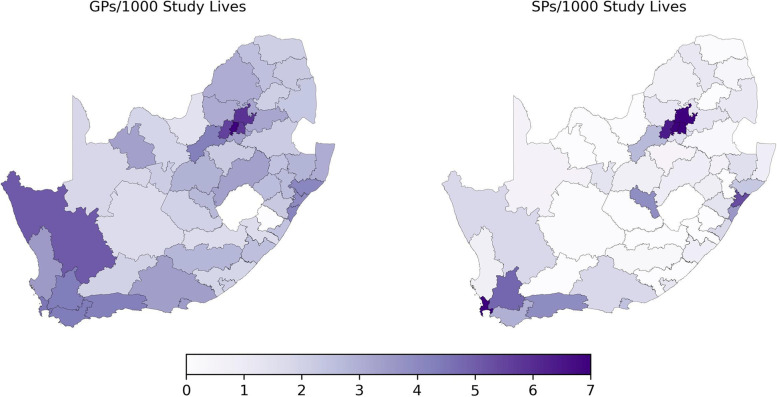
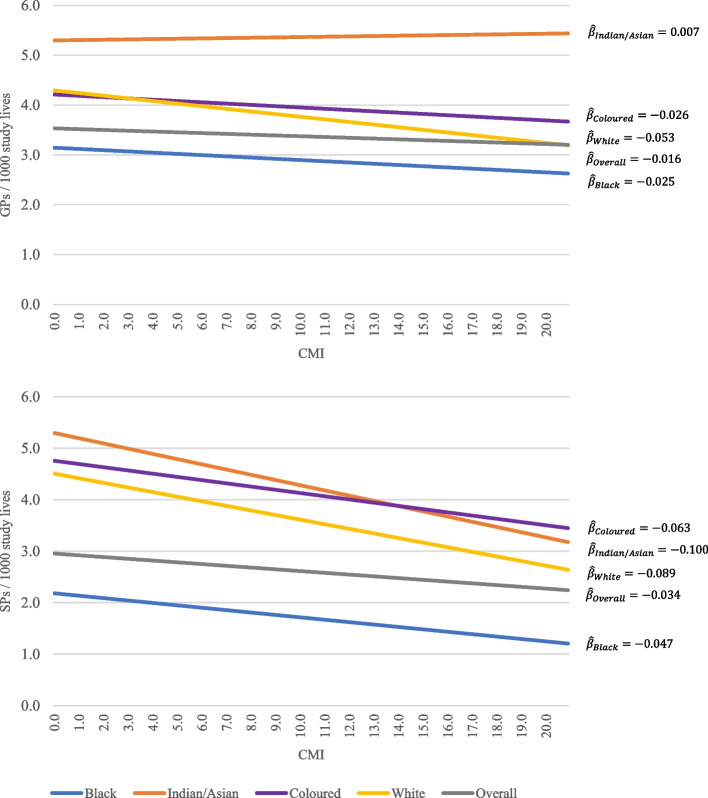
Methods: A retrospective, cross-sectional analysis was performed comparing the geographical distribution of comorbidity and physicians for 2.6 million commercially insured individuals over 2016-2017, stratified by geographical districts and population groups in SA. We applied the Johns Hopkins ACG® System across the claims data of a large health plan administrator to measure a comorbidity risk score for each individual. By aggregating individual scores, we determined the average healthcare resource need of individuals per district, known as the comorbidity index (CMI), to describe the disease burden per district. Linear regression models were constructed to test the relationship between CMI, age, gender, population group, and population density against physician density.
Results: Our results showed a tendency for physicians to practice in geographic areas with more insurance enrollees and not necessarily where disease burden may be highest. This was confirmed by a negative relationship between physician density and CMI for the overall population and for three of the four major population groups. Among the population groups, the Black African population had, on average, access to fewer physicians per capita than other population groups, before and after adjusting for confounding factors.
Conclusion: CMI is a novel measure for healthcare disparities research that considers both acute and chronic conditions contributing to current and future healthcare costs. Our study linked and compared the population-level geographical distribution of CMI to the distribution of physicians using routinely collected data. Our results could provide vital information towards the more equitable distribution of healthcare providers across population groups in SA, and to meet the healthcare needs of disadvantaged communities.
Keywords: Comorbidity index; Geographic analysis; Health equity; Healthcare disparity; Insurance claims; South Africa.
© 2022. The Author(s).
Conflict of interest statement
The authors declare no competing interests.
Figures
References
-
- Rasanathan K, Saint VA. Closing the gap: policy into practice on social determinants of health: Discussion paper for the World Conference on Social Determinants of Health. Geneva: World Health Organization; 2011.
-
- Hosseini H. Global inequities and healthcare disparities: can they be eliminated ethically? 10.1108/IJOES-11-2020-0175.
-
- Healthy People 2020 |. https://www.healthypeople.gov/2020/. Accessed 19 Feb 2021.
-
- World Health Organ | Fact file on health inequities. https://www.who.int/sdhconference/background/news/facts/en/. Accessed 19 Feb 2021.
MeSH terms
LinkOut - more resources
Full Text Sources