. 2022 Nov 17;41(1):326.
doi: 10.1186/s13046-022-02525-9.

Combined mitoxantrone and anti-TGFβ treatment with PD-1 blockade enhances antitumor immunity by remodelling the tumor immune landscape in neuroblastoma

Affiliations

Combined mitoxantrone and anti-TGFβ treatment with PD-1 blockade enhances antitumor immunity by remodelling the tumor immune landscape in neuroblastoma

Valeria Lucarini et al. J Exp Clin Cancer Res. .

Abstract

Background: Poor infiltration of functioning T cells renders tumors unresponsive to checkpoint-blocking immunotherapies. Here, we identified a combinatorial in situ immunomodulation strategy based on the administration of selected immunogenic drugs and immunotherapy to sensitize poorly T-cell-infiltrated neuroblastoma (NB) to the host antitumor immune response.

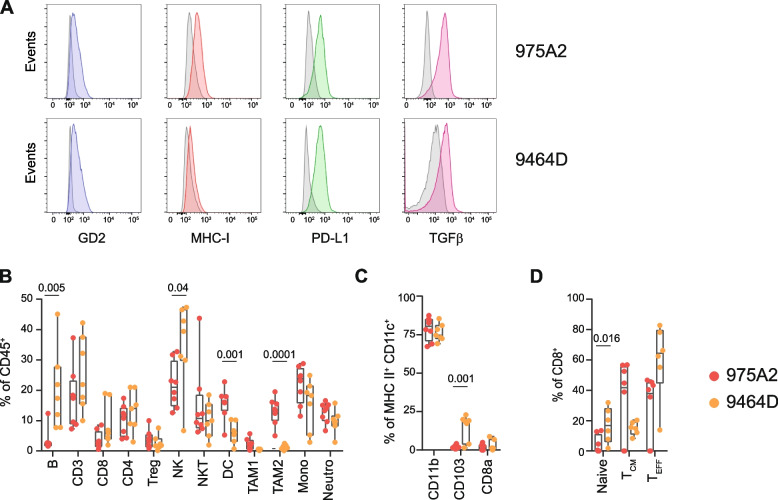
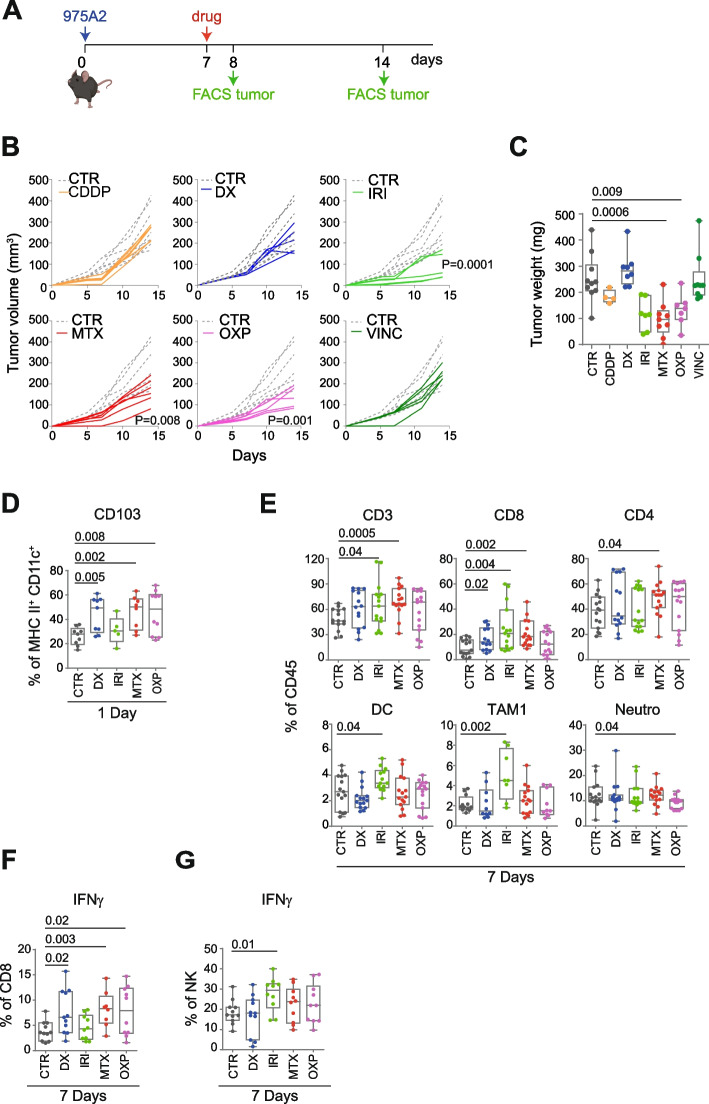
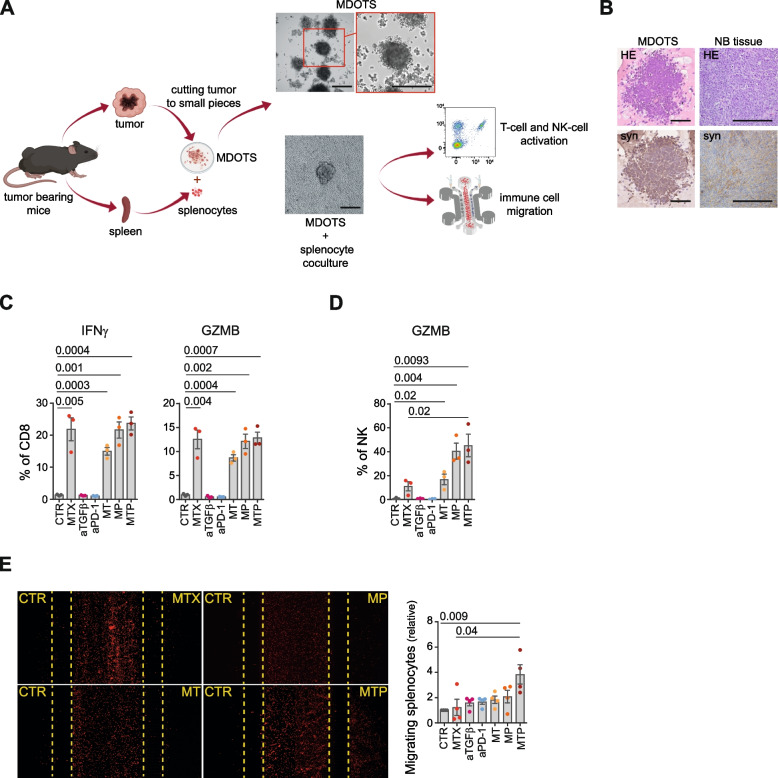
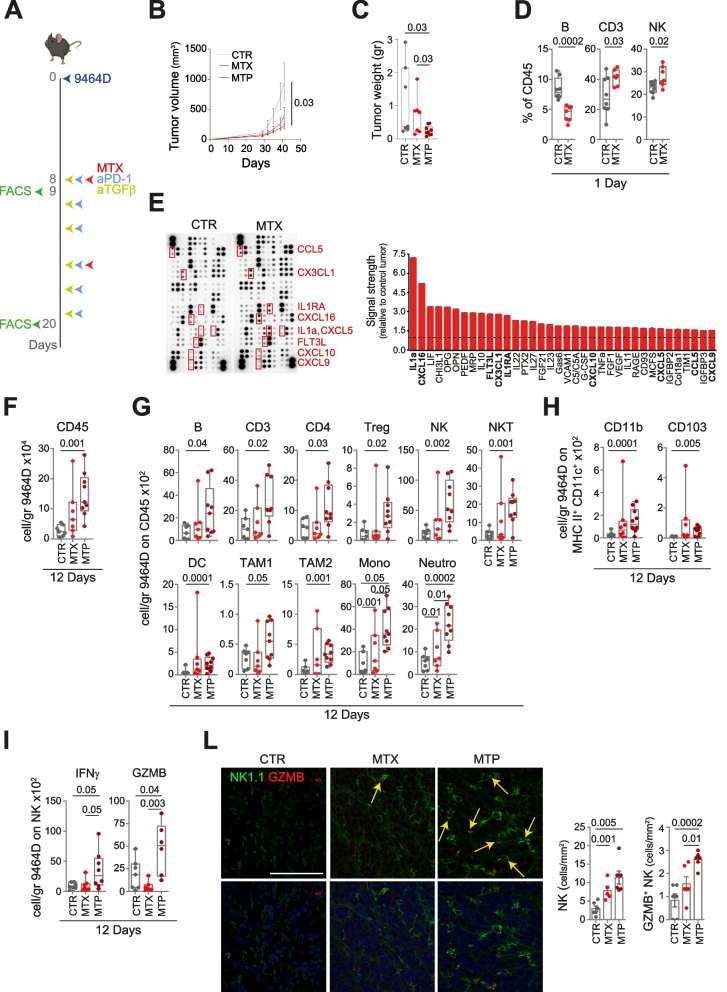
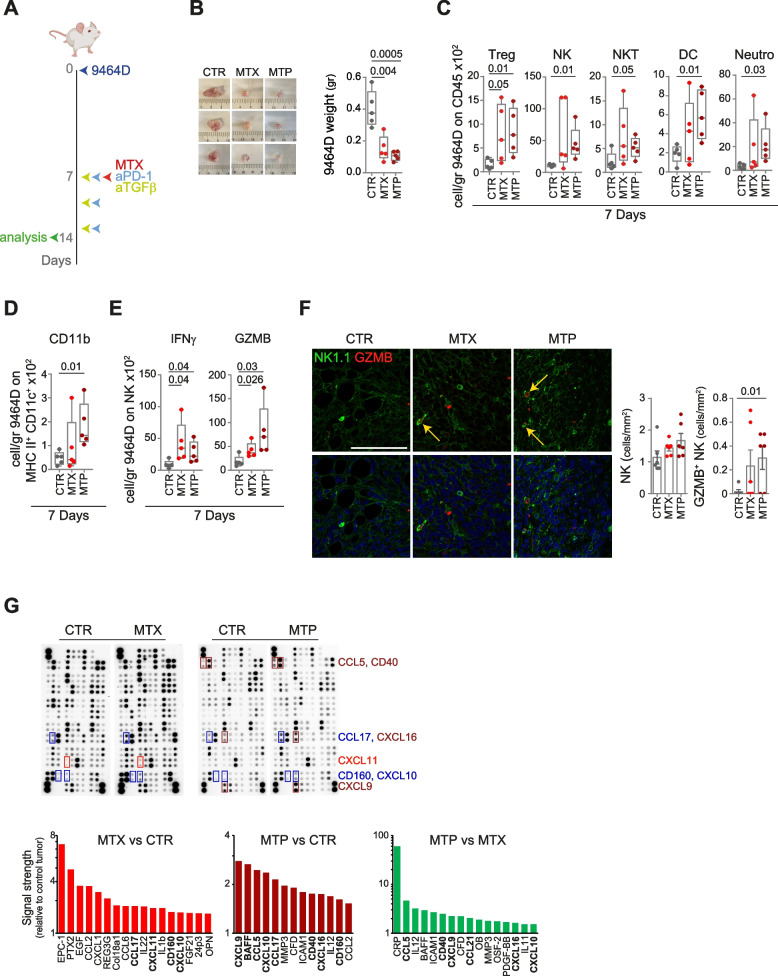
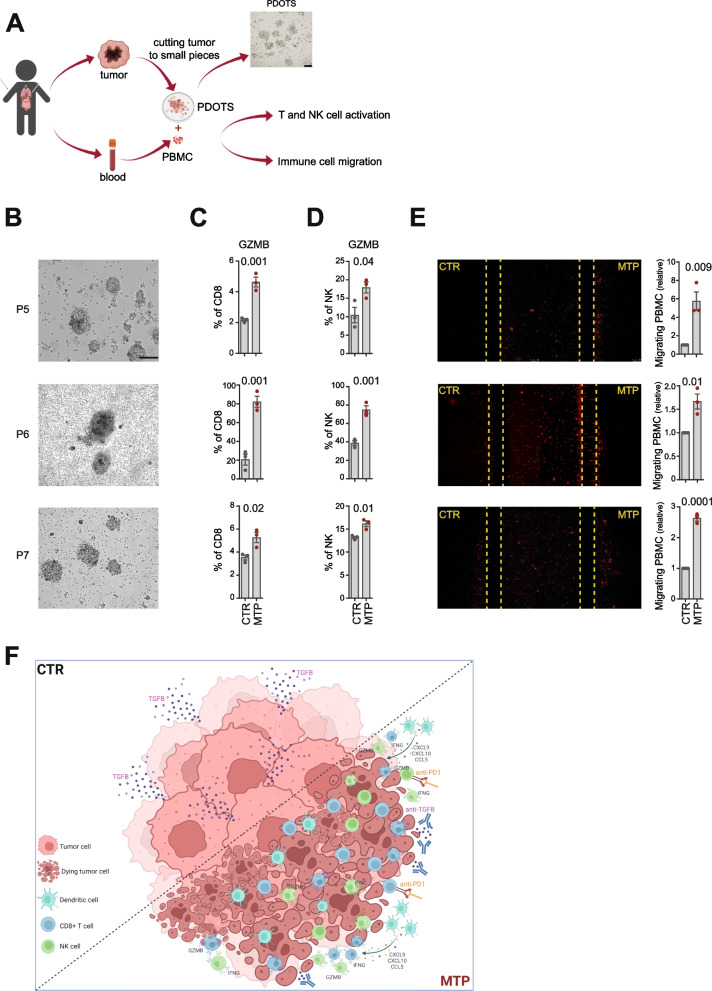
Methods: 975A2 and 9464D NB cell lines derived from spontaneous tumors of TH-MYCN transgenic mice were employed to study drug combinations able of enhancing the antitumor immune response using in vivo and ex vivo approaches. Migration of immune cells towards drug-treated murine-derived organotypic tumor spheroids (MDOTS) were assessed by microfluidic devices. Activation status of immune cells co-cultured with drug-treated MDOTS was evaluated by flow cytometry analysis. The effect of drug treatment on the immune content of subcutaneous or orthotopic tumors was comprehensively analyzed by flow-cytometry, immunohistochemistry and multiplex immunofluorescence. The chemokine array assay was used to detect soluble factors released into the tumor microenvironment. Patient-derived organotypic tumor spheroids (PDOTS) were generated from human NB specimens. Migration and activation status of autologous immune cells to drug-treated PDOTS were performed.

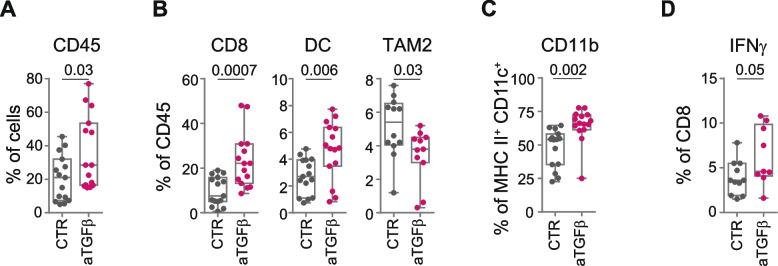
Results: We found that treatment with low-doses of mitoxantrone (MTX) recalled immune cells and promoted CD8+ T and NK cell activation in MDOTS when combined with TGFβ and PD-1 blockade. This combined immunotherapy strategy curbed NB growth resulting in the enrichment of a variety of both lymphoid and myeloid immune cells, especially intratumoral dendritic cells (DC) and IFNγ- and granzyme B-expressing CD8+ T cells and NK cells. A concomitant production of inflammatory chemokines involved in remodelling the tumor immune landscape was also detected. Interestingly, this treatment induced immune cell recruitment against PDOTS and activation of CD8+ T cells and NK cells.

Conclusions: Combined treatment with low-dose of MTX and anti-TGFβ treatment with PD-1 blockade improves antitumor immunity by remodelling the tumor immune landscape and overcoming the immunosuppressive microenvironment of aggressive NB.

Keywords: Drug Evaluation; Immunomodulation; Immunotherapy; Neuroblastoma; Tumor Microenvironment.


Conflict of interest statement

The authors declare that they have no competing interests.

Figures

Fig. 1
Fig. 1
Tumor microenvironment of transplantable NB 975A2 and 9464D mouse models. A Representative flow-cytometry histograms of GD2 (blu plot), MHC class I (red plot), PD-L1 (green plot) and TGFβ expression (pink plot) in 975A2 and 9464D tumor cells. Isotype-matched negative control antibody is shown as grey plot. B-D Flow-cytometry analysis of the immune infiltrate of 50–100 mm3-size 975A2 and 9464D tumors grown subcutaneously. Levels of significance for comparison between samples were determined by ANOVA. Statistically significant P values are shown
Fig. 2
Fig. 2
Low-doses chemotherapeutic drugs promote immune cell recruitment and activation of CD8+ T cells and NK cells in 975A2 tumors. A Schematic representation of the drug treatment and timing of tumor immune infiltrate analysis. B Tumor growth of 975A2 injected subcutaneously in C57BL/6 mice treated as indicated. Significance at day 7 after the start of treatment (Mann Whitney test). C Weight of explanted tumors at 7 days after the start of treatment. D, E Flow-cytometry analysis of immune content of 975A2 tumors treated 1 day (D) and 7 days (E). F, G Flow-cytometry analysis of IFNγ expression of tumor-infiltrating CD8+ T cells (F) and NK cells (G) in 7 day-treated 975A2 tumors. Levels of significance for comparison between samples were determined by ANOVA. CTR, vehicle control; CDDP, cisplatin; DX, doxorubicin; IRI, irinotecan; MTX, mitoxantrone; OXP, oxaliplatin; VINC, vincristine. Statistically significant P values are shown
Fig. 3
Fig. 3
TGFβ blockade recalls activated CD8+ T cells in 975A2 tumors. A-C Flow-cytometry analysis of immune content in 975A2 tumors 7 days after the start of treatment. D Flow-cytometry analysis of IFNγ expression of tumor-infiltrating CD8+ T cells in 7 day-treated 975A2 tumors. Levels of significance for comparison between samples were determined by two-tailed Student’s t test. CTR, vehicle control; aTGFβ, anti-TGFβ. Statistically significant P values are shown
Fig. 4
Fig. 4
Low-dose mitoxantrone recalls activated CD8+ T cells and NK cells in MDOTS when combined with TGFβ and PD-1 blockade. A Experimental scheme. Explanted tumors are reduced to small pieces, cultured to form MDOTS and then co-cultured with syngeneic splenocytes from tumor-bearing mice in ULA plates or microfluidic devices. Representative images of MDOTS cultured with or without splenocytes are shown. Original magnification, 20x. Scale bar, 30 μm. B Representative IHC staining of hematoxylin and eosin (HE) and synaptophysin (syn) in 975A2 MDOTS and the tumors from which they were derived. Brown, synaptophysin positive cells. Nuclei were counterstained with hematoxylin (blue). Original magnification, 20x. Scale bar, 30 μm. C, D Flow-cytometry analysis of IFNγ and granzyme B expression of CD8+ T cells (C) and NK cells (D) from splenocytes co-cultured 24 hours with drug-treated and untreated 975A2 MDOTS. E Representative images of the migration of red-labeled splenocytes in microfluidic devices to drug-treated and untreated 975A2 MDOTS after 24 hours of co-culture. The number of splenocytes migrating versus drug-treated and untreated 975A2 MDOTS was assessed by ImageJ software. Data are shown as fold change ± SD. Levels of significance for comparison between samples were determined by ANOVA (C-E). CTR, vehicle control; MTX, mitoxantrone; aTGFβ, anti-TGFβ; aPD-1, anti-PD-1; MT, mitoxantrone and anti-TGFβ; MP, mitoxantrone and anti-PD-1; MTP, mitoxantrone, anti-TGFβ and anti-PD-1; GZMB, granzyme B. Statistically significant P values are shown
Fig. 5
Fig. 5
Treatment of low-dose mitoxantrone in combination with TGFβ and PD-1 blockade delays the growth of subcutaneously transplanted 9464D tumors and reshapes the intratumoral infiltrate. A Schematic representation of the drug treatment and timing of tumor immune infiltrate analysis. B Tumor growth of 9464D injected subcutaneously in C57BL/6 mice and treated as indicated. Significance at day 41 (Mann Whitney test). C Weight of explanted tumors at day 41 after cell inoculation. D Flow-cytometry analysis of the immune compartment in 1 day-MTX-treated 9464D tumors. Levels of significance for comparison between samples were determined by two-tailed Student’s t test. E Chemokine expression in 1 day-MTX-treated 9464D lysates by protein array. Relative chemokine expression based on densitometric analysis is shown on the right. F-H Flow-cytometry analysis of the immune content in 9464D tumors treated for 12 days. I Flow-cytometry analysis of the activation status of tumor-infiltrating NK cells. L Multiple immunofluorescence staining of drug-treated 9464D tumor specimens for NK1.1 (green) and granzyme B (red), shown at original magnification × 40 (zoom), scale bar 30 μm. Images with nuclei (Hoechst) are shown in the bottom panel. Granzyme B-positive NK cells are indicated by yellow arrows. Quantitative analysis of the indicated immune cells from n = 6 biologically independent 9464D specimens is shown on the right. Levels of significance for comparison between samples in F-L were determined by ANOVA. CTR, vehicle control; MTX, mitoxantrone; MTP, mitoxantrone, anti-TGFβ and anti-PD-1; GZMB, granzyme B. Statistically significant, P values are shown
Fig. 6
Fig. 6
Treatment with low-dose mitoxantrone in combination with TGFβ and PD-1 blockade delays the growth of orthotopically transplanted tumors and reshapes the intratumoral infiltrate. A Schematic representation of the drug treatment and timing of tumor immune infiltrate analysis. B Representative images and weight of explanted tumors at day 7 after the start of treatment. C-E Flow-cytometry analysis of the immune content (C, D) and activation status of tumor-infiltrating NK cells (E) in 7 day-treated 9464D tumors. F Multiple immunofluorescence staining of drug-treated 9464D tumor specimens for NK1.1 (green) and granzyme B (red) shown at original magnification × 40 (zoom), scale bar 30 μm. Images with nuclei (Hoechst) are shown in the bottom panel. Granzyme B-positive NK cells are indicated by yellow arrows. Quantitative analysis of the indicated immune cells from n = 6 biologically independent 9464D specimens is shown on the right. Levels of significance for comparison between samples in C-F were determined by ANOVA. G Chemokine expression in 7 day-drug-treated 9464D lysates by protein array. Relative chemokine expression based on densitometric analysis is shown on the right. CTR, vehicle control; MTX, mitoxantrone; MTP, mitoxantrone, anti-TGFβ and anti-PD-1; GZMB, granzyme B. Statistically significant P values are shown
Fig. 7
Fig. 7
Low-dose mitoxantrone recalls activated CD8+ T cells and NK cells in PDOTS when combined with TGFβ and PD-1 blockade. A Experimental scheme. Explanted human tumors are reduced to small pieces, cultured to form PDOTS and then co-cultured with autologous PBMC in ULA plates or microfluidic devices. A representative image of PDOTS cultured in ULA plate is shown. Original magnification, 20x. Scale bar, 30 μm. B Representative images of PDOTS derived from P5, P6 and P7 NB patients, respectively. Original magnification, 20x. Scale bar, 30 μm. C, D Flow-cytometry analyses of granzyme B expression by CD8+ T cells (C) and NK cells (D) from autologous PBMC co-cultured 24 hours with drug-treated PDOTS. E Representative images of the migration of red-labeled autologous PBMCs in microfluidic devices to drug-treated and untreated PDOTS after 24 hours of co-culture. The number of PBMCs migrating versus drug-treated and untreated PDOTS was assessed by ImageJ software. Data are shown as fold change ± SD. Levels of significance for comparison between samples were determined by two-tailed Student’s t test. F A schematic representation depicting the transition from an immunosuppressive (CTR) to a tumor friendly microenvironment driven by MTP treatment. CTR, vehicle control; MTX, mitoxantrone; MTP, mitoxantrone, anti-TGFβ and anti-PD-1; GZMB, granzyme B. Statistically significant P values are shown

Similar articles

Cited by

References

    1. Melaiu O, Lucarini V, Giovannoni R, Fruci D, Gemignani F. News on immune checkpoint inhibitors as immunotherapy strategies in adult and pediatric solid tumors. Semin Cancer Biol. 2020;79:18–43. - PubMed
    1. Wolchok JD. Checkpoint blockade: the end of the beginning. Nat Rev Immunol. 2021;21(10):621. - PubMed
    1. Ribas A, Wolchok JD. Cancer immunotherapy using checkpoint blockade. Science. 2018;359(6382):1350–1355. - PMC - PubMed
    1. Tumeh PC, Harview CL, Yearley JH, Shintaku IP, Taylor EJ, Robert L, et al. PD-1 blockade induces responses by inhibiting adaptive immune resistance. Nature. 2014;515(7528):568–571. - PMC - PubMed
    1. Lucarini V, Melaiu O, Tempora P, D’Amico S, Locatelli F, Fruci D. Dendritic Cells: Behind the Scenes of T-Cell Infiltration into the Tumor Microenvironment. Cancers (Basel). 2021;13(3):433. - PMC - PubMed

Substances