

Computed tomography-based radiomics prediction of CTLA4 expression and prognosis in clear cell renal cell carcinoma
- PMID: 36397666
- PMCID: PMC10067074
- DOI: 10.1002/cam4.5449
Computed tomography-based radiomics prediction of CTLA4 expression and prognosis in clear cell renal cell carcinoma
Abstract
Objectives: To predict CTLA4 expression levels and prognosis of clear cell renal cell carcinoma (ccRCC) by constructing a computed tomography-based radiomics model and establishing a nomogram using clinicopathologic factors.
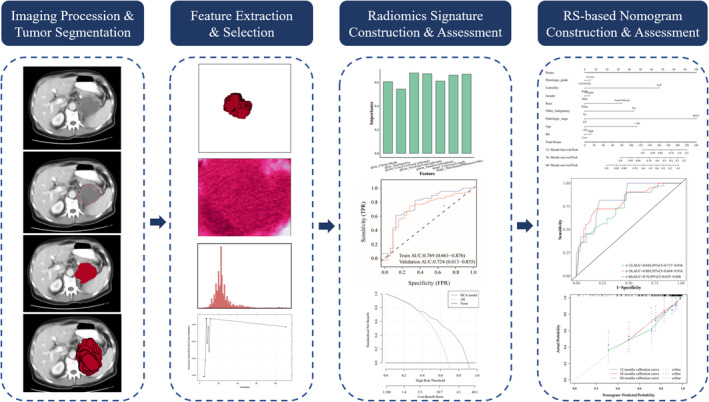
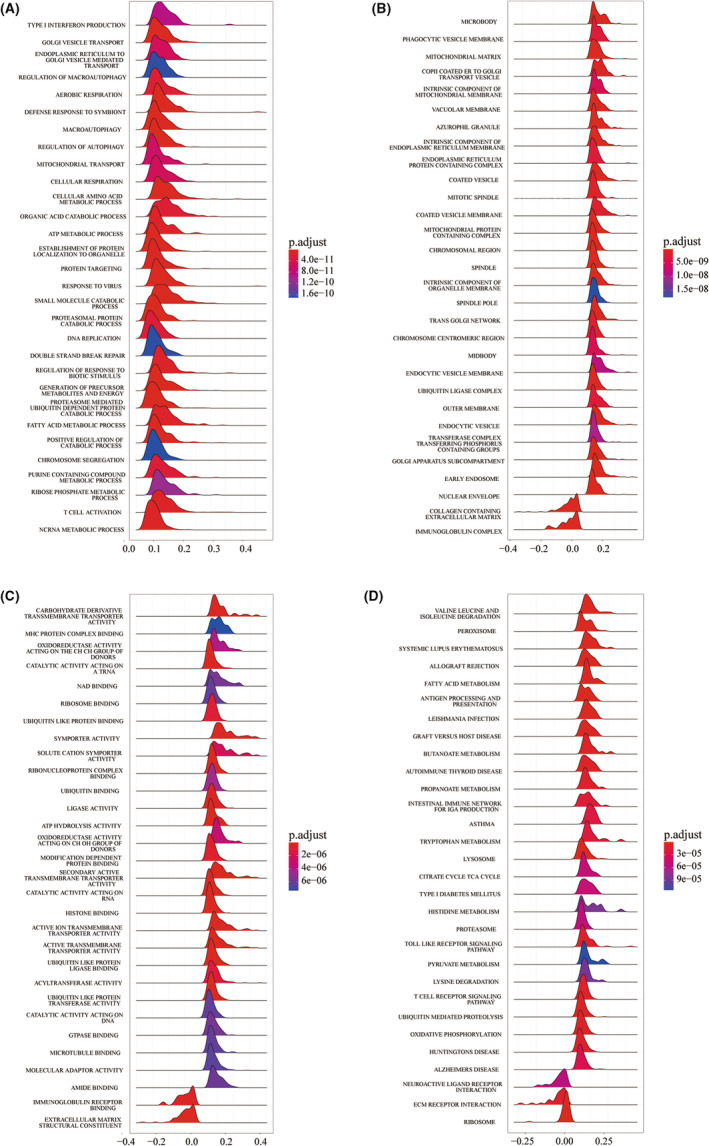
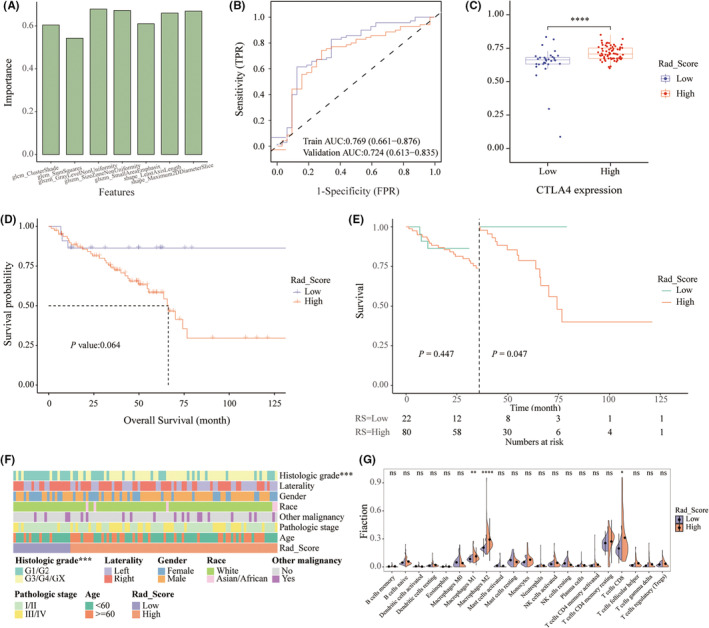
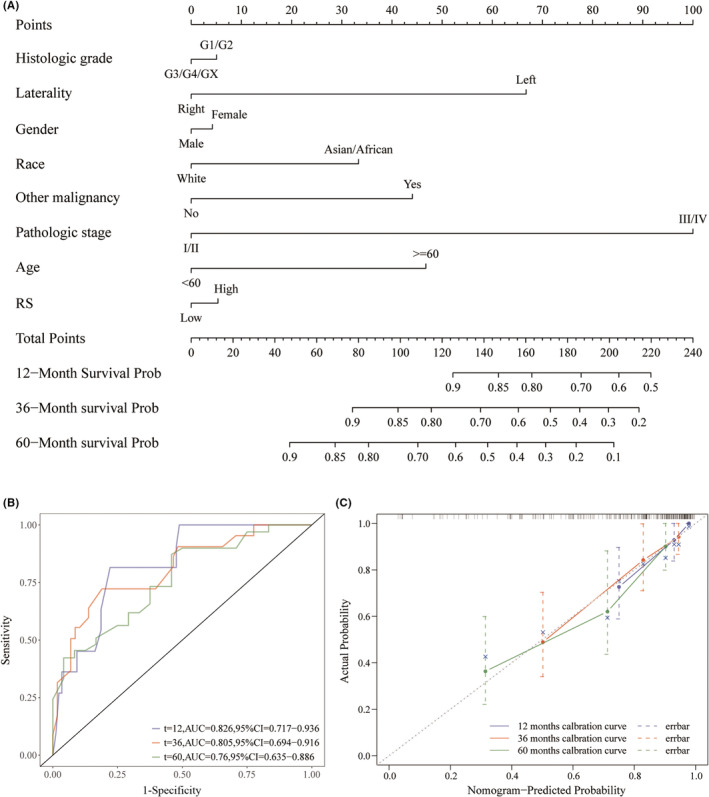
Methods: The clinicopathologic parameters and genomic data were extracted from 493 ccRCC cases of the Cancer Genome Atlas (TCGA)-KIRC database. Univariate and multivariate Cox regression and Kaplan-Meier analysis were performed for prognosis analysis. Cibersortx was applied to evaluate the immune cell composition. Radiomic features were extracted from the TCGA/the Cancer Imaging Archive (TCIA) (n = 102) datasets. The support vector machine (SVM) was employed to establish the radiomics signature for predicting CTLA4 expression. Receiver operating characteristic curve (ROC), decision curve analysis (DCA), and precision-recall curve were utilized to assess the predictive performance of the radiomics signature. Correlations between radiomics score (RS) and selected features were also evaluated. An RS-based nomogram was constructed to predict prognosis.
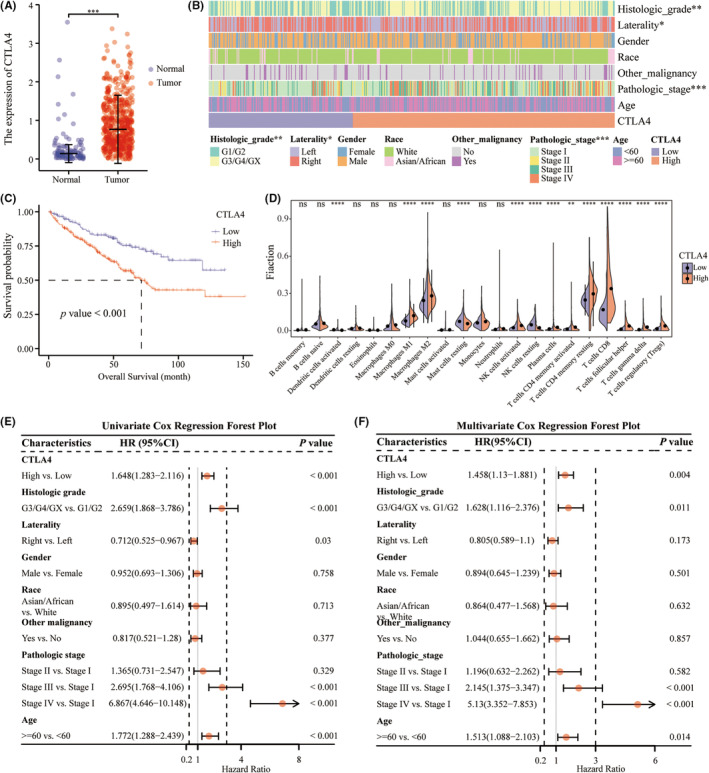
Results: CTLA4 was significantly overexpressed in ccRCC tissues and was related to lower overall survival. A higher CTLA4 expression was independently linked to the poor prognosis (HR = 1.458, 95% CI 1.13-1.881, p = 0.004). The radiomics model for the prediction of CTLA4 expression levels (AUC = 0.769 in the training set, AUC = 0.724 in the validation set) was established using seven radiomic features. A significant elevation in infiltrating M2 macrophages was observed in the RS high group (p < 0.001). The predictive efficiencies of the RS-based nomogram measured by AUC were 0.826 at 12 months, 0.805 at 36 months, and 0.76 at 60 months.
Conclusions: CTLA4 mRNA expression status in ccRCC could be predicted noninvasively using a radiomics model based on nephrographic phase contrast-enhanced CT images. The nomogram established by combining RS and clinicopathologic factors could predict overall survival for ccRCC patients. Our findings may help stratify prognosis of ccRCC patients and identify those who may respond best to ICI-based treatments.
Keywords: CTLA4; biomarker; clear cell renal cell carcinoma; machine learning; radiomics signature.
© 2022 The Authors. Cancer Medicine published by John Wiley & Sons Ltd.
Conflict of interest statement
The authors declare that the research was conducted in the absence of any commercial or financial relationships that could be construed as a potential conflict of interest.
Figures
References
-
- Powles T, Plimack ER, Soulieres D, et al. Pembrolizumab plus axitinib versus sunitinib monotherapy as first‐line treatment of advanced renal cell carcinoma (KEYNOTE‐426): extended follow‐up from a randomised, open‐label, phase 3 trial. Lancet Oncol. 2020;21(12):1563‐1573. - PubMed
Publication types
MeSH terms
Substances
LinkOut - more resources
Full Text Sources
Medical
