

Phenotypic Differences Among Familial Partial Lipodystrophy Due to LMNA or PPARG Variants
- PMID: 36397776
- PMCID: PMC9664976
- DOI: 10.1210/jendso/bvac155
Phenotypic Differences Among Familial Partial Lipodystrophy Due to LMNA or PPARG Variants
Abstract
Context: Despite several reports of familial partial lipodystrophy (FPLD) type 2 (FPLD2) due to heterozygous LMNA variants and FPLD3 due to PPARG variants, the phenotypic differences among them remain unclear.
Objective: To compare the body fat distribution, metabolic parameters, and prevalence of metabolic complications between FPLD3 and FPLD2.
Methods: A retrospective, cross-sectional comparison of patients from 2 tertiary referral centers-UT Southwestern Medical Center and the National Institute of Diabetes and Digestive and Kidney Diseases. A total of 196 females and 59 males with FPLD2 (age 2-86 years) and 28 females and 4 males with FPLD3 (age 9-72 years) were included. The main outcome measures were skinfold thickness, regional body fat by dual-energy X-ray absorptiometry (DXA), metabolic variables, and prevalence of diabetes mellitus and hypertriglyceridemia.
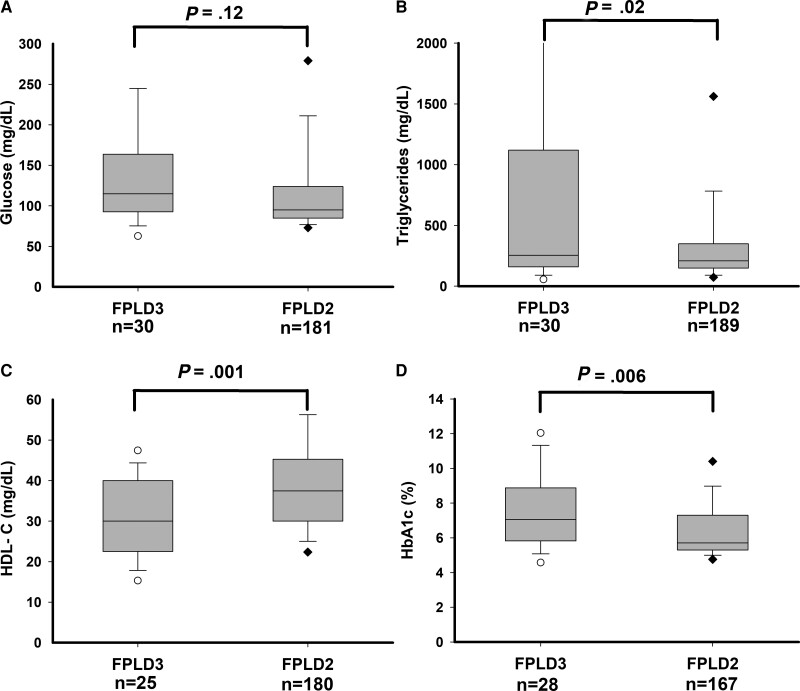
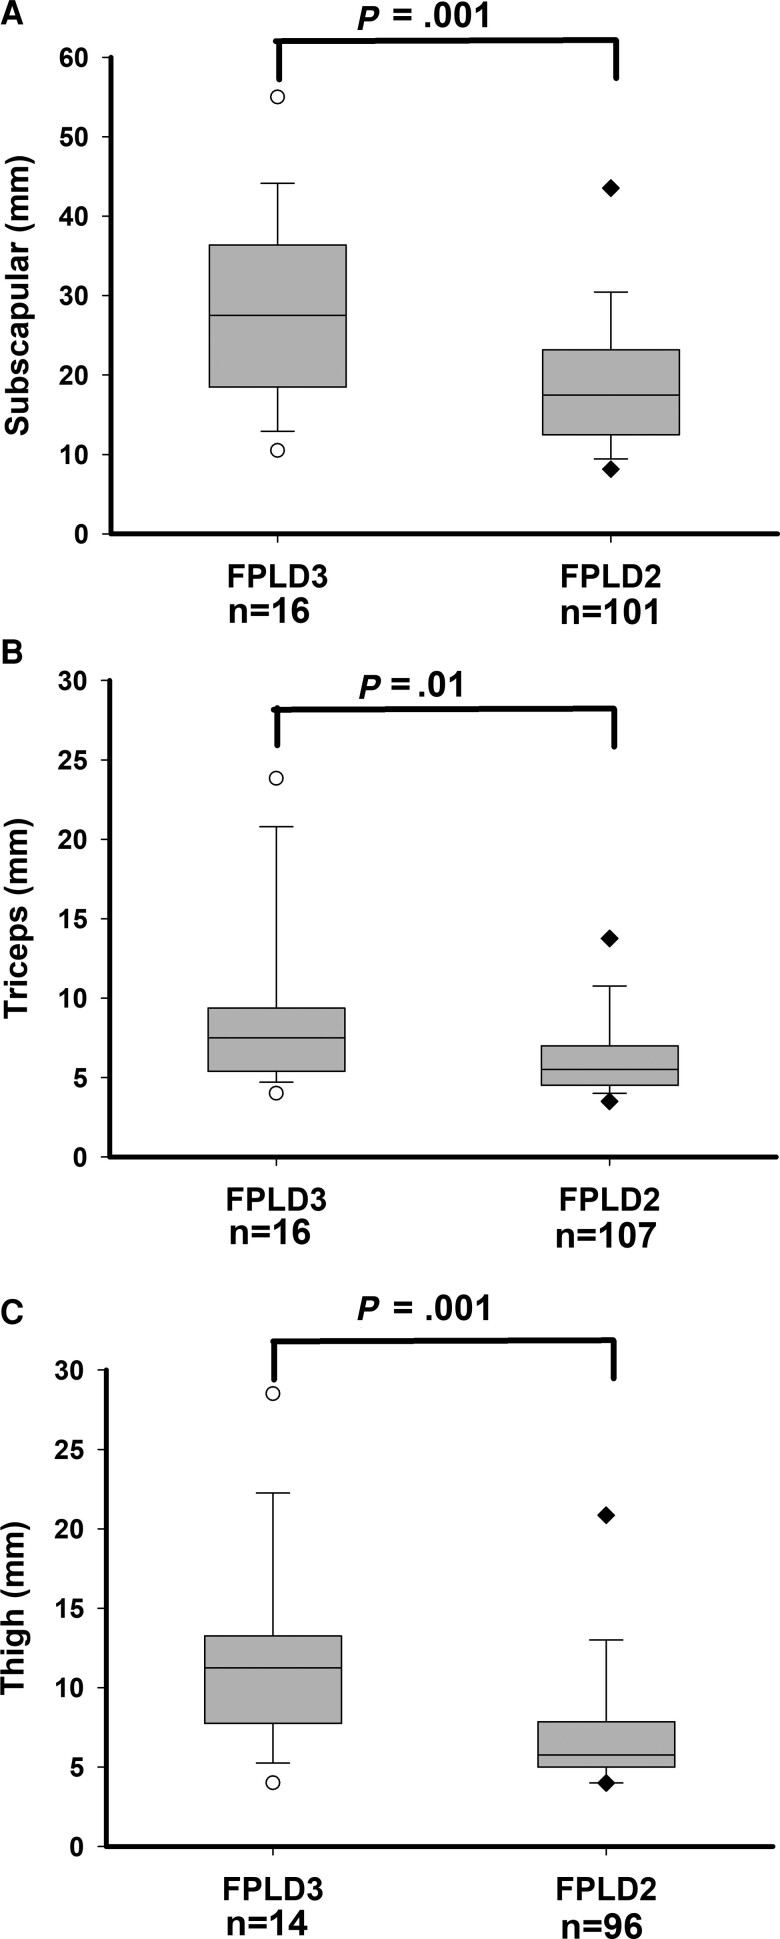
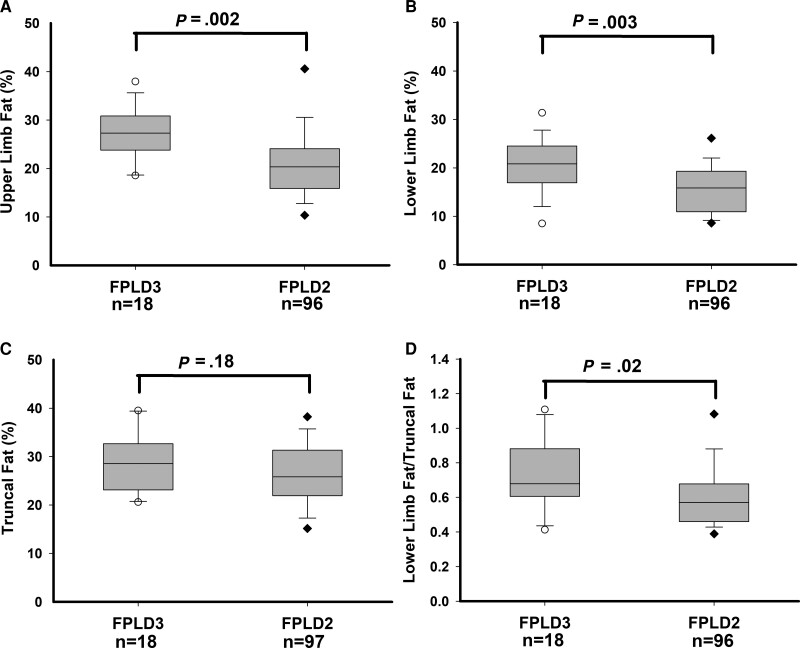
Results: Compared with subjects with FPLD2, subjects with FPLD3 had significantly increased prevalence of hypertriglyceridemia (66% vs 84%) and diabetes (44% vs 72%); and had higher median fasting serum triglycerides (208 vs 255 mg/dL), and mean hemoglobin A1c (6.4% vs 7.5%). Compared with subjects with FPLD2, subjects with FPLD3 also had significantly higher mean upper limb fat (21% vs 27%) and lower limb fat (16% vs 21%) on DXA and increased median skinfold thickness at the anterior thigh (5.8 vs 11.3 mm), calf (4 vs 6 mm), triceps (5.5 vs 7.5 mm), and biceps (4.3 vs 6.8 mm).
Conclusion: Compared with subjects with FPLD2, subjects with FPLD3 have milder lipodystrophy but develop more severe metabolic complications, suggesting that the remaining adipose tissue in subjects with FPLD3 may be dysfunctional or those with mild metabolic disease are underrecognized.
Keywords: LMNA; PPARG; diabetes mellitus; dual-energy X-ray absorptiometry; familial partial lipodystrophy; triglycerides.
© The Author(s) 2022. Published by Oxford University Press on behalf of the Endocrine Society.
Figures
Similar articles
-
A cohort analysis of familial partial lipodystrophy from two Mediterranean countries.Diabetes Obes Metab. 2024 Nov;26(11):4875-4886. doi: 10.1111/dom.15882. Epub 2024 Aug 22. Diabetes Obes Metab. 2024. PMID: 39171574
-
Regional Body Fat Changes and Metabolic Complications in Children With Dunnigan Lipodystrophy-Causing LMNA Variants.J Clin Endocrinol Metab. 2019 Apr 1;104(4):1099-1108. doi: 10.1210/jc.2018-01922. J Clin Endocrinol Metab. 2019. PMID: 30418556 Free PMC article.
-
Diagnostic Value of Anthropometric Measurements for Familial Partial Lipodystrophy, Dunnigan Variety.J Clin Endocrinol Metab. 2020 Jul 1;105(7):2132-41. doi: 10.1210/clinem/dgaa137. J Clin Endocrinol Metab. 2020. PMID: 32193531 Free PMC article.
-
Familial partial lipodystrophy resulting from loss-of-function PPARγ pathogenic variants: phenotypic, clinical, and genetic features.Front Endocrinol (Lausanne). 2024 Sep 27;15:1394102. doi: 10.3389/fendo.2024.1394102. eCollection 2024. Front Endocrinol (Lausanne). 2024. PMID: 39398333 Free PMC article. Review.
-
Diseases of adipose tissue: genetic and acquired lipodystrophies.Biochem Soc Trans. 2005 Nov;33(Pt 5):1073-7. doi: 10.1042/BST0331073. Biochem Soc Trans. 2005. PMID: 16246048 Review.
Cited by
-
Familial Partial Lipodystrophy-Literature Review and Report of a Novel Variant in PPARG Expanding the Spectrum of Disease-Causing Alterations in FPLD3.Diagnostics (Basel). 2022 Apr 30;12(5):1122. doi: 10.3390/diagnostics12051122. Diagnostics (Basel). 2022. PMID: 35626278 Free PMC article.
-
Severe Insulin Resistance Syndromes: Clinical Spectrum and Management.Int J Mol Sci. 2025 Jun 13;26(12):5669. doi: 10.3390/ijms26125669. Int J Mol Sci. 2025. PMID: 40565151 Free PMC article. Review.
-
Natural history and comorbidities of generalised and partial lipodystrophy syndromes in Spain.Front Endocrinol (Lausanne). 2023 Nov 16;14:1250203. doi: 10.3389/fendo.2023.1250203. eCollection 2023. Front Endocrinol (Lausanne). 2023. PMID: 38034001 Free PMC article.
-
Comprehensive analysis of morbidity and mortality patterns in familial partial lipodystrophy patients: insights from a population study.Front Endocrinol (Lausanne). 2024 Jun 3;15:1359211. doi: 10.3389/fendo.2024.1359211. eCollection 2024. Front Endocrinol (Lausanne). 2024. PMID: 38887266 Free PMC article.
-
Genomic and Bioinformatics Analysis of Familial Partial Lipodystrophy Type 3 Identified in a Patient with Novel PPARγ Mutation and Robust Response to Pioglitazone.Int J Mol Sci. 2024 Nov 10;25(22):12060. doi: 10.3390/ijms252212060. Int J Mol Sci. 2024. PMID: 39596129 Free PMC article.
References
-
- Garg A. Acquired and inherited lipodystrophies. N Engl J Med. 2004;350(12):1220–1234. - PubMed
-
- Guenantin AC, Briand N, Bidault G, et al. . Nuclear envelope-related lipodystrophies. Semin Cell Dev Biol. 2014;29:148–157. - PubMed
-
- Agarwal AK, Garg A. A novel heterozygous mutation in peroxisome proliferator-activated receptor-gamma gene in a patient with familial partial lipodystrophy. J Clin Endocrinol Metab. 2002;87(1):408–411. - PubMed
Grants and funding
LinkOut - more resources
Full Text Sources
Miscellaneous