. 2022 Oct;2(10):941-955.
doi: 10.1038/s43587-022-00287-9. Epub 2022 Oct 12.

Associations of the skin, oral and gut microbiome with aging, frailty and infection risk reservoirs in older adults

Affiliations

Associations of the skin, oral and gut microbiome with aging, frailty and infection risk reservoirs in older adults

Peter J Larson et al. Nat Aging. 2022 Oct.

Abstract

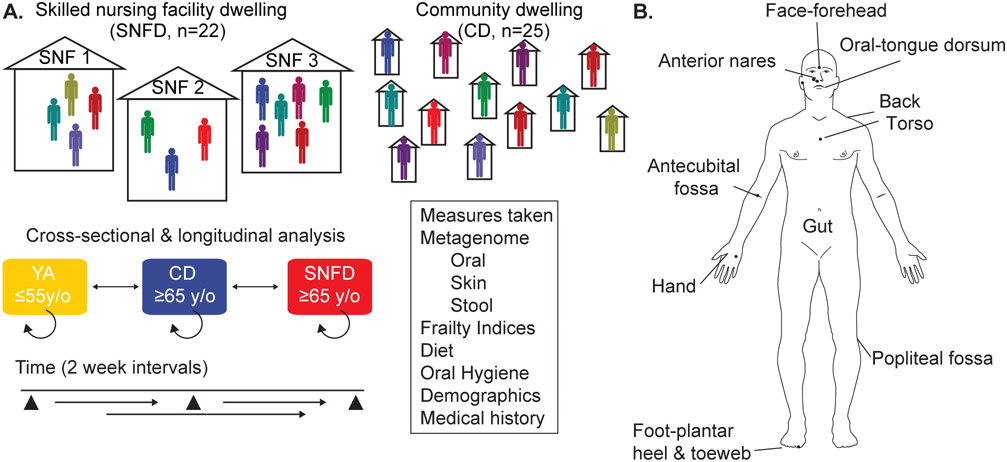
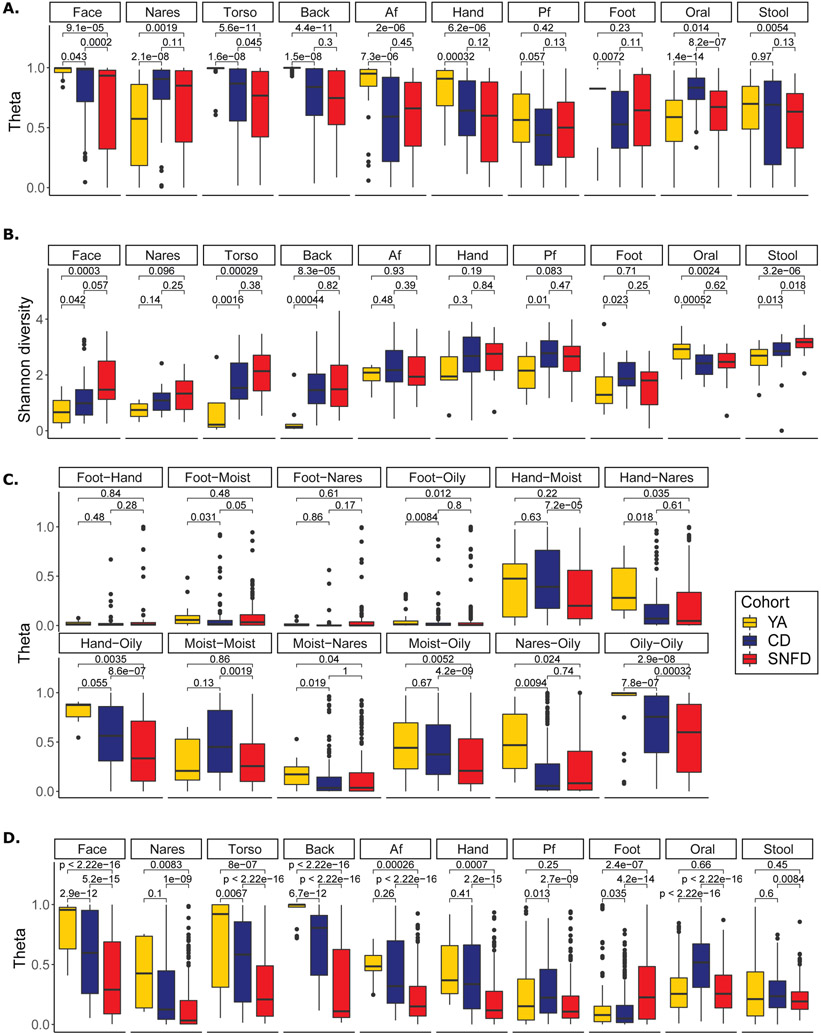
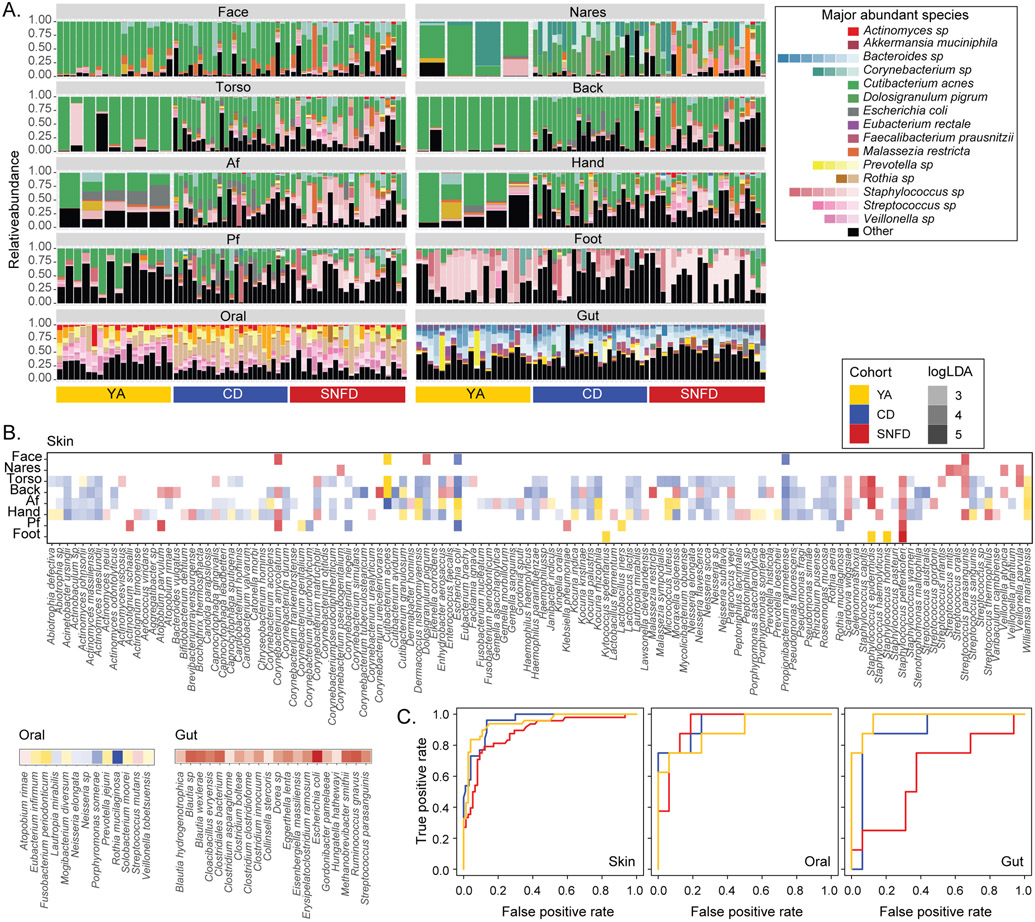
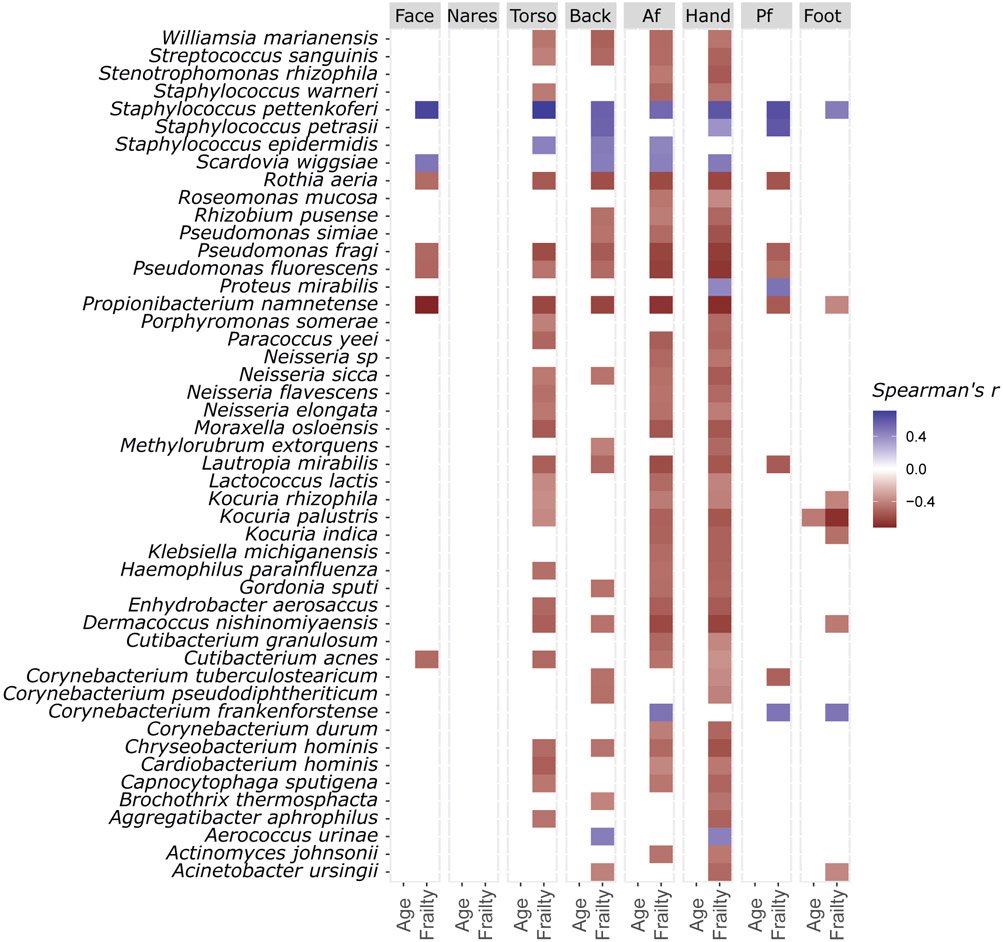
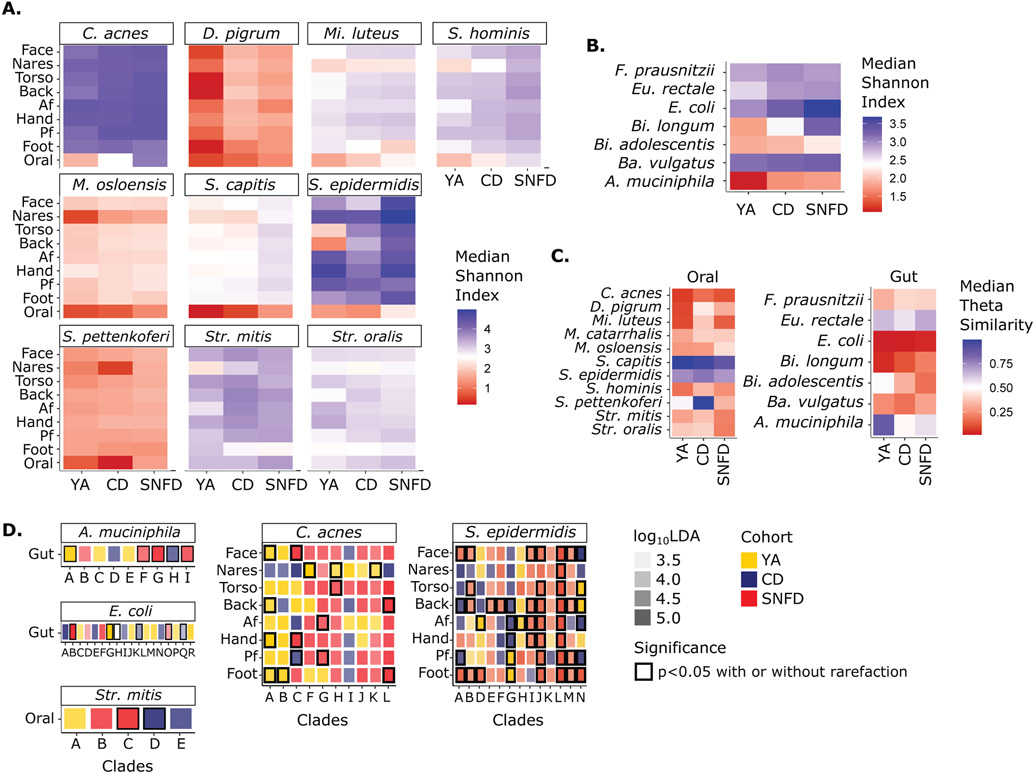
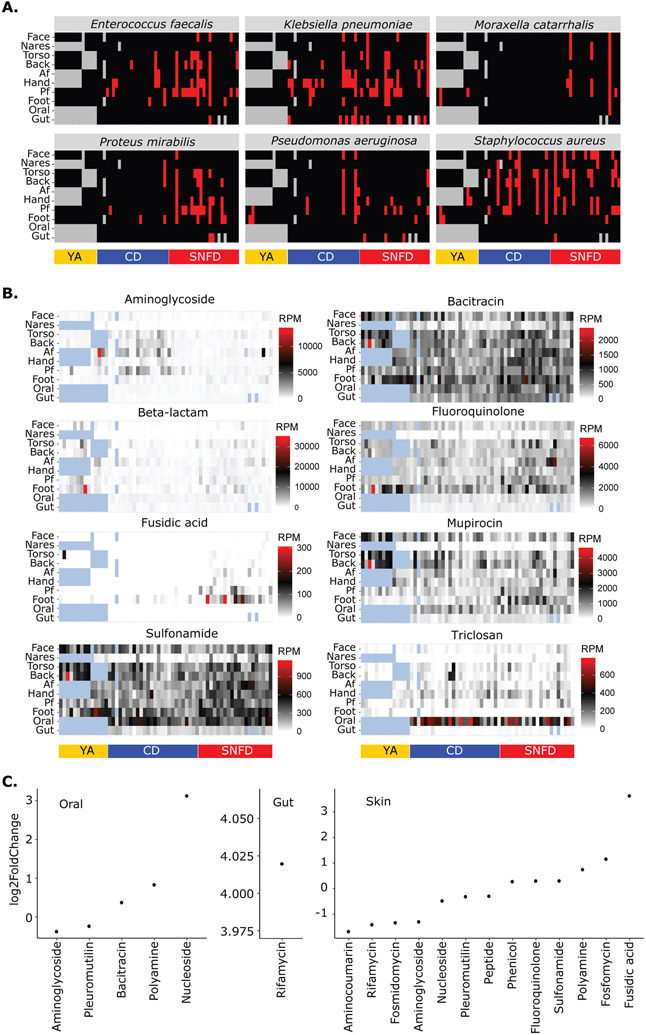
Older adults represent a vulnerable population with elevated risk for numerous morbidities. To explore the association of the microbiome with aging and age-related susceptibilities including frailty and infectious disease risk, we conducted a longitudinal study of the skin, oral, and gut microbiota in 47 community- or skilled nursing facility-dwelling older adults vs. younger adults. We found that microbiome changes were not associated with chronological age so much as frailty: we identified prominent changes in microbiome features associated with susceptibility to pathogen colonization and disease risk, including diversity, stability, heterogeneity, and biogeographic determinism, which were moreover associated with a loss of Cutibacterium (C.) acnes in the skin microbiome. Strikingly, the skin microbiota were also the primary reservoir for antimicrobial resistance, clinically important pathobionts, and nosocomial strains, suggesting a potential role particularly for the skin microbiome in disease risk and dissemination of multidrug resistant pathogens.


Figures

Fig. 1.
Fig. 1.. Study Design.
(A) SNFD cohort was recruited from three different SNFs. CD cohort was recruited from older adults living privately outside of a nursing home. In addition to metagenomic sampling, we collected medical histories, conducted PASE, Fried, and Rockwood Frailty Indices, administered dietary and oral hygiene surveys. Our major comparisons were within cohorts, between cohorts, and with a young adult (YA) cohort derived from our biorepository obtained with identical methods, and our and others’ previously published longitudinal YA cohorts (skin: Oh et al. 2014 & 2016, Zhou et al., 2020; oral and gut samples: Human Microbiome Project -, . (B) Sites obtained by swab at each subject visit: face (forehead), anterior nares, oral (tongue dorsum), upper torso, upper back, antecubital fossa (Af), palmar hand, popliteal fossa (Pf), and foot (plantar surface and toe web space). Participants performed stool self-sampling. Figure adapted from Oh et al., 2014.
Fig. 2.
Fig. 2.. Instability, Hyperdiversification, Heterogeneity, and Biogeographic Divergence in the Aging Microbiome.
(A) Stability, as measured by Yue-Clayton theta index (θ) comparing samples from an individual at different timepoints. θ=1 represents 100% similarity in shared species and their relative abundance; θ=0 indicates no (0%) similarity. The expanded YA cohort – including the in-house, MET and HMP samples -- was used to estimate stability. YA samples from Oh et al. 2016 (face, torso, back, Af, Hand, Pf, foot) had three timepoints, 10-30 months between timepoint 1 and 2, and 5-10 weeks between timepoints 2 and 3. YA samples from Zhou et al. 2021 had 2-4 time points, 2-4 weeks apart. 58 unpublished in-house YA stool samples had 2 time points, approximately 1 year apart (Table S2). HMP samples (YA nares, oral, stool) were taken at ~2 week intervals, as our SNFD and CD cohorts. Additional YA samples were cross-sectional. The analyses were conducted using n=406 YA skin, n=421 YA gut, n=275 YA oral, n=498 CD skin, n=64 CD gut, n= 62 CD oral, n=522 SNFD skin, n=53 SNFD gut, n= 66 SNFD oral time series samples. (B) Shannon Diversity Index represents the number and evenness of different taxa. Diversity of YA was estimated using only the in-house YA cohort. (C) Biogeographic divergence, as measured by θ comparing samples from different skin sites on the same individual at the same timepoint. Divergence of YA was estimated using only the in-house YA cohort. Hand sampling in this study included both dry and moist sites, so we treated hand samples as a distinct site type, as are feet. (D) Inter-individual similarity, as measured by θ comparing samples between individuals within each cohort. Similarity of YA was estimated using only the in-house YA cohort. Lower θ within a cohort ~ higher heterogeneity. The analyses for B, C, and D were conducted using n=83 YA skin, n=53 YA gut, n=28 YA oral, n=195 CD skin, n=25 CD gut, n=25 CD oral, n=176 SNFD skin, n=20 SNFD gut, and n=22 SNFD oral biologically independent (i.e. averaged across repeated measurements) samples. Boxplot edges represent the lower and upper quartile, center lines represent the median, whiskers are extended to the most extreme data point that is no more than 1.5 times the interquartile range from the edges. Benjamini-Hochberg-adjusted two-sided Wilcoxon tests p values are indicated for each comparison. Analogous Bray-Curtis dissimiliarities, analyses using the expanded YA cohort, and analyses using data rarefied to 500,000 and 100,000 reads are reported in fig. S5-S7.
Fig. 3.
Fig. 3.. Compositional Differences in the Microbiota of Older Adults.
Only the in-house YA cohort was used. (A) Relative abundance plots of microbial species across body sites. The top 10 most abundant species in the skin, oral, and gut samples for YA, CD, SNFD cohorts were shown. Each bar represents an individual with relative abundance values from all timepoints averaged. See table S3 for full classifications and fig. S8A for full legend. ~20 YA subjects were shown for each body site. (B) Microbial species significantly enriched in YA, CD, or SNFD cohort. Only significant and strongly enriched species (Kruskal-Wallis test p < 0.05 and log10LDA > 2.0) are shown. Color opacity indicates the corresponding log10LDA value. (C) Receiver operating characteristic (ROC) curves for random forests classifiers assigning individuals into YA (orange), CD (blue), or SNFD (red) based on species-level taxonomic composition. Repeated measurements were averaged for each subject-body site combination. Analogous analyses using the expanded YA cohort are reported in fig. S8 and fig. S9A.
Fig. 4.
Fig. 4.. Associations between Age, Frailty, and the Skin Microbiome.
Association between species relative abundance, age, and frailty (Rockwood Index), tested using the hierarchical all-against-all association testing method (HAllA). Only significant (fdr adjusted p < 0.05) Spearman’s coefficients are shown. Sample sizes: back/face/foot/af/nares n=46, hand/pf/torso N=47.
Fig. 5.
Fig. 5.. Strain-Level Diversity, Heterogeneity, and Differential Abundance of Clades.
Only the in-house YA cohort was used. Strain diversity of select oral & skin (A), and gut (B) species. Previously unabbreviated species: Dolosigranulum (D.), Micrococcus (Mi.), Faecalibacterium (F.), Eubacterium (Eu.) Bifidobacterium (Bi.), Bacteroides (Ba.). Median Shannon Index of strains within species grouped by body site and cohort. (C) Heterogeneity as represented by median θ similarity of strain composition within a cohort. θ=1 represents 100% similarity and thus minimal heterogeneity. θ=0 represents no (0%) similarity, maximum heterogeneity. For A-C, Analogous Bray-Curtis dissimiliarities and analyses using data rarefied to 500,000 reads are reported in fig. S14. (D) Strain clades significantly enriched in YA, CD, or SNFD cohort. Outline color indicates significance (Kruskal-Wallis test p < 0.05). Opacity of the fill color indicates the corresponding log10LDA value. Clade assignments in D are arbitrary letters assigned to primary branches of unrooted phylogenic trees of all genomes for that species (fig S15, table S5-7). Analogous analyses using the expanded YA cohort are reported in fig. S16.
Fig. 6.
Fig. 6.. The Skin is a Major Reservoir of Pathobionts and Plasmid-borne Antimicrobial Resistance in Older Adults.
Only the in-house YA cohort was used. (A) Presence (red) or absence (black) of pathobiont. None of these organisms were detected at any level in our environmental or reagent negative controls. (B) Abundance heatmap of plasmid antimicrobial resistance gene (ARG) class. Each column represents one individual, with one timepoint plotted per volunteer. For (A) and (B), blue and gray patterned tiles, respectively, are samples not represented because they were not collected as part of this study or had insufficient sequencing depth to be included in the analysis. Actual relative abundances are shown in table S4. (C) Differential abundance of plasmid ARG classes between CD and SNFD cohorts. Log2fold change in relative abundance is shown, with positive values representing enrichment in SNFD. Only significant differences (fdr adjusted p < 0.05) were plotted. RPM = reads mapped per million. Analogous analyses using the expanded YA cohort are reported in fig. S18.

Comment in

References

    1. Franceschi C et al. The Continuum of Aging and Age-Related Diseases: Common Mechanisms but Different Rates. Front Med (Lausanne) 5 (2018). - PMC - PubMed
    1. Inouye SK, Studenski S, Tinetti ME & Kuchel GA Geriatric Syndromes: Clinical, Research and Policy Implications of a Core Geriatric Concept. Journal of the American Geriatrics Society 55, 780 (2007). - PMC - PubMed
    1. Tang WHW et al. Intestinal Microbial Metabolism of Phosphatidylcholine and Cardiovascular Risk. The New England journal of medicine 368, 1575 (2013). - PMC - PubMed
    1. Koren O et al. Colloquium Paper: Human oral, gut, and plaque microbiota in patients with atherosclerosis. Proceedings of the National Academy of Sciences of the United States of America 108, 4592 (2011). - PMC - PubMed
    1. Pickard JM, Zeng MY, Caruso R & Núñez G Gut Microbiota: Role in Pathogen Colonization, Immune Responses and Inflammatory Disease. Immunol Rev 279, 70–89 (2017). - PMC - PubMed

Methods-only References

    1. Rockwood K, Theou O & Mitnitski A What are frailty instruments for? Age Ageing 44, 545–547 (2015). - PubMed
    1. Wade WG The oral microbiome in health and disease. Pharmacological Research 69, 137–143 (2013). - PubMed
    1. McInnes P & Cutting M Human Microbiome Project Core Microbiome Sampling Protocol A HMP Protocol # 07-001. (2010).
    1. Martin M Cutadapt removes adapter sequences from high-throughput sequencing reads. EMBnet.journal 17, 10–12 (2011).
    1. Langmead B & Salzberg SL Fast gapped-read alignment with Bowtie 2. Nature methods 9, 357 (2012). - PMC - PubMed

Publication types