

Low-Intensity Vibration Protects the Weight-Bearing Skeleton and Suppresses Fracture Incidence in Boys With Duchenne Muscular Dystrophy: A Prospective, Randomized, Double-Blind, Placebo-Controlled Clinical Trial
- PMID: 36398114
- PMCID: PMC9664527
- DOI: 10.1002/jbm4.10685
Low-Intensity Vibration Protects the Weight-Bearing Skeleton and Suppresses Fracture Incidence in Boys With Duchenne Muscular Dystrophy: A Prospective, Randomized, Double-Blind, Placebo-Controlled Clinical Trial
Abstract
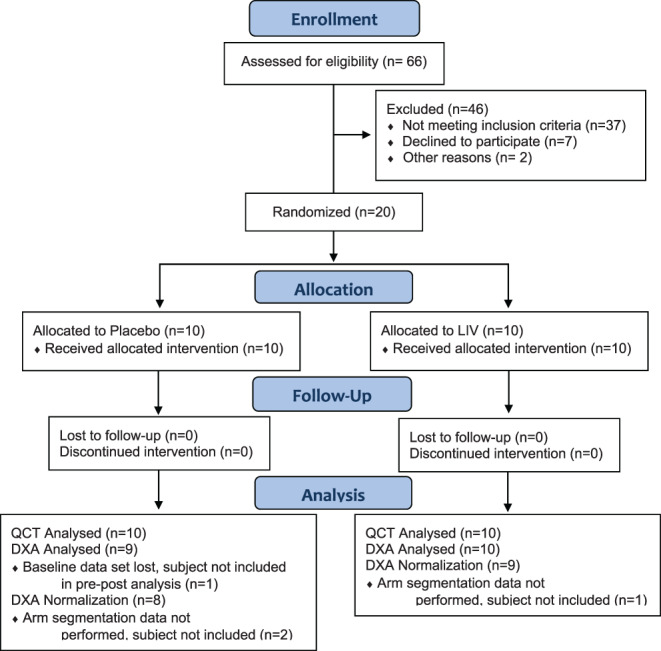
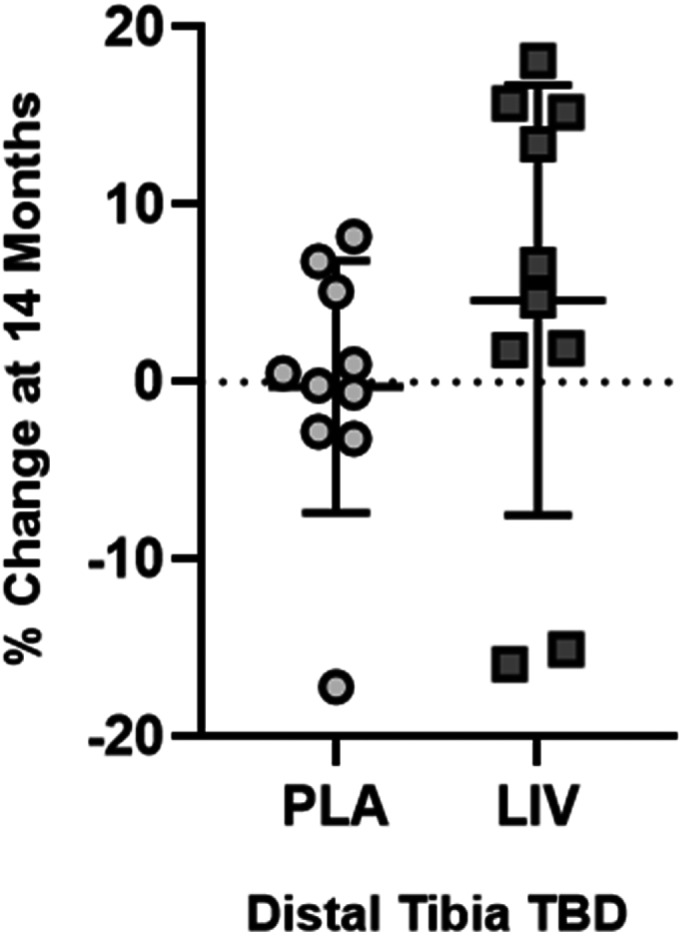
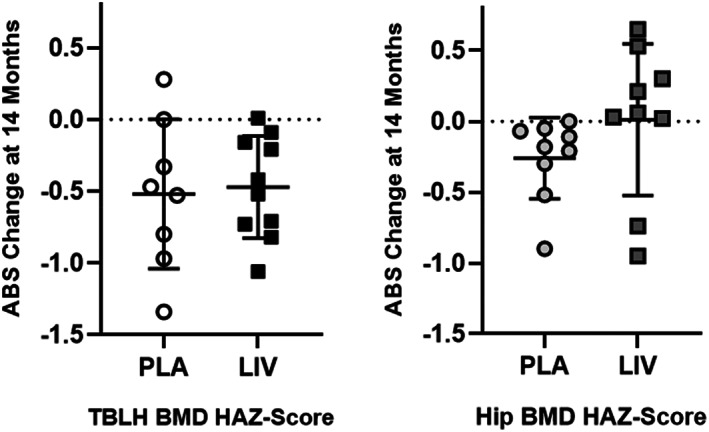
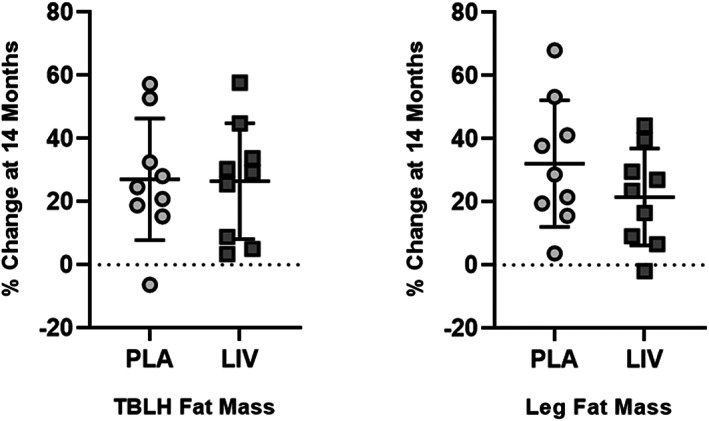
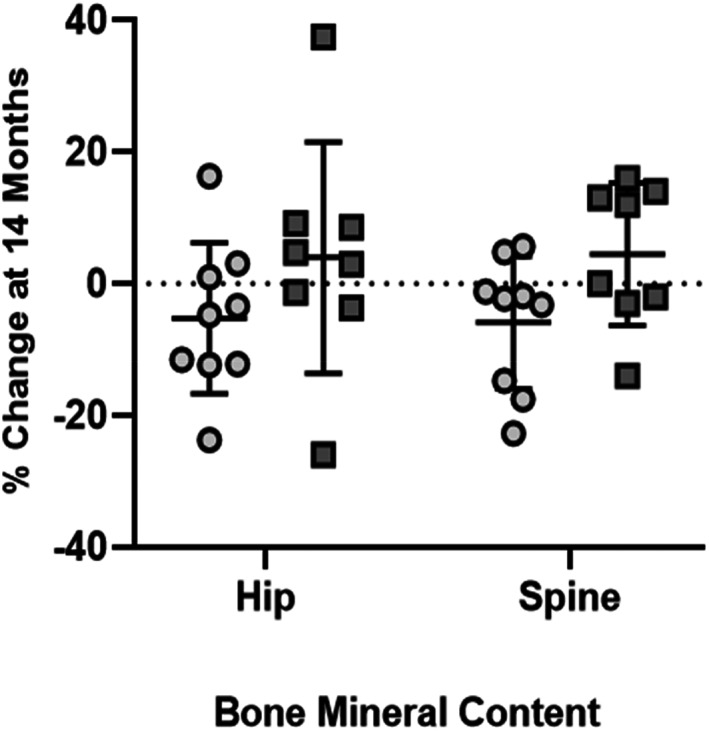
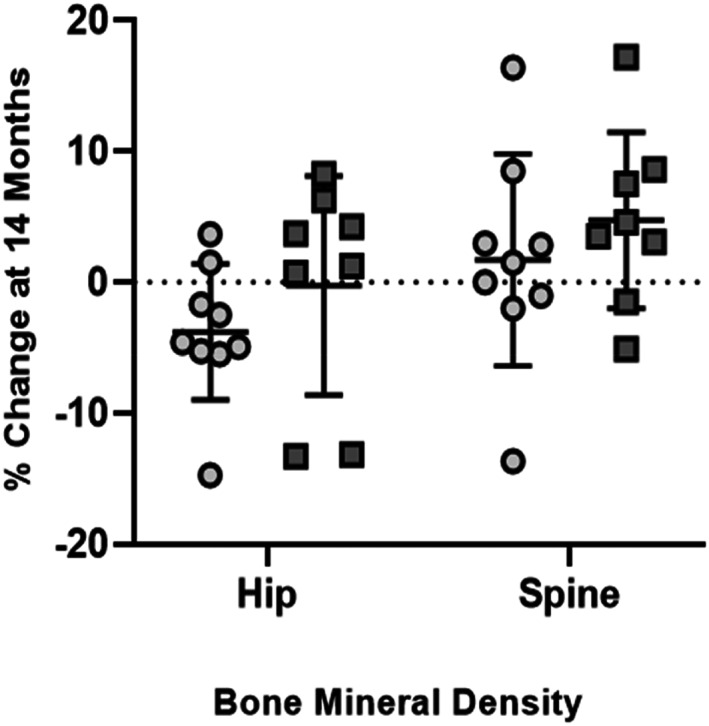
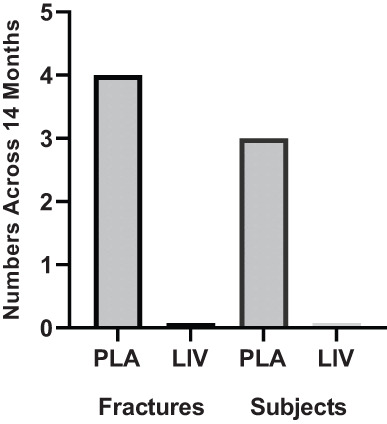
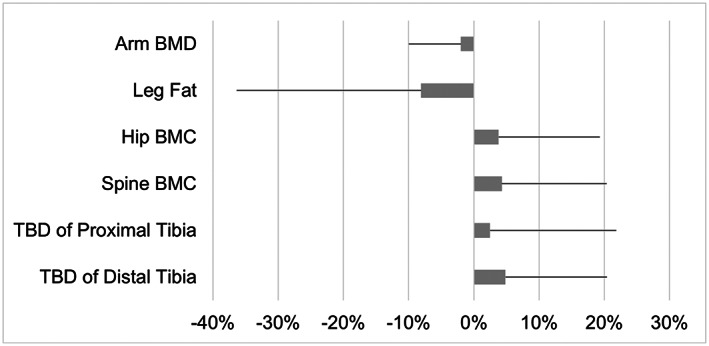
The ability of low-intensity vibration (LIV) to combat skeletal decline in Duchenne Muscular Dystrophy (DMD) was evaluated in a randomized controlled trial. Twenty DMD boys were enrolled, all ambulant and treated with glucocorticoids (mean age 7.6, height-adjusted Z-scores [HAZ] of hip bone mineral density [BMD] -2.3). Ten DMD boys were assigned to stand for 10 min/d on an active LIV platform (0.4 g at 30 Hz), while 10 stood on a placebo device. Baseline and 14-month bone mineral content (BMC) and BMD of spine, hip, and total body were measured with DXA, and trabecular bone density (TBD) of tibia with quantitative computed tomography (QCT). All children tolerated the LIV intervention well, with daily compliance averaging 78%. At 14 months, TBD in the proximal and distal tibia remained unchanged in placebo subjects (-1.0% and -0.2%), while rising 3.5% and 4.6% in LIV subjects. HAZ for hip BMD and BMC in the placebo group declined 22% and 13%, respectively, contrasting with no change from baseline (0.9% and 1.4%) in the LIV group. Fat mass in the leg increased 32% in the placebo group, contrasting with 21% in LIV subjects. Across the 14-month study, there were four incident fractures in three placebo patients (30%), with no new fractures identified in LIV subjects. Despite these encouraging results, a major limitation of the study is-despite randomized enrollment-that there was a significant difference in age between the two cohorts, with the LIV group being 2.8y older, and thus at greater severity of disease. In sum, these data suggest that noninvasive LIV can help protect the skeleton of DMD children against the disease progression, the consequences of diminished load bearing, and the complications of chronic steroid use. © 2022 The Authors. JBMR Plus published by Wiley Periodicals LLC on behalf of American Society for Bone and Mineral Research.
Keywords: BIOMECHANICS; BONE MINERAL CONTENT; BONE MINERAL DENSITY; EXERCISE; OSTEOPOROSIS.
© 2022 The Authors. JBMR Plus published by Wiley Periodicals LLC on behalf of American Society for Bone and Mineral Research.
Conflict of interest statement
CTR and SJ have several U.S. and international patents issued on the use of low intensity vibration for the treatment of musculoskeletal injury and disease. CTR is also a founder of Marodyne, Inc., who developed the LIV platform for clinical use as LivMD. No other authors have any conflicts to report.
Figures
Similar articles
-
Bone health measures in glucocorticoid-treated ambulatory boys with Duchenne muscular dystrophy.Neuromuscul Disord. 2016 Nov;26(11):760-767. doi: 10.1016/j.nmd.2016.08.011. Epub 2016 Aug 22. Neuromuscul Disord. 2016. PMID: 27614576
-
The Efficacy of Low-intensity Vibration to Improve Bone Health in Patients with End-stage Renal Disease Is Highly Dependent on Compliance and Muscle Response.Acad Radiol. 2017 Nov;24(11):1332-1342. doi: 10.1016/j.acra.2017.05.014. Epub 2017 Jun 23. Acad Radiol. 2017. PMID: 28652048 Free PMC article. Clinical Trial.
-
Cessation of ambulation results in a dramatic loss of trabecular bone density in boys with Duchenne muscular dystrophy (DMD).Bone. 2022 Jan;154:116248. doi: 10.1016/j.bone.2021.116248. Epub 2021 Oct 27. Bone. 2022. PMID: 34718220
-
Randomized Controlled Trial Evaluating the Use of Zoledronic Acid in Duchenne Muscular Dystrophy.J Clin Endocrinol Metab. 2021 Jul 13;106(8):2328-2342. doi: 10.1210/clinem/dgab302. J Clin Endocrinol Metab. 2021. PMID: 33954789 Clinical Trial.
-
Utilization of DXA Bone Mineral Densitometry in Ontario: An Evidence-Based Analysis.Ont Health Technol Assess Ser. 2006;6(20):1-180. Epub 2006 Nov 1. Ont Health Technol Assess Ser. 2006. PMID: 23074491 Free PMC article.
Cited by
-
SIRT1 and exercise-induced bone metabolism: a regulatory nexus.Front Cell Dev Biol. 2025 Mar 26;13:1522821. doi: 10.3389/fcell.2025.1522821. eCollection 2025. Front Cell Dev Biol. 2025. PMID: 40206398 Free PMC article. Review.
-
Enhancing anti-tumor potential: low-intensity vibration suppresses osteosarcoma progression and augments MSCs' tumor-suppressive abilities.Theranostics. 2024 Jan 27;14(4):1430-1449. doi: 10.7150/thno.90945. eCollection 2024. Theranostics. 2024. PMID: 38389836 Free PMC article.
-
Poor bone health in Duchenne muscular dystrophy: a multifactorial problem beyond corticosteroids and loss of ambulation.Front Endocrinol (Lausanne). 2024 Nov 28;15:1398050. doi: 10.3389/fendo.2024.1398050. eCollection 2024. Front Endocrinol (Lausanne). 2024. PMID: 39669499 Free PMC article. Review.
-
Low-Intensity Vibration to Reduce Symptoms and Improve Physical Functioning in Cancer Survivors With Chemotherapy-Induced Peripheral Neuropathy: A Pilot Randomized Trial.JCO Oncol Pract. 2025 May 15:OP2400961. doi: 10.1200/OP-24-00961. Online ahead of print. JCO Oncol Pract. 2025. PMID: 40373263
-
The Use of Whole-Body Vibration, Electrical Stimulation, and Magnetic Stimulation in Muscle Dystrophy Patients: A Scoping Review.Cureus. 2024 Aug 17;16(8):e67051. doi: 10.7759/cureus.67051. eCollection 2024 Aug. Cureus. 2024. PMID: 39286699 Free PMC article.
References
-
- Summer SS, Wong BL, Rutter MM, et al. Age‐related changes in appendicular lean mass in males with Duchenne muscular dystrophy: a retrospective review. Muscle Nerve. 2021;63(2):231‐238. - PubMed
-
- Deconinck N, Dan B. Pathophysiology of Duchenne muscular dystrophy: current hypotheses. Pediatr Neurol. 2007;36(1):1‐7. - PubMed
-
- Sussman M. Duchenne muscular dystrophy. J Am Acad Orthop Surg. 2002;10(2):138‐151. - PubMed
Publication types
LinkOut - more resources
Full Text Sources