. 2023 Feb 6;62(7):e202215535.
doi: 10.1002/anie.202215535. Epub 2023 Jan 10.

Neutralizing the Impact of the Virulence Factor LecA from Pseudomonas aeruginosa on Human Cells with New Glycomimetic Inhibitors

Affiliations

Neutralizing the Impact of the Virulence Factor LecA from Pseudomonas aeruginosa on Human Cells with New Glycomimetic Inhibitors

Eva Zahorska et al. Angew Chem Int Ed Engl. .

Abstract

Bacterial adhesion, biofilm formation and host cell invasion of the ESKAPE pathogen Pseudomonas aeruginosa require the tetravalent lectins LecA and LecB, which are therefore drug targets to fight these infections. Recently, we have reported highly potent divalent galactosides as specific LecA inhibitors. However, they suffered from very low solubility and an intrinsic chemical instability due to two acylhydrazone motifs, which precluded further biological evaluation. Here, we isosterically substituted the acylhydrazones and systematically varied linker identity and length between the two galactosides necessary for LecA binding. The optimized divalent LecA ligands showed improved stability and were up to 1000-fold more soluble. Importantly, these properties now enabled their biological characterization. The lead compound L2 potently inhibited LecA binding to lung epithelial cells, restored wound closure in a scratch assay and reduced the invasiveness of P. aeruginosa into host cells.

Keywords: Glycomimetics; Lectin; Pathoblocker; Pseudomonas Aeruginosa; Virulence.


Conflict of interest statement

The authors declare no conflict of interest.

Figures
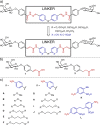
Figure 1
Figure 1
Divalent precision LecA ligands: a) parent bisacylhydrazone LecA inhibitors (top) and new generation optimized bioisosters (bottom). Proposed chemical modifications are highlighted: amide linkage as acylhydrazone bioisoster in red and linker derivatizations in blue. b) Galactoside building blocks with terminal α,β‐unsaturated carboxylate 1 and its saturated analogue 2. c) Linker moieties: anilines BF, aminopyridines HJ and sulfonated linker L, and their monovalent controls A, G, and K.
Scheme 1
Scheme 1
Synthesis of galactoside building blocks 1 and 2. Reagents and conditions: (i) benzyl p‐coumarate/methyl 3‐(4‐hydroxyphenyl)‐propanoate, BF3⋅Et2O, CHCl3 for 4 and CH2Cl2 for 5, 0 °C–r.t., overnight; (ii) NaOH, H2O/MeOH (1 : 1), 50 °C for 1 and r.t. for 2, 1–2 h.
Scheme 2
Scheme 2
Synthesis of benzene, pyridine and phenylsulfonate linkers. Reagents and conditions: (i) 4‐nitrophenol, K2CO3, DMF, 70 °C, microwave, 11 h–4 d (for C 10 d, no irradiation); (ii) H2, Pd/C, CH2Cl2/MeOH, r.t., 3 h–o.n.; (iii) 2‐chloro‐5‐nitropyridine, NaH, r.t., DMF, 1 h–2 d (for H K2CO3, 65 °C, DMF, 5 d); (iv) Raney Ni, H2, r.t., H2O, 6 d.
Scheme 3
Scheme 3
Synthesis of divalent LecA ligands and their monovalent analogues as controls. Reagents and conditions: (i) for A and G: HBTU, DIPEA, DMF, r.t., 1 h–overnight, for K: PyBOP, N‐methylmorpholine, DMF, r.t., overnight; (ii) galactoside 1 or 2, HBTU, DIPEA, DMF, r.t., 2 h–2 d, (iii) galactoside 2, PyBOP, N‐methylmorpholine, DMF, r.t., overnight.
Figure 2
Figure 2
Direct binding of LecA ligands determined by SPR (N=3). Sensorgram of monovalent A2 (left) with affinity analysis (center) and sensorgram of divalent B2 (right) from single‐cycle kinetics experiments (injections of 0, 10, 50, 100, 200 nM for B2 or 0, 1, 2.5, 5, 10 μM for A2) are shown. Relative potencies (r.p.) were calculated compared to respective monovalent compound in each series and are valency‐normalized. *N=1 due to sample aggregation.
Figure 3
Figure 3
Direct binding of selected ligands to LecA by ITC (N=3). Titration of LecA (50 μM) with divalent sulfonated ligand L2 (250 μM) is depicted. Relative potencies (r.p.) were calculated compared to respective monovalent compound in each series and are valency‐normalized.
Figure 4
Figure 4
Divalent inhibitors H2 and L2 decreased LecA binding and uptake to lung cells (N=3). Histograms of fluorescence intensity of gated live H1299 cells incubated with 0.16 μM of LecA‐AF488 in presence of a) H2 or b) L2. H1299 cells (without LecA, H2 or L2) served as a negative control (grey). c) IC50 values for inhibition of LecA binding to H1299 cells of monovalent inhibitors G2 and K2, divalent inhibitors H2 and L2 following titrations in flow cytometry assays. d) Confocal imaging of H1299 cells incubated with 0.5 μM LecA‐AF488 (in green) or 0.5 μM LecA‐AF488 which was preincubated with 10 μM H2 or L2. Nuclei were counterstained with DAPI (blue). Scale bars=10 μm.
Figure 5
Figure 5
Divalent inhibitor L2 restored wound healing in LecA‐treated cells and reduced P. aeruginosa PAO1 invasiveness into host cells. Wound healing (N=3): a) Light microscopy images of scratched H1299 cells at 0 h and 24 h post‐treatment with (1) PBS, (2) 3.9 μM LecA, (3) 3.9 μM LecA preincubated with 10 μM L2, or (4) 3.9 μM LecA preincubated with 100 μM L2. Scale bars=100 μm. b) Quantification of wound closure after 24 h, control in absence of LecA. Bacterial Invasion (N≥4): c) Incubation of P. aeruginosa PAO1 with 100 μM PNPG, 10 mM PNPG or 100 μM L2 for 30 min reduced bacterial invasiveness into H1299 cells in comparison to the absence of inhibitors (positive control). For each experiment, conditions were normalized to invasion of untreated bacteria (positive control).
Figure 6
Figure 6
In vivo pharmacokinetics of H2 and L2. Plasma and urine concentrations in a) CD‐1 mice (N=2 per compound) after 1 mg kg−1 i. v. dose of H2 (1.15 μmol kg−1) and L2 (0.97 μmol kg−1) and in b) Sprague‐Dawley rats (N=3) after 10 mg kg−1 i. v. dose of L2 (9.73 μmol kg−1). Dashed lines represent the in vitro K d values.

References

    1. Ernst B., Magnani J. L., Nat. Rev. Drug Discov. 2009, 8, 661–677. - PMC - PubMed
    1. Meiers J., Siebs E., Zahorska E., Titz A., Curr. Opin. Chem. Biol. 2019, 53, 51–67. - PubMed
    1. Rice L. B., J. Infect. Dis. 2008, 197, 1079–1081. - PubMed
    1. Wagner S., Sommer R., Hinsberger S., Lu C., Hartmann R. W., Empting M., Titz A., J. Med. Chem. 2016, 59, 5929–5969. - PubMed
    1. Davies D., Nat. Rev. Drug Discovery 2003, 2, 114–122. - PubMed

Publication types

LinkOut - more resources