. 2023 Mar 1;13(3):632-653.
doi: 10.1158/2159-8290.CD-22-0692.

Nucleosome Patterns in Circulating Tumor DNA Reveal Transcriptional Regulation of Advanced Prostate Cancer Phenotypes

Affiliations

Nucleosome Patterns in Circulating Tumor DNA Reveal Transcriptional Regulation of Advanced Prostate Cancer Phenotypes

Navonil De Sarkar et al. Cancer Discov. .

Abstract

Advanced prostate cancers comprise distinct phenotypes, but tumor classification remains clinically challenging. Here, we harnessed circulating tumor DNA (ctDNA) to study tumor phenotypes by ascertaining nucleosome positioning patterns associated with transcription regulation. We sequenced plasma ctDNA whole genomes from patient-derived xenografts representing a spectrum of androgen receptor active (ARPC) and neuroendocrine (NEPC) prostate cancers. Nucleosome patterns associated with transcriptional activity were reflected in ctDNA at regions of genes, promoters, histone modifications, transcription factor binding, and accessible chromatin. We identified the activity of key phenotype-defining transcriptional regulators from ctDNA, including AR, ASCL1, HOXB13, HNF4G, and GATA2. To distinguish NEPC and ARPC in patient plasma samples, we developed prediction models that achieved accuracies of 97% for dominant phenotypes and 87% for mixed clinical phenotypes. Although phenotype classification is typically assessed by IHC or transcriptome profiling from tumor biopsies, we demonstrate that ctDNA provides comparable results with diagnostic advantages for precision oncology.

Significance: This study provides insights into the dynamics of nucleosome positioning and gene regulation associated with cancer phenotypes that can be ascertained from ctDNA. New methods for classification in phenotype mixtures extend the utility of ctDNA beyond assessments of somatic DNA alterations with important implications for molecular classification and precision oncology. This article is highlighted in the In This Issue feature, p. 517.


Figures

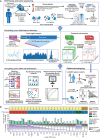
Figure 1. Characterizing advanced prostate cancer through matched tumor and liquid biopsies from PDX models. A, (top) Both blood and tissue samples were taken from 26 PDX mouse models with tumors originating from mCRPC with AR-positive adenocarcinoma (ARPC), neuroendocrine (NEPC), AR-low neuroendocrine-negative (ARLPC) phenotypes. cfDNA was extracted from pooled plasma collected from 4 to 8 mice and WGS was performed. Following bioinformatic mouse read subtraction, pure human ctDNA reads remained. From PDX tissue, ATAC-seq and CUT&RUN (targeting H3K27ac, H3K4me1, and H3K27me3) data were generated. Middle, Four distinct ctDNA features were analyzed at five genomic region types using Griffin (51) or nucleosome phasing methods developed in this study (Methods). Bottom (left), overview of PDX ctDNA features profiled to characterize the mCRPC pathways, transcriptional regulation, and nucleosome positioning. ctDNA features were evaluated for phenotype classification. Bottom (right), phenotype classification using probabilistic and analytical models that accounted for ctDNA tumor content and were informed by PDX features were applied to 159 samples in three patient cohorts. B, PDX phenotypes and mouse plasma sequencing. Inclusion status based on final mean depth after mouse read subtraction (< 3× coverage was excluded; red dotted line). Phenotype status, including 6 NEPC, 18 ARPC (2 excluded), and 2 ARLPC. Average depth of coverage before and after mouse subtraction (mean coverage 20.5×; dotted line). Percentage of the cfDNA sample that contains human ctDNA after mouse read subtraction.
Figure 1.
Characterizing advanced prostate cancer through matched tumor and liquid biopsies from PDX models. A, Top, both blood and tissue samples were taken from 26 PDX mouse models with tumors originating from mCRPC with AR-positive adenocarcinoma (ARPC), neuroendocrine (NEPC), AR-low neuroendocrine-negative (ARLPC) phenotypes. cfDNA was extracted from pooled plasma collected from 4 to 8 mice and WGS was performed. Following bioinformatic mouse read subtraction, pure human ctDNA reads remained. From PDX tissue, ATAC-seq and CUT&RUN (targeting H3K27ac, H3K4me1, and H3K27me3) data were generated. Middle, four distinct ctDNA features were analyzed at five genomic region types using Griffin (52) or nucleosome phasing methods developed in this study (Methods). Bottom (left), overview of PDX ctDNA features profiled to characterize the mCRPC pathways, transcriptional regulation, and nucleosome positioning. ctDNA features were evaluated for phenotype classification. Bottom (right), phenotype classification using probabilistic and analytic models that accounted for ctDNA tumor content and were informed by PDX features were applied to 159 samples in three patient cohorts. B, PDX phenotypes and mouse plasma sequencing. Inclusion status based on final mean depth after mouse read subtraction (< 3× coverage was excluded; red dotted line). Phenotype status, including 6 NEPC, 18 ARPC (2 excluded), and 2 ARLPC. Average depth of coverage before and after mouse subtraction (mean coverage 20.5×; dotted line). Percentage of the cfDNA sample that contains human ctDNA after mouse read subtraction.
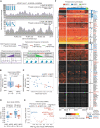
Figure 2. Analysis of tumor histone modifications and ctDNA reveals nucleosome patterns consistent with transcriptional regulation in CRPC phenotype-specific genes. A, H3K27ac peak signals between ARLPC, ARPC, and NEPC PDX tumor phenotypes at 10,000 AR binding sites (left) and at ASCL1 binding sites (right). Binding sites were selected from the GTRD (ref. 70; Methods). B and C, Composite coverage profiles at 1,000 AR (B) and ASCL1 (C) binding sites in ctDNA analyzed using Griffin for 140–250 bp fragments (Methods). Coverage profile means (lines) and 95% confidence interval computed using 1,000 bootstraps for a subset of sites (shading) are shown. The region ±150 bp is indicated with a vertical dotted line and yellow shading. D, Heat map of log2 fold change in 47 key genes upregulated and downregulated between ARPC and NEPC established through RNA-seq (left) grouped by the type of histone modification which dictates translation levels: Group 1 shows genes activity attributable to H3K27ac or H3K4me1 PTM marks in the gene promoters or putative distal enhancers and lacking H3K27me3 heterochromatic mark in the gene body; group 2 features gene body spanning H3K27me3 repression marks. Central columns show differential peak intensity for each of the assayed histone modifications, separated by whether they appear upstream or in the promoter or the body of each gene. On the right, the log2 fold change between ARPC and NEPC lines’ cfDNA fragment size CV is shown for TSS ± 1 KB windows and respective gene bodies. E, Comparison of the log2 fold change (ARPC/NEPC) of mean mRNA expression vs. mean CV in the 47 phenotypic lineage marker genes’ promoter regions. F, (top) Illustrations of expected ctDNA coverage profiles for group 1 genes with and without H3K27ac or H3K4me1 modification leading to active and inactive transcription, respectively. Bottom, ±1,000 bp surrounding the promoter region for AR and ASCL1 in ARPC and NEPC. Shown are coverage profile means (lines) and 95% confidence interval computed using 1,000 bootstraps for a subset of sites (shading). Decreased coverage is reflective of increased nucleosome accessibility and thus increased transcription. Dotted line and yellow shading highlight the TSS at −230 bp and +170 bp. G, Illustration of expected ctDNA coverage profiles for group 2 genes with repressed transcription caused by H3K27me3 modifications in the gene body. Neuronal gene UNC13A has increased nucleosome phasing in the ctDNA of ARPC samples compared with NEPC.
Figure 2.
Analysis of tumor histone modifications and ctDNA reveals nucleosome patterns consistent with transcriptional regulation in CRPC phenotype-specific genes. A, H3K27ac peak signals between ARLPC, ARPC, and NEPC PDX tumor phenotypes at 10,000 AR binding sites (left) and at ASCL1 binding sites (right). Binding sites were selected from the GTRD (ref. ; Methods). B and C, Composite coverage profiles at 1,000 AR (B) and ASCL1 (C) binding sites in ctDNA analyzed using Griffin for 140–250 bp fragments (Methods). Coverage profile means (lines) and 95% confidence interval computed using 1,000 bootstraps for a subset of sites (shading) are shown. The region ±150 bp is indicated with a vertical dotted line and yellow shading. D, Heat map of log2 fold change in 47 key genes upregulated and downregulated between ARPC and NEPC established through RNA-seq (left) grouped by the type of histone modification which dictates translation levels: Group 1 shows gene activity attributable to H3K27ac or H3K4me1 PTM marks in the gene promoters or putative distal enhancers and lacking H3K27me3 heterochromatic mark in the gene body; group 2 features gene body spanning H3K27me3 repression marks. Central columns show differential peak intensity for each of the assayed histone modifications, separated by whether they appear upstream or in the promoter or the body of each gene. On the right, the log2 fold change between ARPC and NEPC lines’ cfDNA fragment size CV is shown for TSS ± 1 KB windows and respective gene bodies. E, Comparison of the log2 fold change (ARPC/NEPC) of mean mRNA expression vs. mean CV in the 47 phenotypic lineage marker genes’ promoter regions. F, Top, illustrations of expected ctDNA coverage profiles for group 1 genes with and without H3K27ac or H3K4me1 modification leading to active and inactive transcription, respectively. Bottom, ±1,000 bp surrounding the promoter region for AR and ASCL1 in ARPC and NEPC. Shown are coverage profile means (lines) and 95% confidence interval computed using 1,000 bootstraps for a subset of sites (shading). Decreased coverage is reflective of increased nucleosome accessibility and thus increased transcription. Dotted line and yellow shading highlight the TSS at −230 bp and +170 bp. G, Illustration of expected ctDNA coverage profiles for group 2 genes with repressed transcription caused by H3K27me3 modifications in the gene body. Neuronal gene UNC13A has increased nucleosome phasing in the ctDNA of ARPC samples compared with NEPC.
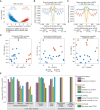
Figure 3. Phasing analysis in ctDNA recapitulates nucleosome stability and trends in transcriptional activity between CRPC phenotypes. A, Illustration of nucleosome phasing analysis using TritonNP for HOXB13, which is expressed in ARPC but not NEPC. Fourier transform and a band-pass filter-based smoothing method was used to identify phased peaks (gray dotted lines). Frequency components corresponding to nucleosome dyads (wavelength > 146 bp) are shown in purple. The mean internucleosome distance was computed from all peaks in the gene body: lower values represent more periodic and stable nucleosomes. NPS is defined as the ratio of the mean amplitudes between frequency components 180–210 bp (“stable,” green curve) and 150–180 bp (“baseline,” red curve). B, Boxplot of mean phased-nucleosome distance in 17,946 gene bodies per ctDNA sample for ARPC and NEPC PDX lines. Two-tailed Mann–Whitney U test P value is shown. C, Comparison of the mean phased-nucleosome distance and the mean CCP score (estimated from RNA-seq) for 16 ARPC and 6 NEPC PDX lines. D, Boxplot of NPS in gene bodies of 47 phenotype-defining genes (35 NE-regulated and 12 AR-regulated) between ARPC and NEPC lines. Two-tailed Mann–Whitney U test P values are shown. E, Volcano plot of NPS log2 fold change (ARPC/NEPC) in the 47 phenotype-defining genes. Genes with significantly higher NPS scores (solid-colored dots (two-tailed Mann–Whitney U test, Benjamini–Hochberg adjusted FDR at P < 0.05) and nonsignificant genes (open circle) are shown. F, Hierarchical clustering of the normalized composite central mean coverage at TFBSs from the Griffin analysis of ctDNA for 108 TFs in LuCaP PDX lines of ARPC (n = 16), NEPC (n = 6), and ARLPC (n = 2) phenotypes. This list of TFs was initially selected as having differential expression between ARPC and NEPC from LuCaP PDX RNA-seq analysis. Heat map colors indicate increased accessibility (low values; yellow, orange, red) and decreased accessibility (higher values; black) in ctDNA. TFs with increased accessibility in NEPC samples (log2 fold change > 0.05, Mann–Whitney U test P < 0.05) are indicated with red bars; increased accessibility in ARPC (log2 fold change <−0.05, P < 0.05) are indicated with blue bars. Text color indicates relative expression between ARPC and NEPC PDX tumors by RNA-seq shown for TFs with significant differential accessibility.
Figure 3.
Phasing analysis in ctDNA recapitulates nucleosome stability and trends in transcriptional activity between CRPC phenotypes. A, Illustration of nucleosome phasing analysis using TritonNP for HOXB13, which is expressed in ARPC but not NEPC. Fourier transform and a band-pass filter-based smoothing method was used to identify phased peaks (gray dotted lines). Frequency components corresponding to nucleosome dyads (wavelength > 146 bp) are shown in purple. The mean internucleosome distance was computed from all peaks in the gene body: lower values represent more periodic and stable nucleosomes. NPS is defined as the ratio of the mean amplitudes between frequency components 180–210 bp (“stable,” green curve) and 150–180 bp (“baseline,” red curve). B, Boxplot of mean phased-nucleosome distance in 17,946 gene bodies per ctDNA sample for ARPC and NEPC PDX lines. Two-tailed Mann–Whitney U test P value is shown. C, Comparison of the mean phased-nucleosome distance and the mean CCP score (estimated from RNA-seq) for 16 ARPC and 6 NEPC PDX lines. D, Boxplot of NPS in gene bodies of 47 phenotype-defining genes (35 NE-regulated and 12 AR-regulated) between ARPC and NEPC lines. Two-tailed Mann–Whitney U test P values are shown. E, Volcano plot of NPS log2 fold change (ARPC/NEPC) in the 47 phenotype-defining genes. Genes with significantly higher NPS scores (solid-colored dots; two-tailed Mann–Whitney U test, Benjamini–Hochberg adjusted FDR at P < 0.05) and nonsignificant genes (open circle) are shown. F, Hierarchical clustering of the normalized composite central mean coverage at TFBSs from the Griffin analysis of ctDNA for 108 TFs in LuCaP PDX lines of ARPC (n = 16), NEPC (n = 6), and ARLPC (n = 2) phenotypes. This list of TFs was initially selected as having differential expression between ARPC and NEPC from LuCaP PDX RNA-seq analysis. Heat map colors indicate increased accessibility (low values; yellow, orange, red) and decreased accessibility (higher values; black) in ctDNA. TFs with increased accessibility in NEPC samples (log2 fold change > 0.05, Mann–Whitney U test P < 0.05) are indicated with red bars; increased accessibility in ARPC (log2 fold change < −0.05, P < 0.05) are indicated with blue bars. Text color indicates relative expression between ARPC and NEPC PDX tumors by RNA-seq shown for TFs with significant differential accessibility.
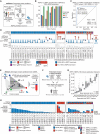
Figure 4. Comprehensive evaluation of ctDNA features throughout the genome for CRPC phenotype classification in PDX models. A, Volcano plot of log2 fold change of ATAC-seq peak intensity between 5 ARPC and 5 NEPC lines; the dotted line demarcates sites by q-value < 0.05. B and C, Composite coverage profiles at open chromatin sites specific to ARPC (B) and NEPC (C) PDX tumors analyzed by Griffin. Sites from A were filtered for overlap with known TFBSs in 338 factors from GTRD (70). Coverage profile means (lines) and 95% confidence interval with 1,000 bootstraps (shading) are shown. The region ±150 bp is indicated with a vertical dotted line and yellow shading. D, PCAs of ctDNA features demonstrates grouping between ARPC and NEPC phenotypes: (left) composite central coverage of TFBSs significant for 74 TFs with differential accessibility out of 338 factors between ARPC and NEPC (Supplementary Table S4). Center, NPS in the gene bodies of the 47 phenotype-defining genes. Right, Fragment size variability (CV) at H3K4me1 histone modification sites (n = 9,750). E, Performance of classifying ARPC vs. NEPC PDX from ctDNA using supervised machine learning (XGBoost) in various region types (all genes, TFBSs, and open regions; Methods). Area under the ROC curve (AUC) with 95% confidence interval (100 repeats of stratified cross-validation) is shown for the performance of all feature types.
Figure 4.
Comprehensive evaluation of ctDNA features throughout the genome for CRPC phenotype classification in PDX models. A, Volcano plot of log2 fold change of ATAC-seq peak intensity between 5 ARPC and 5 NEPC lines; the dotted line demarcates sites by q-value < 0.05. B and C, Composite coverage profiles at open chromatin sites specific to ARPC (B) and NEPC (C) PDX tumors analyzed by Griffin. Sites from A were filtered for overlap with known TFBSs in 338 factors from GTRD (71). Coverage profile means (lines) and 95% confidence interval with 1,000 bootstraps (shading) are shown. The region ±150 bp is indicated with a vertical dotted line and yellow shading. D, PCAs of ctDNA features demonstrates grouping between ARPC and NEPC phenotypes. Left, composite central coverage of TFBSs significant for 74 TFs with differential accessibility out of 338 factors between ARPC and NEPC (Supplementary Table S4). Center, NPS in the gene bodies of the 47 phenotype-defining genes. Right, fragment size variability (CV) at H3K4me1 histone modification sites (n = 9,750). E, Performance of classifying ARPC vs. NEPC PDX from ctDNA using supervised machine learning (XGBoost) in various region types (all genes, TFBSs, and open regions; Methods). Area under the ROC curve (AUC) with 95% confidence interval (100 repeats of stratified cross-validation) is shown for the performance of all feature types.
Figure 5. Accurate classification and estimation of prostate cancer in patient plasma samples. A, Schematic illustration of the ctdPheno classification method. Griffin-derived features and ichorCNA tumor fraction estimates from patient plasma samples are combined in a probabilistic framework informed by PDX models to predict the presence of NEPC. B, Performance for classification on admixtures samples using ctdPheno. Five ctDNA admixtures were generated for each phenotype from PDX lines, each at various sequencing coverages and tumor fractions. In total, 125 admixtures were evaluated. The mean AUC across the 5 admixtures is shown for each configuration. C, ROC curve for 101 mCRPC patients (DFCI cohort I) with ultra-low-pass WGS (ULP-WGS) data. The optimal performance of 90.4% sensitivity (for predicting NEPC) and 97.5% specificity (for predicting ARPC) corresponding to a prediction score cutoff of 0.3314 is indicated with horizontal and vertical dotted lines, respectively. D, Prediction scores from ctdPheno for 47 ULP-WGS plasma samples with clinical phenotypes comprising 26 ARPC (blue), 5 NEPC (red), and 16 mixed or ambiguous phenotypes (purple, triangles), including DNPC (gray). The 0.3314 score cutoff threshold (dotted line) was used for classifying NEPC and ARPC. Tumor fractions were estimated by ichorCNA from WGS data. E, Schematic illustration of the Keraon mixture estimation method. Griffin-derived features from PDX lines and healthy donors define a known feature space, which is transformed based on Griffin features and ichorCNA tumor fraction estimates for each patient plasma sample. Based on the patient's location in the transformed phenotype space, fractions of each phenotype are inferred directly. F, Illustration of mixture simulations. Five ARPC and five NEPC PDX samples were combined in the ratios shown with a single healthy donor at the tumor fractions shown, for a total of 810 mixed-phenotype samples at 25× for evaluating mixture proportions with Keraon. G, Boxplot of predicted total NEPC fraction in 810 simulated mixed-phenotype samples using Keraon, Pearson's r = 0.884. Median absolute error (MAE) was computed as the median absolute difference between estimated and expected NEPC fraction across all samples. H, Fractional phenotype estimates for 47 WGS plasma samples with clinical phenotypes comprising 26 ARPC (blue), 5 NEPC (red), and 16 mixed or ambiguous phenotypes (purple, triangles), including DNPC; gray). The 2.8% NEPC fraction threshold indicates the predicted presence of NEPC (dotted line).
Figure 5.
Accurate classification and estimation of prostate cancer in patient plasma samples. A, Schematic illustration of the ctdPheno classification method. Griffin-derived features and ichorCNA tumor fraction estimates from patient plasma samples are combined in a probabilistic framework informed by PDX models to predict the presence of NEPC. B, Performance for classification on admixtures samples using ctdPheno. Five ctDNA admixtures were generated for each phenotype from PDX lines, each at various sequencing coverages and tumor fractions. In total, 125 admixtures were evaluated. The mean AUC across the 5 admixtures is shown for each configuration. C, ROC curve for 101 patients with mCRPC (DFCI cohort I) with ULP-WGS data. The optimal performance of 90.4% sensitivity (for predicting NEPC) and 97.5% specificity (for predicting ARPC) corresponding to a prediction score cutoff of 0.3314 is indicated with horizontal and vertical dotted lines, respectively. D, Prediction scores from ctdPheno for 47 ULP-WGS plasma samples with clinical phenotypes comprising 26 ARPC (blue), 5 NEPC (red), and 16 mixed or ambiguous phenotypes (purple, triangles), including DNPC (gray). The 0.3314 score cutoff threshold (dotted line) was used for classifying NEPC and ARPC. Tumor fractions were estimated by ichorCNA from WGS data. E, Schematic illustration of the Keraon mixture estimation method. Griffin-derived features from PDX lines and healthy donors define a known feature space, which is transformed based on Griffin features and ichorCNA tumor fraction estimates for each patient plasma sample. Based on the patient's location in the transformed phenotype space, fractions of each phenotype are inferred directly. F, Illustration of mixture simulations. Five ARPC and five NEPC PDX samples were combined in the ratios shown with a single healthy donor at the tumor fractions shown, for a total of 810 mixed-phenotype samples at 25× for evaluating mixture proportions with Keraon. G, Boxplot of predicted total NEPC fraction in 810 simulated mixed-phenotype samples using Keraon, Pearson r = 0.884. MAE was computed as the median absolute difference between estimated and expected NEPC fraction across all samples. H, Fractional phenotype estimates for 47 WGS plasma samples with clinical phenotypes comprising 26 ARPC (blue), 5 NEPC (red), and 16 mixed or ambiguous phenotypes (purple, triangles), including DNPC; gray). The 2.8% NEPC fraction threshold indicates the predicted presence of NEPC (dotted line).

Comment in

References

    1. Karantanos T, Corn PG, Thompson TC. Prostate cancer progression after androgen deprivation therapy: mechanisms of castrate resistance and novel therapeutic approaches. Oncogene 2013;32:5501–11. - PMC - PubMed
    1. Ryan CJ, Smith MR, de Bono JS, Molina A, Logothetis CJ, de Souza P, et al. . Abiraterone in metastatic prostate cancer without previous chemotherapy. N Engl J Med 2013;368:138–48. - PMC - PubMed
    1. Scher HI, Fizazi K, Saad F, Taplin M-E, Sternberg CN, Miller K, et al. . Increased survival with enzalutamide in prostate cancer after chemotherapy. Cabot RC, Harris NL, Rosenberg ES, Shepard J-AO, Cort AM, Ebeling SH, et al.., editors. N Engl J Med 2012;367:1187–97. - PubMed
    1. Beltran H, Prandi D, Mosquera JM, Benelli M, Puca L, Cyrta J, et al. . Divergent clonal evolution of castration-resistant neuroendocrine prostate cancer. Nat Med 2016;22:298–305. - PMC - PubMed
    1. Bluemn EG, Coleman IM, Lucas JM, Coleman RT, Hernandez-Lopez S, Tharakan R, et al. . Androgen receptor pathway-independent prostate cancer is sustained through FGF signaling. Cancer Cell 2017;32:474–89. - PMC - PubMed

Publication types