. 2023 Mar 14;7(5):778-799.
doi: 10.1182/bloodadvances.2022008834.

Transcriptional reprogramming of infiltrating neutrophils drives lung pathology in severe COVID-19 despite low viral load

Affiliations

Transcriptional reprogramming of infiltrating neutrophils drives lung pathology in severe COVID-19 despite low viral load

Devon J Eddins et al. Blood Adv. .

Abstract

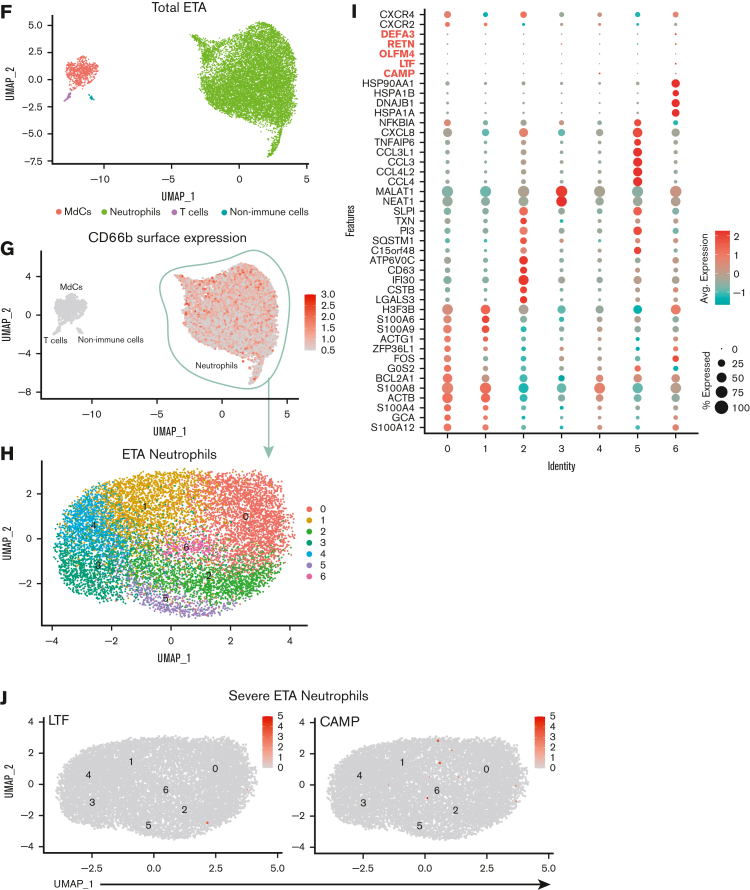
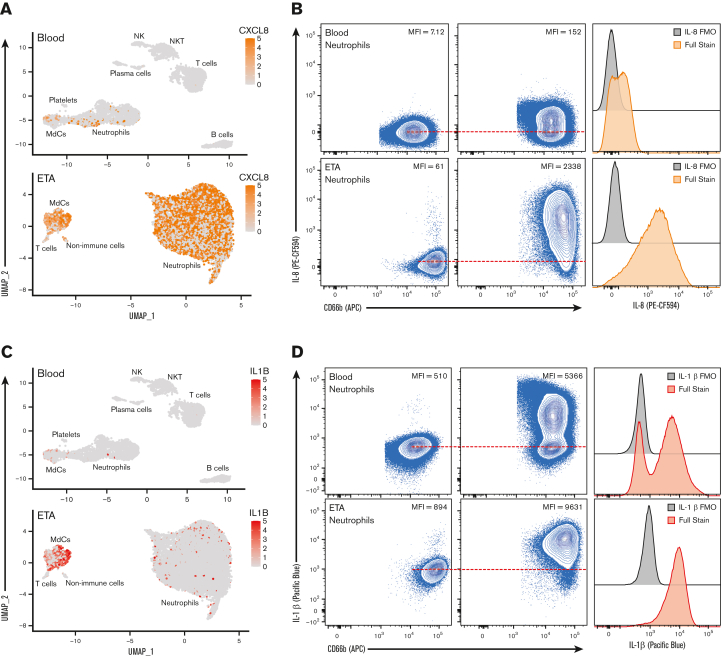
Troubling disparities in COVID-19-associated mortality emerged early, with nearly 70% of deaths confined to Black/African American (AA) patients in some areas. However, targeted studies on this vulnerable population are scarce. Here, we applied multiomics single-cell analyses of immune profiles from matching airways and blood samples of Black/AA patients during acute SARS-CoV-2 infection. Transcriptional reprogramming of infiltrating IFITM2+/S100A12+ mature neutrophils, likely recruited via the IL-8/CXCR2 axis, leads to persistent and self-sustaining pulmonary neutrophilia with advanced features of acute respiratory distress syndrome (ARDS) despite low viral load in the airways. In addition, exacerbated neutrophil production of IL-8, IL-1β, IL-6, and CCL3/4, along with elevated levels of neutrophil elastase and myeloperoxidase, were the hallmarks of transcriptionally active and pathogenic airway neutrophilia. Although our analysis was limited to Black/AA patients and was not designed as a comparative study across different ethnicities, we present an unprecedented in-depth analysis of the immunopathology that leads to acute respiratory distress syndrome in a well-defined patient population disproportionally affected by severe COVID-19.


Conflict of interest statement

Conflict-of-interest disclosure: F.E.L. is the founder of MicroB-plex, Inc.; serves on the SAB of Be Biopharma Inc.; receives grants from BMGF and Genentech; and receives royalties from BLI, Inc. C.M., D.Y.O., and X.P. are employees of Genentech Inc. D.Y.O. and C.M. own Roche stocks. The remaining authors declare no competing financial interests.

The current affiliation for R.P.R. is Division of Pulmonary, Department of Medicine, Allergy and Critical Care Medicine, University of Pittsburgh School of Medicine, Pittsburgh, PA.

Figures

None
Graphical abstract
Figure 1.
Figure 1.
Experimental design for the systems immunology approach (integrated multiomics single-cell assays) to study patients with COVID-19 and identify robust neutrophilia in the lungs. (A) Respiratory samples (sputum or endotracheal aspirates) and matching blood from all subjects were collected for 21-plex Mesoscale analysis, high-dimensional (Hi-D) 30-parameter flow cytometry, and multiomics scRNA-seq. Cells from endotracheal aspirates (ETA) and blood of patients with severe COVID-19 along with blood from healthy individuals were surface-stained with a panel of 89 oligo-conjugated monoclonal antibodies before single-cell encapsulation, and analyses were performed with a custom human reference genome that included the SARS-CoV-2 genome to simultaneously detect viral mRNA transcripts. Integrative multiomics analyses were performed on the resulting datasets. (B) Box plots showing the distribution of leukocytes isolated from endotracheal aspirates (ETA). (C) Box plots showing the distribution of leukocytes isolated from the whole blood of severe patients. For comparisons across the 3 patient groups (ie, healthy, MA, and severe), ordinary one-way ANOVA (if equal variance) or Brown-Forsythe and Welch ANOVA (if unequal variance) tests were performed for data with a normal distribution. Data with a lognormal distribution were analyzed using the Kruskal-Wallis test.
Figure 2.
Figure 2.
Multiomic single-cell RNA-seq reveals emergency granulopoiesis in the circulation and abundant heterogeneous populations of mature neutrophils in the airways with distinct inflammatory states. UMAP visualization of the scRNA-seq of total integrated blood (A) and endotracheal aspirate (ETA) (F) cells. Neutrophils were identified based on cell surface markers (B and G), and total neutrophils were subclustered for further analysis (C and H). Dot plots of the intersection of the top differentially expressed genes in neutrophil clusters (D and I) sorted by the average log-fold change for blood (D) and lung (I) neutrophils. UMAP visualization of signature genes of immature neutrophils (highlighted in D and I) in blood from severe patients compared with healthy individuals (C) and lungs of severe patients (J).
Figure 2.
Figure 2.
Multiomic single-cell RNA-seq reveals emergency granulopoiesis in the circulation and abundant heterogeneous populations of mature neutrophils in the airways with distinct inflammatory states. UMAP visualization of the scRNA-seq of total integrated blood (A) and endotracheal aspirate (ETA) (F) cells. Neutrophils were identified based on cell surface markers (B and G), and total neutrophils were subclustered for further analysis (C and H). Dot plots of the intersection of the top differentially expressed genes in neutrophil clusters (D and I) sorted by the average log-fold change for blood (D) and lung (I) neutrophils. UMAP visualization of signature genes of immature neutrophils (highlighted in D and I) in blood from severe patients compared with healthy individuals (C) and lungs of severe patients (J).
Figure 3.
Figure 3.
Mature neutrophils are continuously recruited from circulation and progress toward a hyperinflammatory state. Cell receptor-ligand pair analysis (CellChat29) from scRNA-seq data identify significant CXCL signaling pathway network enrichment between lung cells and blood neutrophils (A and B). Blood neutrophil cluster 2 represents the main subset potentially recruited to the lungs (A). Recruitment of blood cluster 2 and blood cluster 1 (A and C) is largely orchestrated by the CXCL8 (IL-8)/CXCR2 axis, and to a lesser extent, by CXCL2 and CXCL3 (B and D). S100A11/12, IFITM2, and CXCR2 mark a cluster of mature neutrophils in the blood (C) that likely represents the neutrophil subset recruited to the lung (D). Cell trajectory analysis (scVelo31) identifies 2 potential pathways (Trajectories 1 and 2) for recently migrated neutrophils (E), beginning with a gene signature consistent with neutrophil blood cluster 2 (C and F). Neutrophils recruited to the lung acquire a hyperinflammatory profile along Trajectory 2 (E and F), characterized by high expression of ISG IFI30 along with macrophage inflammatory proteins CCL3 (MIP-1α) and CCL4 (MIP-1β), whereas CSF3R and CXCR4 are increased in cells along both trajectories (F). Neutrophils along Trajectory 1 may reflect cells progressing to apoptosis, expressing higher levels of HSPA1A (HSP70) followed by NEAT1 (F). Pathway and process enrichment analyses performed in Metascape reveals that myeloid-mediated immunity and platelet activation, signaling, and aggregation are significantly enriched in neutrophils in the lungs of severe patients (G).
Figure 3.
Figure 3.
Mature neutrophils are continuously recruited from circulation and progress toward a hyperinflammatory state. Cell receptor-ligand pair analysis (CellChat29) from scRNA-seq data identify significant CXCL signaling pathway network enrichment between lung cells and blood neutrophils (A and B). Blood neutrophil cluster 2 represents the main subset potentially recruited to the lungs (A). Recruitment of blood cluster 2 and blood cluster 1 (A and C) is largely orchestrated by the CXCL8 (IL-8)/CXCR2 axis, and to a lesser extent, by CXCL2 and CXCL3 (B and D). S100A11/12, IFITM2, and CXCR2 mark a cluster of mature neutrophils in the blood (C) that likely represents the neutrophil subset recruited to the lung (D). Cell trajectory analysis (scVelo31) identifies 2 potential pathways (Trajectories 1 and 2) for recently migrated neutrophils (E), beginning with a gene signature consistent with neutrophil blood cluster 2 (C and F). Neutrophils recruited to the lung acquire a hyperinflammatory profile along Trajectory 2 (E and F), characterized by high expression of ISG IFI30 along with macrophage inflammatory proteins CCL3 (MIP-1α) and CCL4 (MIP-1β), whereas CSF3R and CXCR4 are increased in cells along both trajectories (F). Neutrophils along Trajectory 1 may reflect cells progressing to apoptosis, expressing higher levels of HSPA1A (HSP70) followed by NEAT1 (F). Pathway and process enrichment analyses performed in Metascape reveals that myeloid-mediated immunity and platelet activation, signaling, and aggregation are significantly enriched in neutrophils in the lungs of severe patients (G).
Figure 4.
Figure 4.
TNF- and IL-1β drive inflammatory reprogramming in neutrophils recruited to the lungs. (A) Dot plots showing 37 of the 67 differentially expressed genes in lung neutrophils vs blood neutrophil cluster 2 sorted by the average log-fold change used as an input for NicheNet analyses (B). NicheNet analysis identified the highest prioritized ligands (top 15), ordered by ligand activity (y-axis), that best predict the pulmonary neutrophil gene signature (x-axis). The predicted target genes represent the pulmonary neutrophil gene signature identified by DGE analysis between blood neutrophils from cluster 2 and ETA neutrophils. (C) Dot plots of the intersection of the top 15 expressed prioritized ligands from all the cells in the ETA samples. (D) Ligand-receptor matrix of putative signaling mediators for the top 15 prioritized ligands identified in (A). (E) UMAP visualizations of TNF and IL1B transcripts in the total ETA, along with the expression of predicted signaling mediators in blood (middle) and ETA (bottom) neutrophils from severe patients.
Figure 4.
Figure 4.
TNF- and IL-1β drive inflammatory reprogramming in neutrophils recruited to the lungs. (A) Dot plots showing 37 of the 67 differentially expressed genes in lung neutrophils vs blood neutrophil cluster 2 sorted by the average log-fold change used as an input for NicheNet analyses (B). NicheNet analysis identified the highest prioritized ligands (top 15), ordered by ligand activity (y-axis), that best predict the pulmonary neutrophil gene signature (x-axis). The predicted target genes represent the pulmonary neutrophil gene signature identified by DGE analysis between blood neutrophils from cluster 2 and ETA neutrophils. (C) Dot plots of the intersection of the top 15 expressed prioritized ligands from all the cells in the ETA samples. (D) Ligand-receptor matrix of putative signaling mediators for the top 15 prioritized ligands identified in (A). (E) UMAP visualizations of TNF and IL1B transcripts in the total ETA, along with the expression of predicted signaling mediators in blood (middle) and ETA (bottom) neutrophils from severe patients.
Figure 5.
Figure 5.
Exacerbated neutrophilia in the airways and matching blood in patients with severe COVID-19. (A) Representative gating strategy for all samples (supplemental Figure 1 for full gating strategy). (B) Representative plots demonstrating the inflammatory profile of pulmonary neutrophils, including NE, CD184 (CXCR4), and intracellular staining of IL-6, IL-8, and IL-1β, including the full stain and FMO controls. (C) Representative histograms showing the median fluorescence intensity (MFI) of key markers in healthy blood (blue), severe blood (gray), and severe ETA (green) samples. (D) MFI of CD16 (FCγRIII), NE, and CD63 (LAMP-3) reveal a GRIM-like phenotype in neutrophils from paired blood (gray circles) and lung (green squares) samples.
Figure 6.
Figure 6.
Cytokine release syndrome is dominated by IL-8 and IL-1β with pronounced myeloperoxidase content and activity in the lung microenvironment. (A, C, E) UMAP visualizations, (B, D, F) Representative flow cytometric intracellular staining including the full stain and FMO controls in both blood and ETA neutrophils (CD66b+), and (G) Mesoscale protein concentration analyses (pg/mL) of CXCL8 (IL-8), IL1B, and IL6 in the plasma (gray circles) and respiratory supernatant (respiratory supernatant; green squares) in healthy control, MA, and patients with severe COVID-19. (H) Concentration (ng/mL) of MPO protein and MPO activity in plasma vs Resp. SNT. In (G, H), the black dotted line represents the median lower limit of detection for assays (supplemental Table 7). In (B, D, F) red dashed line indicates the MFI of neutrophils in the FMO control (value listed in the plot).
Figure 6.
Figure 6.
Cytokine release syndrome is dominated by IL-8 and IL-1β with pronounced myeloperoxidase content and activity in the lung microenvironment. (A, C, E) UMAP visualizations, (B, D, F) Representative flow cytometric intracellular staining including the full stain and FMO controls in both blood and ETA neutrophils (CD66b+), and (G) Mesoscale protein concentration analyses (pg/mL) of CXCL8 (IL-8), IL1B, and IL6 in the plasma (gray circles) and respiratory supernatant (respiratory supernatant; green squares) in healthy control, MA, and patients with severe COVID-19. (H) Concentration (ng/mL) of MPO protein and MPO activity in plasma vs Resp. SNT. In (G, H), the black dotted line represents the median lower limit of detection for assays (supplemental Table 7). In (B, D, F) red dashed line indicates the MFI of neutrophils in the FMO control (value listed in the plot).

References

    1. Van Dyke ME, Mendoza MCB, Li W, et al. Racial and ethnic disparities in COVID-19 incidence by age, sex, and period among persons aged <25 years - 16 U.S. Jurisdictions, January 1-December 31, 2020. MMWR Morb Mortal Wkly Rep. 2021;70(11):382–388. - PMC - PubMed
    1. Romano SD, Blackstock AJ, Taylor EV, et al. Trends in racial and ethnic disparities in COVID-19 hospitalizations, by Region - United States, March-December 2020. MMWR Morb Mortal Wkly Rep. 2021;70(15):560–565. - PMC - PubMed
    1. Lopez L, 3rd, Hart LH, 3rd, Katz MH. Racial and ethnic health disparities related to COVID-19. JAMA. 2021;325(8):719–720. - PubMed
    1. Fu J, Reid SA, French B, et al. Racial disparities in COVID-19 outcomes among black and white patients with cancer. JAMA Netw Open. 2022;5(3) - PMC - PubMed
    1. Liao M, Liu Y, Yuan J, et al. Single-cell landscape of bronchoalveolar immune cells in patients with COVID-19. Nat Med. 2020;26(6):842–844. - PubMed

Publication types