. 2022 Nov 16;8(46):eabo6764.
doi: 10.1126/sciadv.abo6764. Epub 2022 Nov 18.

Unified epigenomic, transcriptomic, proteomic, and metabolomic taxonomy of Alzheimer's disease progression and heterogeneity

Affiliations

Unified epigenomic, transcriptomic, proteomic, and metabolomic taxonomy of Alzheimer's disease progression and heterogeneity

Yasser Iturria-Medina et al. Sci Adv. .

Abstract

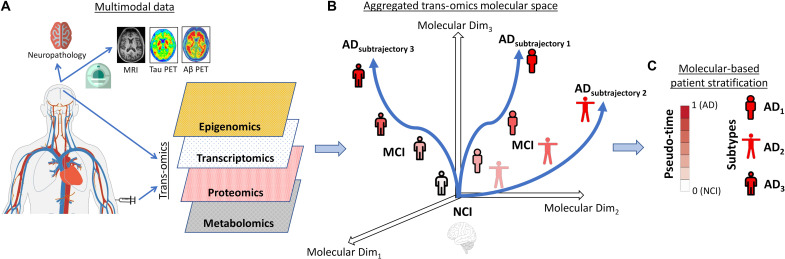
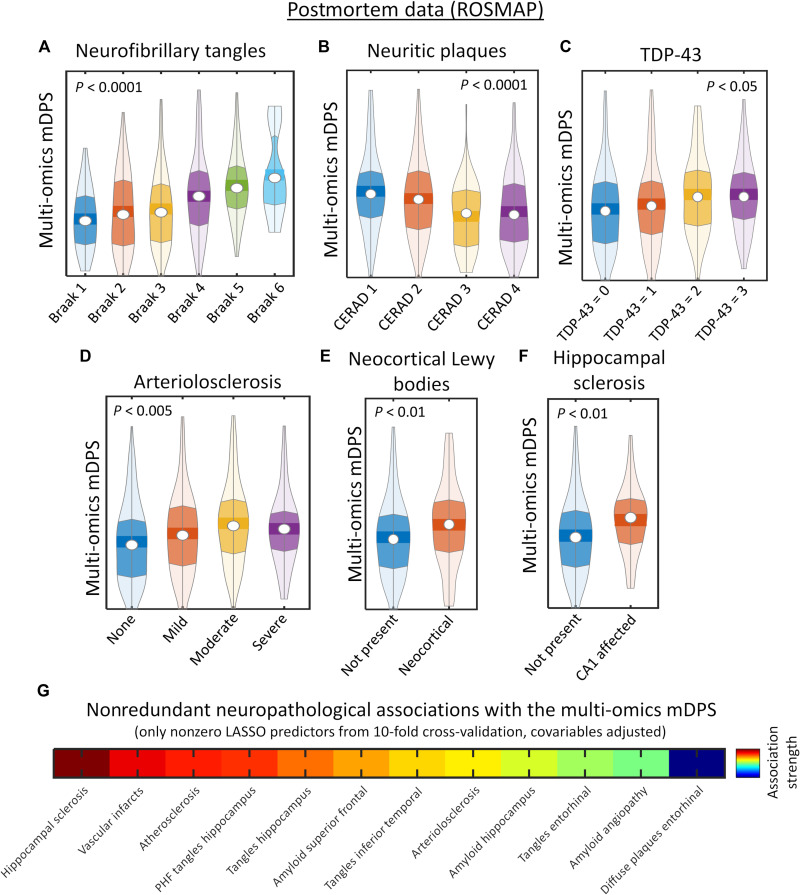
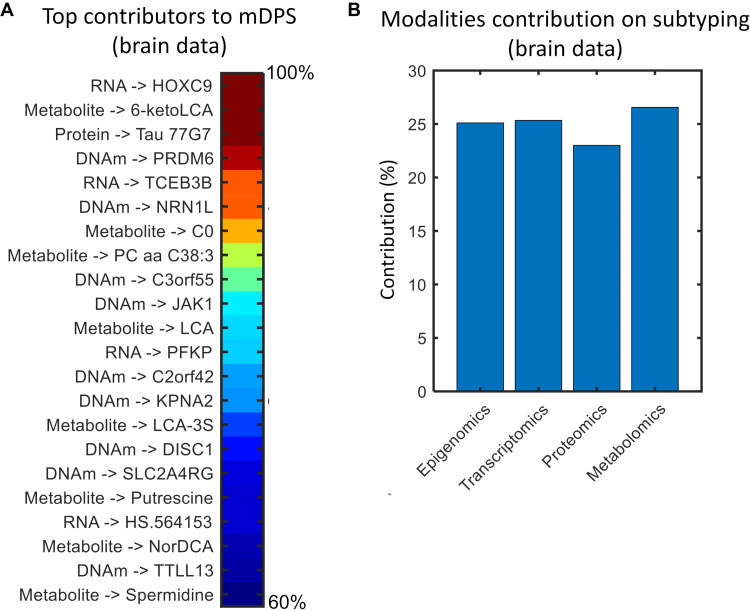
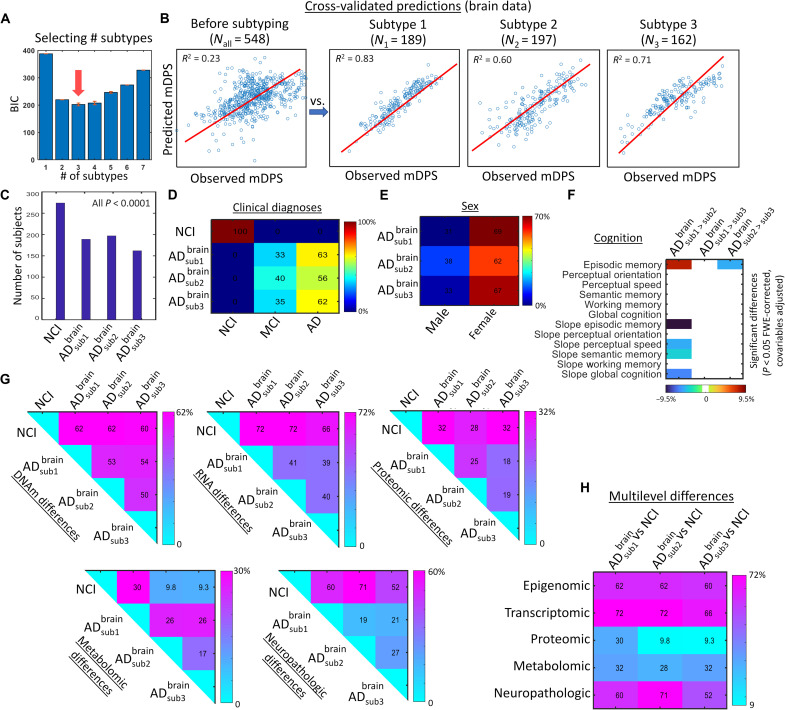
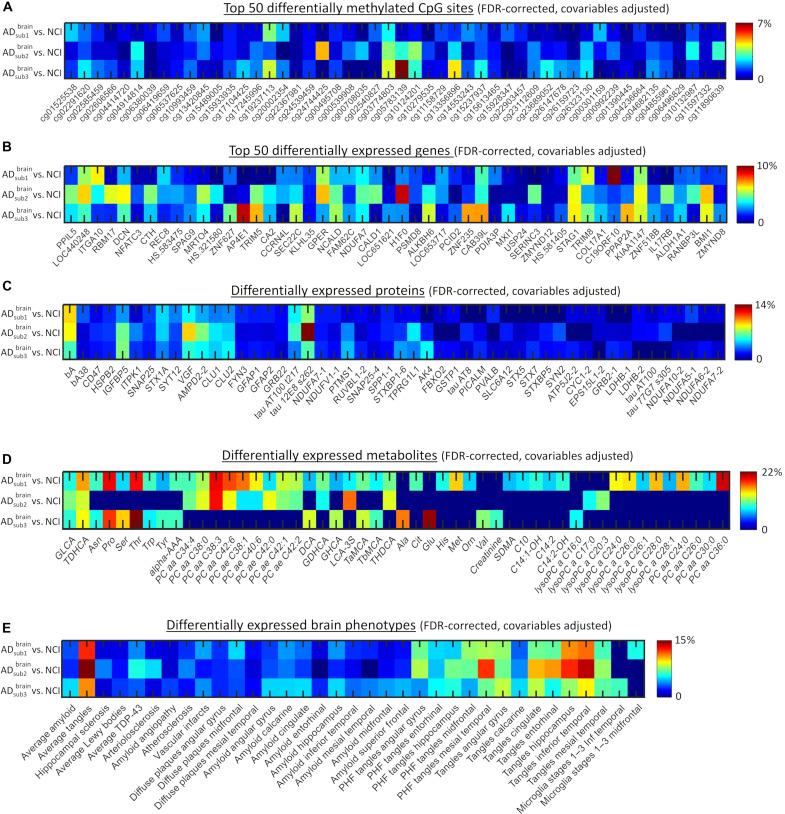
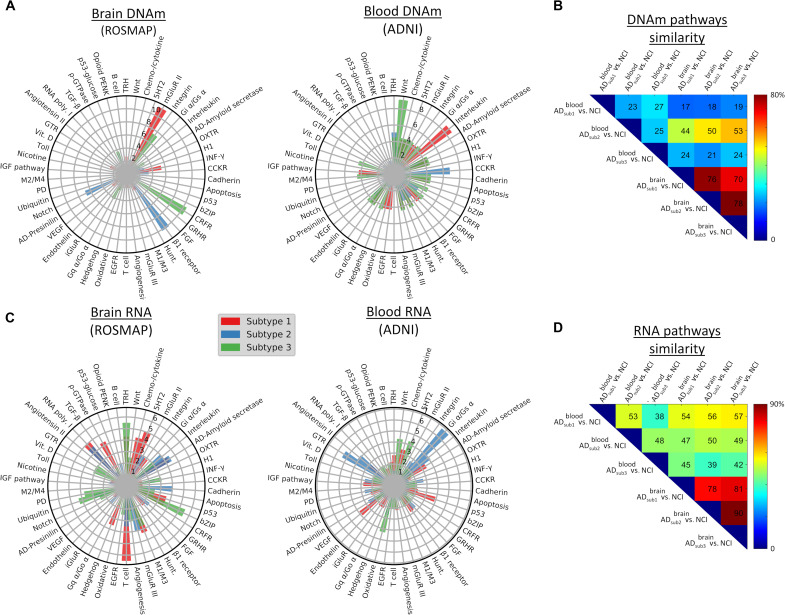
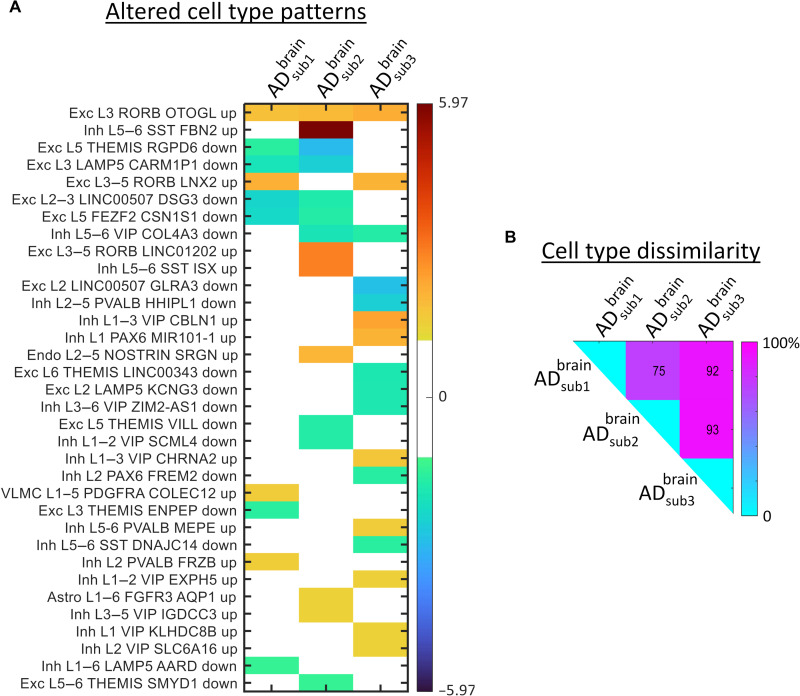
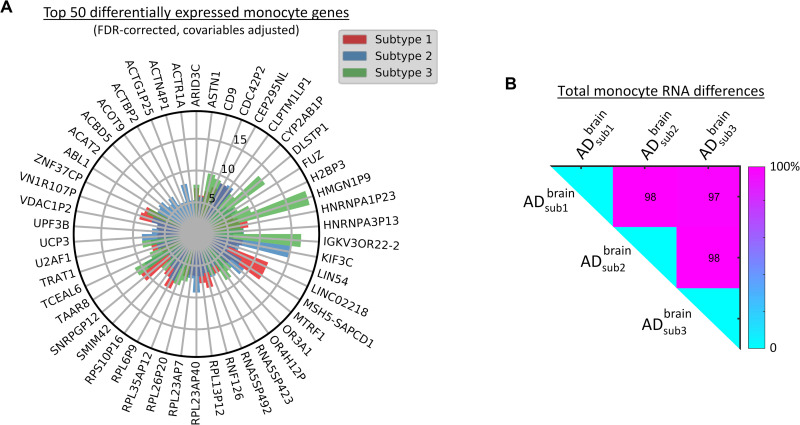
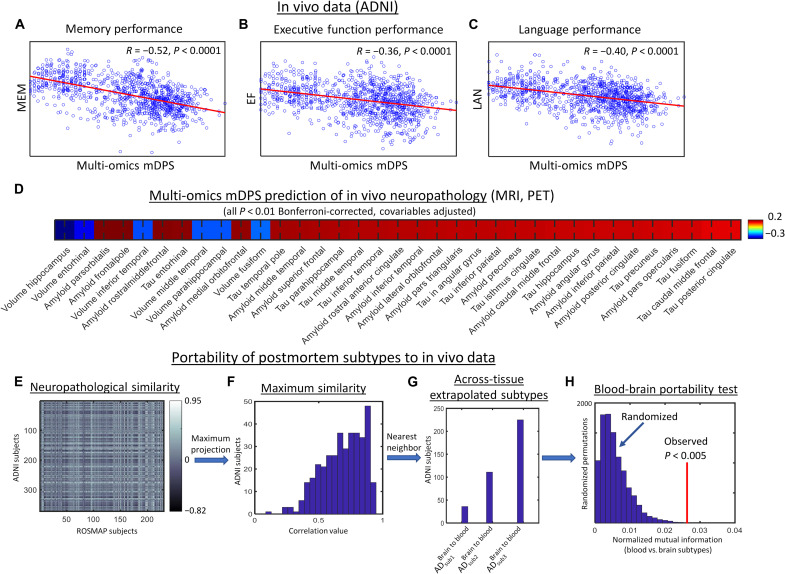
Alzheimer's disease (AD) is a heterogeneous disorder with abnormalities in multiple biological domains. In an advanced machine learning analysis of postmortem brain and in vivo blood multi-omics molecular data (N = 1863), we integrated epigenomic, transcriptomic, proteomic, and metabolomic profiles into a multilevel biological AD taxonomy. We obtained a personalized multilevel molecular index of AD dementia progression that predicts severity of neuropathologies, and identified three robust molecular-based subtypes that explain much of the pathologic and clinical heterogeneity of AD. These subtypes present distinct patterns of alteration in DNA methylation, RNA, proteins, and metabolites, identifiable in the brain and subsequently in blood. In addition, the genetic variations that predispose to the various AD subtypes in brain predict distinct spatial patterns of alteration in cell types, suggesting a unique influence of each putative AD variant on neuropathological mechanisms. These observations support that an individually tailored multi-omics molecular taxonomy of AD may represent distinct targets for preventive or treatment interventions.


Figures

Fig. 1.
Fig. 1.. Schematic approach for multi-omics molecular integration and patient stratification in the late-onset AD dementia spectrum.
(A) Postmortem brain (N = 822) and in vivo blood (N = 1041) tissues were obtained from previous studies (see the “Data”), including DNAm (from 420,132 to 865,918 CpG islands), RNAseq (about 48,000 transcripts), proteins (from 149 to 186 proteins), and metabolite concentrations (from 205 to 430). (B) Integrated multimodal molecular disease space, where subjects are stratified by the algorithm (in terms of advance on the path to develop AD dementia and subtrajectories) according to their position (see the “mcTI definition” and “Detailed mcTI algorithm” sections). (C) Two trans-omics molecular-based estimates are obtained for each participant, a pseudo-time or disease advance score (i.e., multi-omics mDPS) and the most likely molecular AD subtype (corresponding to a distinctive disease subtrajectory in the aggregated molecular space). The validity of this approach in providing a useful molecularly defined assessment and classification of the AD spectrum is subsequently explored in terms of capacity to reflect severity of neuropathologies and cell type alterations, as well as generalizability across different tissue samples (brain and blood).
Fig. 2.
Fig. 2.. Integrated multi-omics molecular predictions of progressive cognitive and neuropathological deterioration.
(A to F) Postmortem brain-based molecular disease progression predictions (ROSMAP data) of tau neurofibrillary tangles (A), neuritic plaques (B), TDP-43 cytoplasmatic inclusions in neurons and glia (C), arteriolosclerosis stages (D), presence of neocortical Lewy bodies (E), and hippocampal sclerosis (F). All P values are FWE-corrected via randomized permutation tests. (G) Nonredundant associations with neuropathological phenotypes (i.e., LASSO regression results, with 10-fold cross-validation, and adjusted by age, sex, and educational level).
Fig. 3.
Fig. 3.. Molecular omics contributions to AD stratification in postmortem brain tissue.
(A) Top influential epigenetic, transcriptomic, proteomic, and metabolomic markers during the process of AD trajectory inference. Values are percentages, normalized with regard to the maximum (only markers over the 99 percentile are shown; for an extended list, see table S2). (B) Modality-specific contributions (in percentages) to the identified AD subtypes. For technical details, see the “Assessing markers contributions on mDPS” and “Assessing omics contributions on subtyping” sections.
Fig. 4.
Fig. 4.. Three distinctive AD subtypes identified with multi-omics molecular data from the brain (ROSMAP).
(A) BIC values obtained for each considered number of putative subtypes. In statistics, the model with lowest BIC is preferred (here, three subtypes). For analyzing the stability of this selection, the subtyping was repeated 500 times via bootstrapping with replacement (presented BIC values correspond to the bootstrap average). Note that, across all bootstrap repetitions, the method always selected three as the optimum number of subtypes. (B) Cross-validation analysis for identification of the most compelling classification structure in terms of predictability of pathological advance (as quantified by the multi-omics mDPS). Note that the deconstruction of the whole population into smaller/stable subtypes brought a significant improvement in internal data homogeneity and multi-omics mDPS predictability. (C) Number of samples per subtype and corresponding significance obtained with randomization testing (all P < 0.001, few-corrected). (D and E) Subtype-specific clinical diagnoses and sex proportions, respectively. (F) Inter-subtype differences in cognitive domains and their rates of change over time [all P < 0.05, FWE-corrected, based on analysis of variance (ANOVA) tests with permutations]. Only significant differences are shown, with values corresponding to explained variance and signs reflecting direction (for slopes, a positive value would indicate stronger cognitive decline for the first specified subtype, while a negative value would indicate the contrary). (G and H) Total inter-subgroup molecular and neuropathological differences. For each omics data type and comparison with the control population, each matrix element corresponds to the percent of significantly different features (all q < 0.05, FDR-corrected, based on ANOVA tests with subtype as grouping variable; see the “Statistical analyses” section). For each AD subtype-subtype matrix element, the reported value represents the percent of data features that are abnormal for one subtype but not for the other (mismatch level).
Fig. 5.
Fig. 5.. Differentially expressed CpG sites, genes, proteins, metabolites, and brain phenotypes in brain-based AD subtypes.
(A to E) Only significantly expressed features are presented (q < 0.05, FDR-corrected). ANOVA tests with subtype as grouping variable were used (data were previously adjusted by age, sex, educational level, and experimental confounders; see the “mcTI definition” section). Color scale corresponds to the explained variance. For DNAm and RNA, only the top 50 most significant CpG sites and genes are presented (see table S3 for a complete list).
Fig. 6.
Fig. 6.. Top subtype-specific molecular pathways associated with differentially methylated or expressed genes.
(A and C) Radial plots for methylation- or RNA-based pathways, respectively. The radio represents the presence level (as a percentage) of pathways in each tissue-specific AD subtype. The full molecular pathway names are listed in table S4. (B and D) Molecular-based similarity (overlapping) across brain-based (ROSMAP) and blood-based (ADNI) AD subtypes. Each pairwise value was calculated as the percentage of common number of differentially expressed pathways relative to the total.
Fig. 7.
Fig. 7.. Altered cell type patterns in brain-based multimodal molecular AD subtypes.
(A) Significantly enriched cell types (q < 0.05, FDR-corrected) across the three brain-based AD subtypes (values correspond to enrichment z scores). Included cell types are excitatory neuron (Exc), inhibitory neuron (Inh), endothelial cell (Endo), vascular and leptomeningeal cell (VLMC), and astrocyte cell (Astro). Each cell entry includes the affected cortical layers (L), a broad marker gene, and a subclass-specific marker gene. (B) Subtype-subtype mismatch matrix (element i,j represents the percent of uncommon altered cell types among subtypes i and j).
Fig. 8.
Fig. 8.. Distinctively expressed genes in blood monocyte cells across putative AD subtypes (ROSMAP).
(A) Top 50 differentially expressed genes (all q < 0.05, FDR-corrected; for the complete list, see table S5). Results are based in ANOVA tests with subtype as grouping variable, adjusting by age, sex, and educational level. The radio represents the explained variance (as a percentage, covering the scale [0, 14%]). (B) Subtype-subtype mismatch matrix (element i,j represents the percent of uncommon altered monocyte genes among subtypes i and j).
Fig. 9.
Fig. 9.. Generalizability analysis of brain-based stratification to in vivo blood samples.
(A to D) Integrated blood-based multi-omics molecular predictions of cognitive performance (A to C) and neuropathological biomarkers (D) in ADNI subjects (N = 1041). (E) Neuropathological similarity between ROSMAP and ADNI subjects (based on 16 common brain regional amyloid and tau deposition measurements). (F) Maximum similarity projection for ADNI subjects (note that, on average, ADNI subjects strongly correlate with at least one ROSMAP subject). (G) Distribution of extrapolated brain-based AD subtypes from the postmortem population to the alive participants (i.e., from ROSMAP to ADNI). (H) Portability test comparing mutual information between the two independently obtained AD stratifications.

References

    1. Park J., Hescott B. J., Slonim D. K., Towards a more molecular taxonomy of disease. J. Biomed. Semantics 8, 25 (2017). - PMC - PubMed
    1. Wang B., Mezlini A. M., Demir F., Fiume M., Tu Z., Brudno M., Haibe-Kains B., Goldenberg A., Similarity network fusion for aggregating data types on a genomic scale. Nat. Methods 11, 333–337 (2014). - PubMed
    1. Collisson E. A., Bailey P., Chang D. K., Biankin A. V., Molecular subtypes of pancreatic cancer. Nat. Rev. Gastroenterol. Hepatol. 16, 207–220 (2019). - PubMed
    1. Hodes R. J., Buckholtz N., Accelerating medicines partnership: Alzheimer’s disease (AMP-AD) knowledge portal aids Alzheimer’s drug discovery through open data sharing. Expert Opin. Ther. Targets 20, 389–391 (2016). - PubMed
    1. Greenwood A. K., Montgomery K. S., Kauer N., Woo K. H., Leanza Z. J., Poehlman W. L., Gockley J., Sieberts S. K., Bradic L., Logsdon B. A., Peters M. A., Omberg L., Mangravite L. M., The AD knowledge portal: A repository for multi-omic data on Alzheimer’s disease and aging. Curr. Protoc. Hum. Genet. 108, e105 (2020). - PMC - PubMed