. 2022 Nov 16;8(46):eabo1673.
doi: 10.1126/sciadv.abo1673. Epub 2022 Nov 18.

Diabetic hyperglycemia promotes primary tumor progression through glycation-induced tumor extracellular matrix stiffening

Affiliations

Diabetic hyperglycemia promotes primary tumor progression through glycation-induced tumor extracellular matrix stiffening

Wenjun Wang et al. Sci Adv. .

Abstract

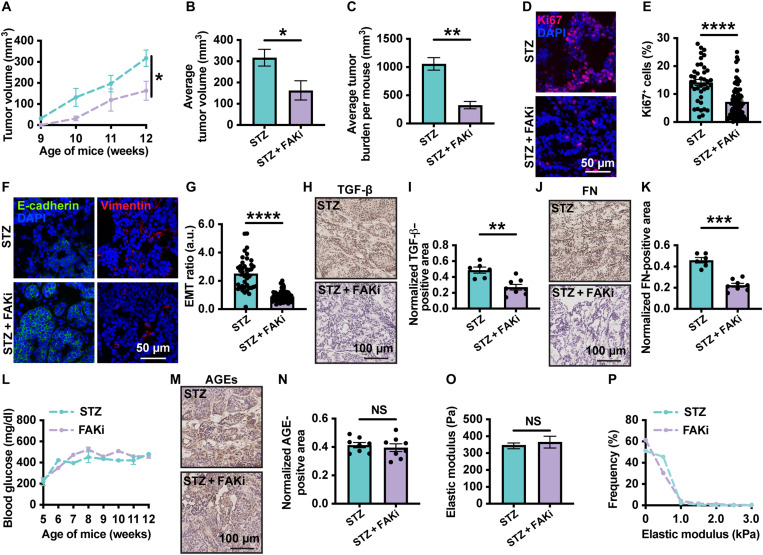
Diabetes mellitus is a complex metabolic disorder that is associated with an increased risk of breast cancer. Despite this correlation, the interplay between tumor progression and diabetes, particularly with regard to stiffening of the extracellular matrix, is still mechanistically unclear. Here, we established a murine model where hyperglycemia was induced before breast tumor development. Using the murine model, in vitro systems, and patient samples, we show that hyperglycemia increases tumor growth, extracellular matrix stiffness, glycation, and epithelial-mesenchymal transition of tumor cells. Upon inhibition of glycation or mechanotransduction in diabetic mice, these same metrics are reduced to levels comparable with nondiabetic tumors. Together, our study describes a novel biomechanical mechanism by which diabetic hyperglycemia promotes breast tumor progression via glycating the extracellular matrix. In addition, our work provides evidence that glycation inhibition is a potential adjuvant therapy for diabetic cancer patients due to the key role of matrix stiffening in both diseases.


Figures

Fig. 1.
Fig. 1.. Induction of diabetes mellitus within MMTV-PyMT mice.
(A) Schematic overview of the diabetic MMTV-PyMT mouse model. (B) Prefasting and (C) postfasting blood glucose levels of MMTV-PyMT mice injected once daily with five consecutive daily 70 mg/kg doses of either STZ or sodium citrate buffer vehicle control (Ctrl) or treated with both STZ and insulin (STZ + insulin). (D) Body weight tracking of MMTV-PyMT mice injected once with five consecutive daily 70 mg/kg doses of either sodium citrate (Ctrl) or STZ or double-treated with both STZ and insulin (STZ + insulin). (E) Glucose levels over time after insulin injection for Ctrl group and STZ group. (F) Glucose levels over time postglucose injection for Ctrl group and STZ group during glucose tolerance assay. (G) Representative images of immunohistochemical staining for insulin in the pancreases of MMTV-PyMT mice injected with either sodium citrate (Ctrl) or STZ. (H) Quantification of beta islet cell percentage in the control group or mice injected with STZ (Ctrl, N = 7; STZ, N = 5; STZ + insulin, N = 3). Data are presented as means ± SEM. ***P < 0.001 and ****P < 0.0001. NS, not significant.
Fig. 2.
Fig. 2.. Hyperglycemia promotes glycation and increases ECM stiffness.
(A) Representative images of tumor sections with IHC staining for AGEs collected from nondiabetic (Ctrl), diabetic (STZ), and diabetic mice treated with insulin (STZ + insulin). (B) Corresponding quantification of normalized AGE-positive area (Ctrl, N = 5 and n = 14; STZ, N = 4 and n = 17; STZ + insulin, N = 3 and n = 12). (C) Representative Western blot protein bands for AGEs and GAPDH in tumors from diabetic (STZ) and nondiabetic (Ctrl) mice. (D) Corresponding quantification of AGEs normalized by GAPDH (N = 4 and n = 6). (E) Quantification of collagen deposition of diabetic and nondiabetic tumors (N = 3 and n = 3; 30 measurements per condition). (F) Unconfined compression assay showing equilibrium modulus of tumors extracted from diabetic or nondiabetic mice (Ctrl, N = 4 and n = 6; STZ, N = 4 and n = 5; 20 measurements per condition). (G) Elastic modulus of nondiabetic (Ctrl), diabetic (STZ), and diabetic tumors treated with insulin (STZ + insulin) measured by AFM (N = 3 and n = 3; 250 to 300 measurement per condition). (H) Corresponding histogram of AFM measurements for nondiabetic (Ctrl), diabetic (STZ), and diabetic tumors treated with insulin (STZ + insulin). (I) Representative force map of tumors extracted from nondiabetic (Ctrl), diabetic (STZ), and diabetic mice treated with insulin (STZ + insulin). Data are presented as means ± SEM. *P < 0.05, ***P < 0.001, and ****P < 0.0001. a.u., arbitrary units.
Fig. 3.
Fig. 3.. Hyperglycemia increases tumor growth through promoting cell proliferation.
(A) Weekly average tumor volume measurements for nondiabetic (Ctrl), diabetic (STZ), and diabetic mice treated with insulin (STZ + insulin) from when tumors become palpable and large enough for caliper measurements (week 9) to study endpoint (Ctrl, N = 14; STZ, N = 12; STZ + insulin, N = 3). (B) Average tumor volume for control (Ctrl), diabetic (STZ), and diabetic mice treated with insulin (STZ + insulin) at study endpoint (Ctrl, N = 7 and n = 22; STZ, N = 13 and n = 75; STZ + insulin, N = 3 and n = 12). (C) Average tumor burden per mouse for control (Ctrl), diabetic (STZ), and diabetic mice treated with insulin (STZ + insulin) at study endpoint (Ctrl, N = 7; STZ, N = 22; STZ + insulin, N = 3). (D) Tumor differentiation grading of tumors extracted from control group and mice treated with STZ (N = 3 and n = 3). (E) Representative images showing Ki67 and nucleus colocalization within nondiabetic, diabetic (STZ), and diabetic tumors treated with insulin (STZ + insulin). (F) Corresponding quantification of the percentage of cells with Ki67+ nuclei (Ctrl, N = 7 = 3 and n = 3, 21 imaging fields; STZ, N = 4 and n = 6, 67 imaging fields; STZ + insulin, N = 3 and n = 8, 80 imaging fields included). Data are presented as means ± SEM. *P < 0.05, ***P < 0.001, and ****P < 0.0001. DAPI, 4′,6-diamidino-2-phenylindole.
Fig. 4.
Fig. 4.. Diabetes promotes EMT.
(A) Representative images of immunofluorescence staining showing E-cadherin and vimentin of tumors extracted from nondiabetic (STZ), diabetic (STZ), and diabetic tumors treated with insulin (STZ + insulin). (B) Corresponding expression ratio of E-cadherin and vimentin (Ctrl and STZ, N = 3 and n = 5, 37 fields per tumor section; STZ + insulin, N = 3 and n = 8; 80 fields per tumor section were imaged). (C) Representative images showing fibronectin (FN) expression within tumors extracted from nondiabetic (Ctrl), and diabetic tumors treated with (STZ + STZ) or without (STZ) insulin. (D) Corresponding quantification of fibronectin-positive area within tumors (Ctrl, N = 4 and n = 13; STZ, N = 5 and n = 17; STZ + insulin, N = 3 and n = 12). (E) Representative images of TGF-β–stained tumor sections extracted from control (Ctrl) or diabetic mice treated with (STZ + insulin) or without (STZ) insulin. (F) Corresponding quantification of TGF-β–positive area within tumors (Ctrl, N = 3 and n = 13; STZ, N = 5 and n = 15; STZ + insulin, N = 3 and n = 12). (G) Protein bands generated by Western blotting showing fibronectin and TGF-β expression within diabetic (STZ) and nondiabetic (Ctrl) tumors. GAPDH was used as the loading control. (H and I) Corresponding quantification of fibronectin (H) and TGF-β (I) expression normalized over GAPDH expression (N = 3 and n = 6). Data are presented as means ± SEM. *P < 0.05, **P < 0.01, and ****P < 0.0001.
Fig. 5.
Fig. 5.. Glycation inhibition decreases ECM stiffness.
(A) Schematic overview of glycation reaction showing how glycation inhibitors block this reaction. (B) Blood glucose of diabetic mice treated with or without glycation inhibitors (STZ, N = 12; STZ + AG, N = 10; STZ + ALT711, N = 12). (C) Corresponding quantification of normalized AGE-positive area (STZ, N = 4 and n = 8; STZ + AG, N = 3 and n = 7; STZ + ALT711, N = 4 and n = 7). (D) Representative images of tumor sections with IHC staining for AGEs collected from diabetic mice treated with AG or ALT711. (E) Quantification of collagen deposition of diabetic and nondiabetic tumors (STZ, N = 5 and n = 7; 349 measurements per condition; STZ + AG, N = 2 and n = 5; 126 measurements per condition; STZ + ALT711, N = 4 and n = 8; 284 measurements per condition). (F) Unconfined compression assay showing equilibrium modulus of tumors extracted from diabetic mice treated with glycation inhibitors, AG or ALT711 (STZ, N = 6 and n = 6, 40 measurements included; STZ + AG, N = 5 and n = 7, 20 measurements included; STZ + ALT711, N = 3 and n = 6, 20 measurements included). (G) Elastic modulus of diabetic tumors treated with or without glycation inhibitors measured by AFM (N = 3 and n = 3, 430 to 589 measurements per condition). (H) Corresponding histogram of AFM measurements of diabetic tumors treated with or without glycation inhibitors. Data are presented as means ± SEM. *P < 0.05 and ****P < 0.0001.
Fig. 6.
Fig. 6.. Glycation inhibition decreases primary tumor progression.
(A) Weekly tumor volume measurements for diabetic mice treated with AG or ALT711 from week 9 to study endpoint (N = 6 to 12). (B) Average tumor volume at study endpoint (N = 6 to 12). (C) Average tumor burden per mouse at study endpoint (N = 9 to 18). (D) Quantification of percentage of cells with Ki67+ nuclei (N = 3 to 5 and n = 3 to 8, 32 to 64 imaging fields). (E) Representative images showing cells with Ki67+ nuclei. (F) Comparison of proliferation of MET-1 cells with normal or decreased RAGE expression on substrates with 200- or 1000-Pa stiffness (N = 3 and n = 45). PLKO, pLKO.1 vector. (G) Quantification of proliferation of MET-1 cells embedded in collagen matrix (N = 3 and n = 45). (H) Representative images showing E-cadherin and vimentin of tumors. (I) Corresponding quantification of E-cadherin and vimentin expression ratio (N = 3 to 5 and n = 4 to 7, 25 to 64 fields). (J) Representative images of TGF-β–stained tumor sections. (K) Corresponding quantification of TGF-β–positive area within tumors (N = 3 to 4 and n = 7 to 8). (L) Corresponding quantification of fibronectin-positive area (N = 3 to 4 and n = 7 to 8). (M) Representative images showing fibronectin within tumors. Data are presented as means ± SEM. *P < 0.05, **P < 0.01, ***P < 0.001, and ****P < 0.0001.
Fig. 7.
Fig. 7.. FAK inhibition decreases tumor progression without influencing ECM stiffness.
(A) Weekly tumor volume measurements for diabetic mice treated with or without FAK inhibitor (N = 3). (B) Average tumor volume at study endpoint (N = 3 and n = 6 to 10). (C) Average tumor burden per mouse at the study endpoint (N = 3). (D) Representative images showing Ki67 and nucleus colocalization within tumors. (E) Quantification of percentage of cells with Ki67+ nuclei (N = 3 and n = 8, 40 to 80 imaging fields). (F) Representative images showing E-cadherin and vimentin of tumors. (G) Corresponding quantification of the expression ratio of E-cadherin and vimentin (N = 3 and n = 8, 40 to 80 imaging fields). (H) Representative images of TGF-β–stained tumor sections. (I) Corresponding quantification of TGF-β–positive area within tumors (N = 3 and n = 6 to 8). (J) Representative images showing fibronectin expression within tumors. (K) Corresponding quantification of fibronectin-positive area within tumors (N = 3 and n = 6 to 8). (L) Blood glucose of diabetic mice treated with or without FAKi (N = 3). (M) Representative images of tumor sections with IHC staining for AGEs. (N) Corresponding quantification of normalized AGE-positive area (N = 3 and n = 8). (O) Elastic modulus of diabetic tumors treated with or without FAKi (N = 3 and n = 4, 584 to 882 measurements). (P) Corresponding histogram of AFM measurements. Data are presented as means ± SEM. *P < 0.05, **P < 0.01, ***P < 0.001, and ****P < 0.0001.
Fig. 8.
Fig. 8.. Diabetes activates glycation, promotes cell proliferation, and shifts EMT within tumors from patients with breast cancer.
(A) Representative images of tumor sections with IHC staining for AGEs within tumors extracted from patients with breast cancer diagnosed with or without diabetes. (B) Corresponding quantification of normalized AGE-positive area (N = 4). (C) Elastic modulus of tumors from diabetic or nondiabetic patients measured by AFM (N = 4, 478 to 482 measurements per condition). (D) Corresponding histogram of AFM measurements of diabetic or nondiabetic tumors. (E) Representative images showing Ki67 and nucleus colocalization within tumors extracted from patients with breast cancer diagnosed with or without diabetes. (F) Quantification of the percentage of cells with Ki67+ nuclei (N = 4, 40 imaging fields included). (G) Representative images of immunofluorescence staining showing E-cadherin and vimentin of tumors extracted from diabetic or nondiabetic patients (N = 4, 40 imaging fields included). (H) Quantification of EMT ratio (N = 4, 40 imaging fields included). (I) Representative images of TGF-β–stained tumor sections extracted from diabetic and nondiabetic patients. (J) Corresponding quantification of TGF-β–positive area within tumors (N = 4). (K) Representative images showing fibronectin expression within tumors. (L) Corresponding quantification of fibronectin-positive area within tumors (N = 4). Data are presented as means ± SEM. *P < 0.05, **P < 0.01, and ****P < 0.0001.

References

    1. Abudawood M., Diabetes and cancer: A comprehensive review. J. Res. Med. Sci. 24, 94 (2019). - PMC - PubMed
    1. Habib S. L., Rojna M., Diabetes and risk of cancer. ISRN Oncol. 2013, 583786 (2013). - PMC - PubMed
    1. Giovannucci E., Harlan D. M., Archer M. C., Bergenstal R. M., Gapstur S. M., Habel L. A., Pollak M., Regensteiner J. G., Yee D., Diabetes and cancer: A consensus report. Diabetes Care 33, 1674–1685 (2010). - PMC - PubMed
    1. Ryu T. Y., Park J., Scherer P. E., Hyperglycemia as a risk factor for cancer progression. Diabetes Metab. J. 38, 330–336 (2014). - PMC - PubMed
    1. Ozer K., Horsanali M. O., Gorgel S. N., Ozbek E., Diabetes is an important risk factor for metastasis in non-muscle-invasive bladder cancer. Asian Pac. J. Cancer Prev. 17, 105–108 (2016). - PubMed