. 2022 Nov 18;17(11):e0277658.
doi: 10.1371/journal.pone.0277658. eCollection 2022.

Human pericytes degrade diverse α-synuclein aggregates

Affiliations

Human pericytes degrade diverse α-synuclein aggregates

Birger Victor Dieriks et al. PLoS One. .

Abstract

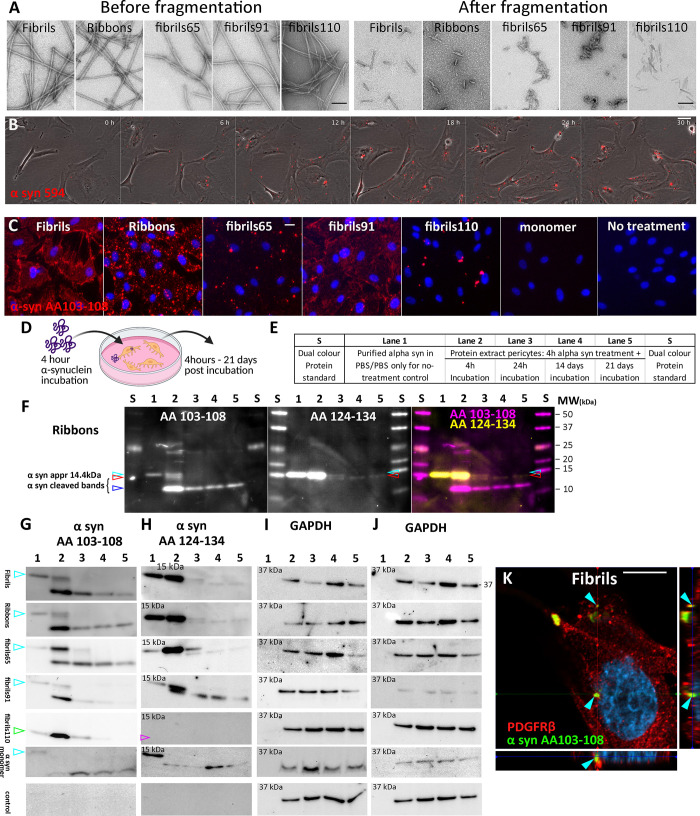
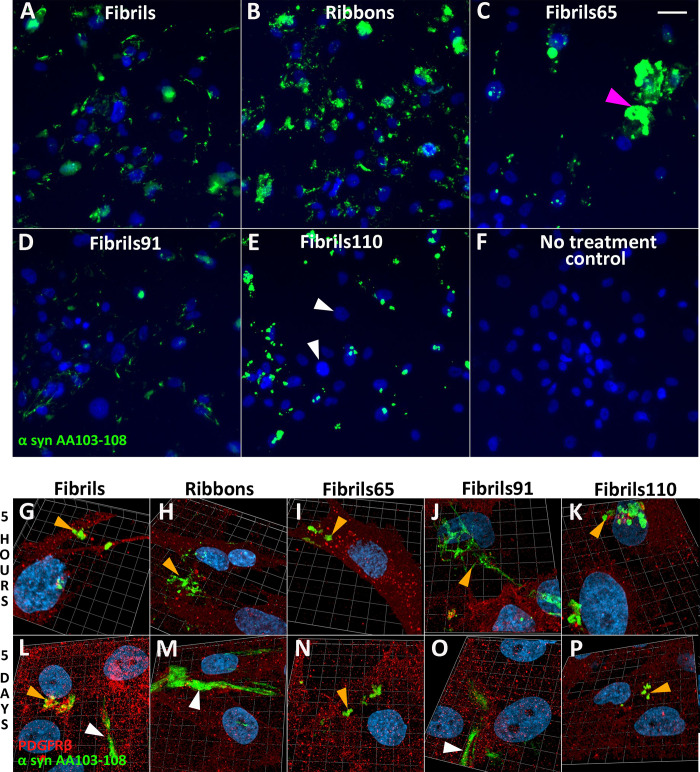
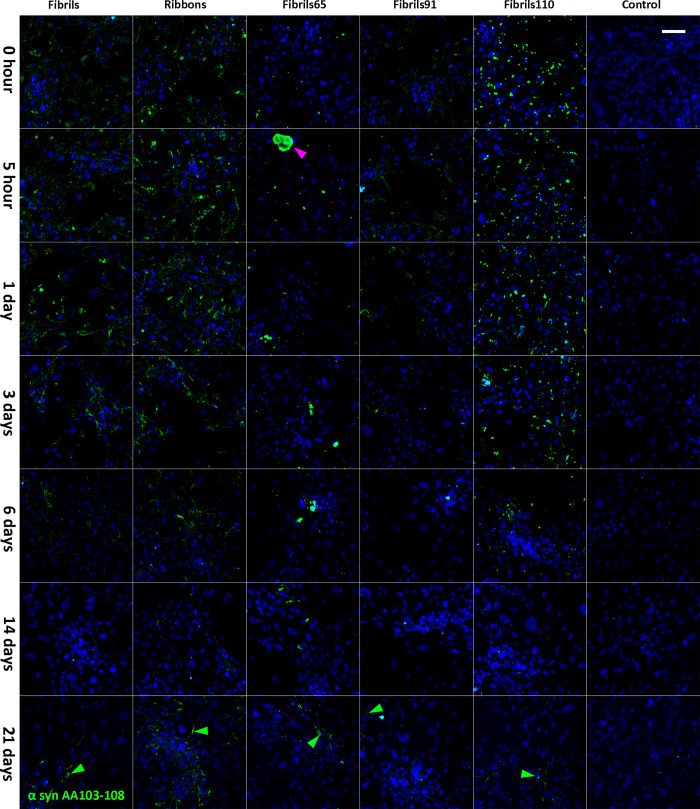
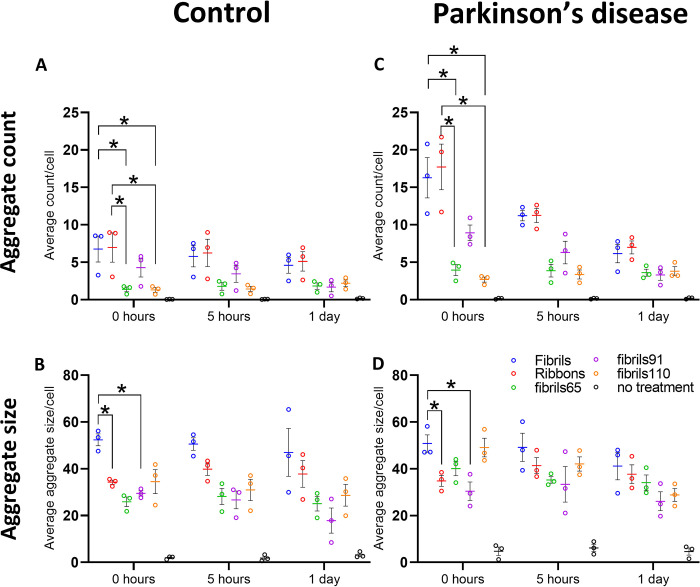
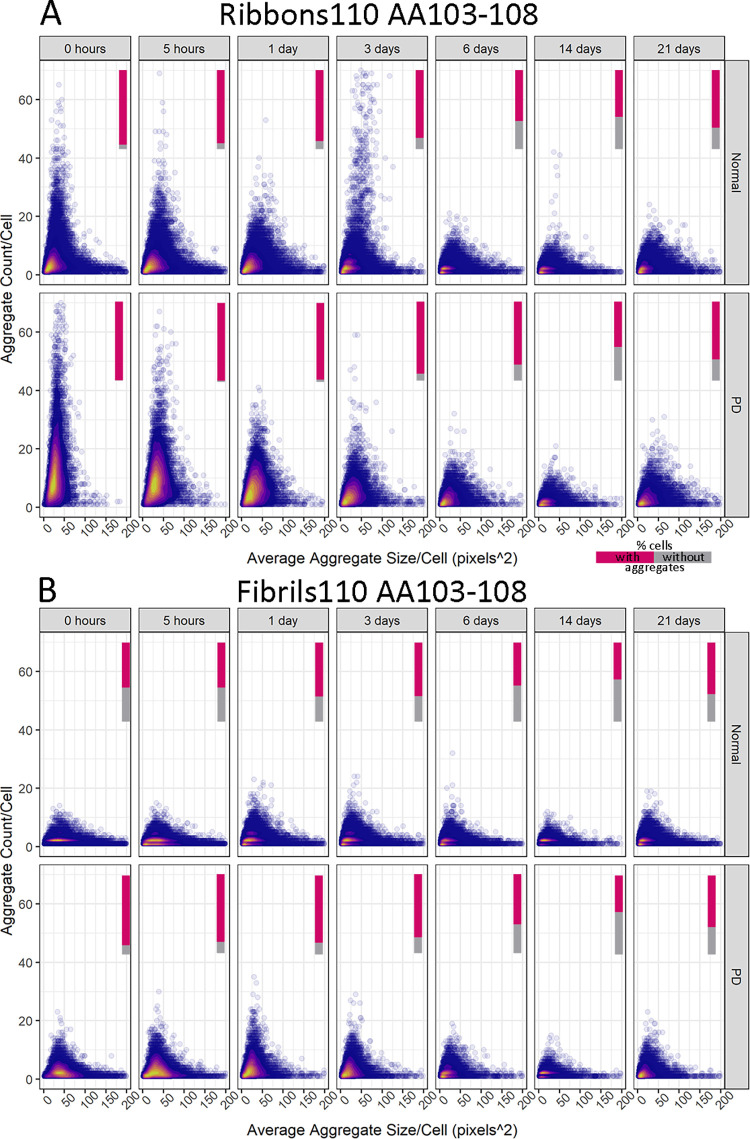
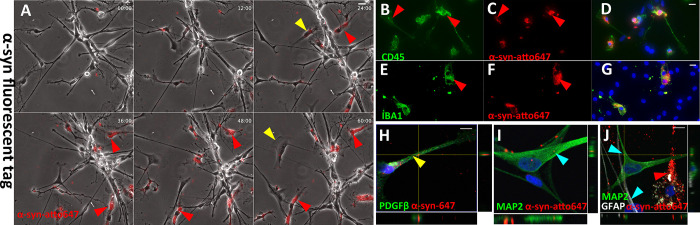
Parkinson's disease (PD) is a progressive, neurodegenerative disorder characterised by the abnormal accumulation of α-synuclein (α-syn) aggregates. Central to disease progression is the gradual spread of pathological α-syn. α-syn aggregation is closely linked to progressive neuron loss. As such, clearance of α-syn aggregates may slow the progression of PD and lead to less severe symptoms. Evidence is increasing that non-neuronal cells play a role in PD and other synucleinopathies such as Lewy body dementia and multiple system atrophy. Our previous work has shown that pericytes-vascular mural cells that regulate the blood-brain barrier-contain α-syn aggregates in human PD brains. Here, we demonstrate that pericytes efficiently internalise fibrillar α-syn irrespective of being in a monoculture or mixed neuronal cell culture. Pericytes cleave fibrillar α-syn aggregates (Fibrils, Ribbons, fibrils65, fibrils91 and fibrils110), with cleaved α-syn remaining present for up to 21 days. The number of α-syn aggregates/cell and average aggregate size depends on the type of strain, but differences disappear within 5 five hours of treatment. Our results highlight the role brain vasculature may play in reducing α-syn aggregate burden in PD.


Conflict of interest statement

The authors declare that there are no conflicts of interest.

Figures

Fig 1
Fig 1. Internalisation and degradation of α-syn strains in pericytes.
(A) Electron microscopy of α-syn strains before and after fragmentation. (B) Live cell imaging of fluorescently tagged α-syn for 30 hours. (C) Immunofluorescent labelling of α-syn strains after 30 min in control pericytes with α-syn epitope-specific antibody AA103-108. (D) Schematic representation of experimental setup. (E) Loading of western blots. Lane 1 only contains pure α-syn aggregate, whereas lane 2–5 shows α-syn isolated from pericytes. (F) Detailed fluorescent western blot with α-syn epitope-specific antibodies detecting Ribbons with α-syn antibody AA103-108 (magenta), AA124-134 (yellow) and merge showing overlap of α-syn bands. Various bands are identified indicating full length (14.4kDa, cyan arrow) and cleaved α-syn (red and blue arrows). α-syn detection on individual western blots for Fibrils, Ribbons, fibrils65, fibrils91, fibrils110 and no-treatment control (PBS) with α-syn epitope specific antibodies showing full length α-syn (cyan arrow) and cleaved α-syn fragments. Fibrils110 lacks a full-length band as aggregate is made up of C-term cleaved α-syn (green arrow). (G) AA 103–108, (H) AA124-134, and (H) GAPDH blot corresponds to blot shown in G after antibody stripping and relabelling. Full blots shown in S1 Raw images. Confocal image with orthogonal views showing pericyte with internalised α-syn Fibrils after 24 hours (cyan arrows, K). Scale bars represent 100 nm (A), 20 μm (B,C), 10 μm (K).
Fig 2
Fig 2. Immunofluorescent labelling of α-syn strains in control pericytes with α-syn epitope-specific antibodies AA103-108 (green).
Strains specific fluorescent staining 5 hours after pre-treatment with 100nM α-syn. At early time point, all cells contain aggregates, except for fibrils110 treated cells (white arrows); (A) Fibrils, (B) Ribbons, (C) fibrils65, with occasional larger aggregates (magenta arrow), (D) fibrils91, (E) fibrils110, (F) no treatment control. 3D confocal view of α-syn aggregates in pericytes 5 hours and 5 days after pre-treatment with 100nM (D, I) Fibrils, (E, J) Ribbons, (F, J) fibrils65, (G, K) fibrils91, (H, L) fibrils110. Typically aggregates appear as spots (orange arrows) with thicker fibres (white arrows) appearing more frequently at later time points. Scale bars represent 50 μm.
Fig 3
Fig 3. Immunofluorescent labelling of α-syn strains in pericytes with α-syn specific antibodies AA103-108 (green) after pre-treatment with 100nM Fibrils, Ribbons, fibrils65, fibrils91 and fibrils110.
Large aggregates were occasionally found for fibrils65 (magenta arrow). The scale bar represents 100 μm.
Fig 4
Fig 4. Strain-specific differences in control and PD-derived post-mortem pericytes.
(A-B) Average aggregate count/cell analysis and (C-D) average aggregate size/cell analysis based on AA103-108 for control pericytes (n = 3) and PD pericytes (n = 3). Two-way ANOVA was used with Tukey’s post hoc adjustment for multiple comparisons. An asterisk indicates significant differences in control and PD-derived post-mortem pericytes * (p<0.05).
Fig 5
Fig 5. Density plots showing a differential response to α-syn aggregates for control and PD-derived pericytes based on AA103-108 for Ribbons and fibrils 110.
Cells without aggregates are excluded from density plots. Relative amounts of cells with aggregates are represented in a bar (% cells with aggregates in magenta, % cells without aggregates in grey).
Fig 6
Fig 6. Primary human mixed neuronal cell exposed to α-syn aggregates—internalisation is cell type-specific.
(A) Representative images of live cell recording with α-syn-594 aggregates. (B-C) Confocal imaging indicates that α-syn-594 aggregates are present within neurons and pericytes. (E-I) Cells with high α-syn aggregate load are microglia CD45+ and IBA1+. Representative images of primary human mixed neuronal cell exposed to (J) Ribbons with (L-O) Ribbons within Astrocytes GFAP high, MAP2 low and (P-S) neurons GFAP low-MAP2 high.

References

    1. Villar-Piqué A, Lopes da Fonseca T, Outeiro TF. Structure, function and toxicity of alpha-synuclein: the Bermuda triangle in synucleinopathies. J Neurochem. 2016;139:240–55. doi: 10.1111/jnc.13249 - DOI - PubMed
    1. Malmberg M, Malm T, Gustafsson O, Sturchio A, Graff C, Espay AJ, et al.. Disentangling the Amyloid Pathways: A Mechanistic Approach to Etiology. Front Neurosci. 2020;14(April):1–11. doi: 10.3389/fnins.2020.00256 - DOI - PMC - PubMed
    1. Stefanis L, Emmanouilidou E, Pantazopoulou M, Kirik D, Vekrellis K, Tofaris GK. How is alpha-synuclein cleared from the cell? J Neurochem. 2019;150(5):577–90. doi: 10.1111/jnc.14704 - DOI - PubMed
    1. Braak H, Tredici K del, Rüb U, de Vos RAI, Jansen Steur ENH, Braak E. Staging of brain pathology related to sporadic Parkinson’s disease. Neurobiol Aging. 2003;24(2):197–211. doi: 10.1016/s0197-4580(02)00065-9 - DOI - PubMed
    1. Tran J, Anastacio H, Bardy C. Genetic predispositions of Parkinson’s disease revealed in patient-derived brain cells. NPJ Parkinsons Dis. 2020;6(1). doi: 10.1038/s41531-020-0110-8 - DOI - PMC - PubMed

Publication types

Substances