. 2022 Dec 14;30(12):1759-1772.e12.
doi: 10.1016/j.chom.2022.10.018. Epub 2022 Nov 17.

Lassa virus glycoprotein nanoparticles elicit neutralizing antibody responses and protection

Affiliations

Lassa virus glycoprotein nanoparticles elicit neutralizing antibody responses and protection

Philip J M Brouwer et al. Cell Host Microbe. .

Abstract

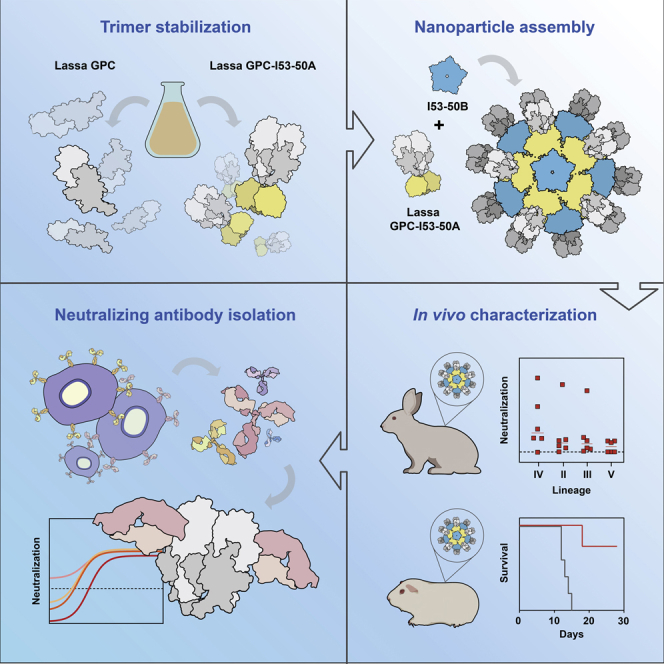
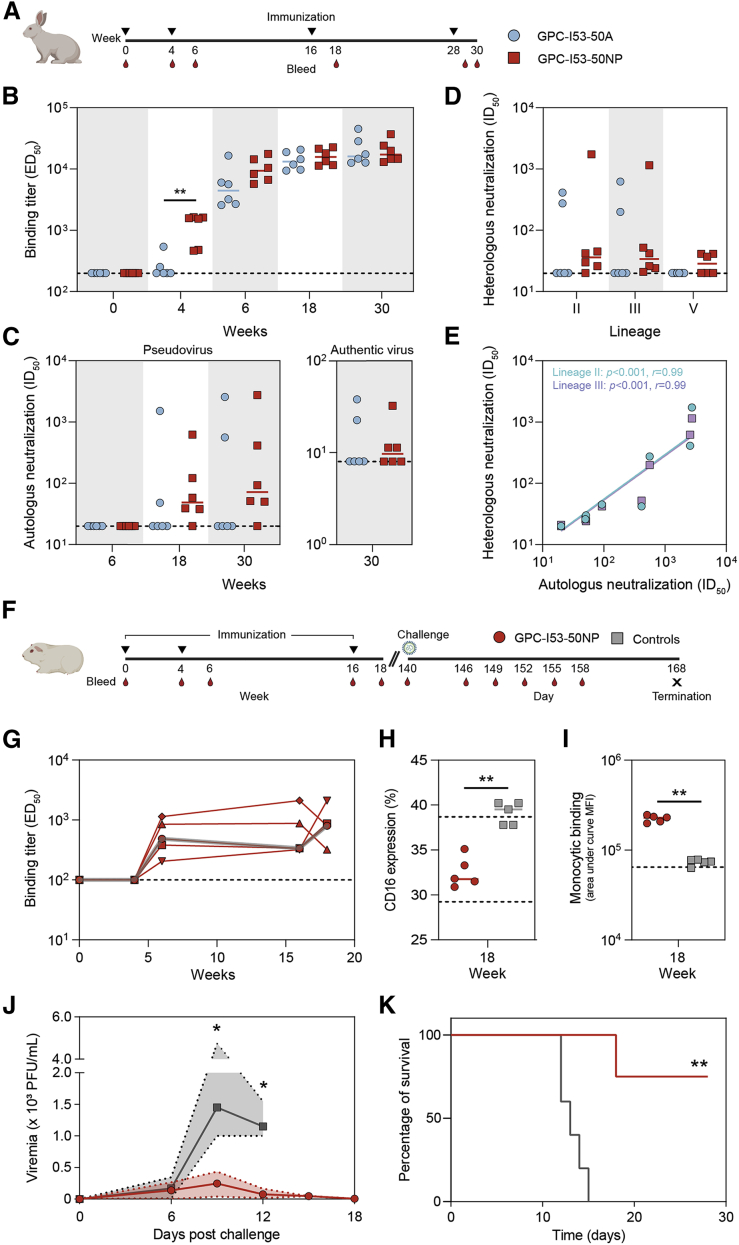
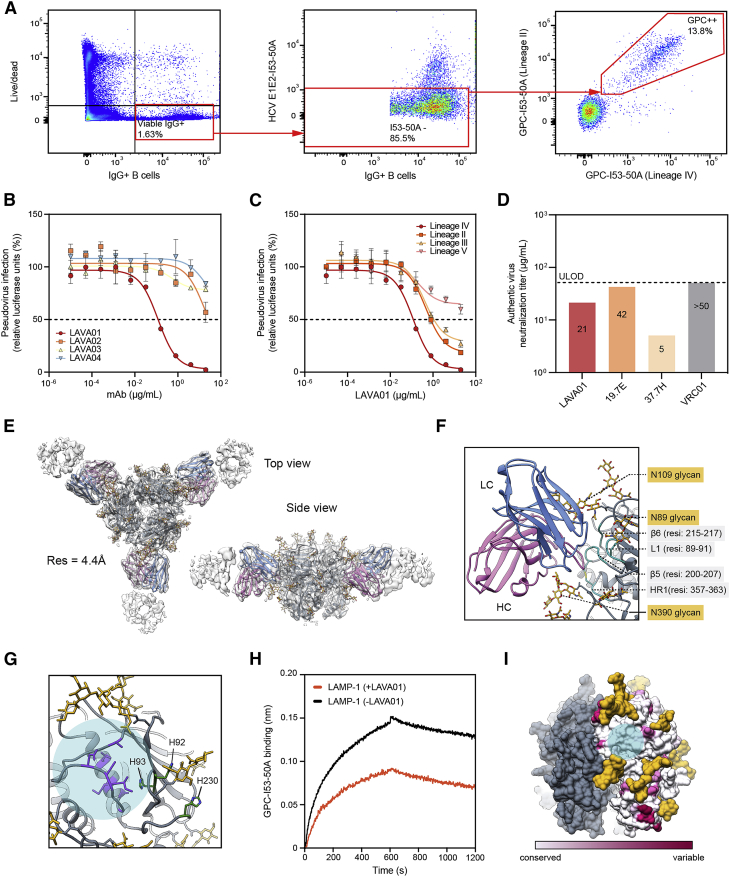
The Lassa virus is endemic in parts of West Africa, and it causes hemorrhagic fever with high mortality. The development of a recombinant protein vaccine has been hampered by the instability of soluble Lassa virus glycoprotein complex (GPC) trimers, which disassemble into monomeric subunits after expression. Here, we use two-component protein nanoparticles consisting of trimeric and pentameric subunits to stabilize GPC in a trimeric conformation. These GPC nanoparticles present twenty prefusion GPC trimers on the surface of an icosahedral particle. Cryo-EM studies of GPC nanoparticles demonstrated a well-ordered structure and yielded a high-resolution structure of an unliganded GPC. These nanoparticles induced potent humoral immune responses in rabbits and protective immunity against the lethal Lassa virus challenge in guinea pigs. Additionally, we isolated a neutralizing antibody that mapped to the putative receptor-binding site, revealing a previously undefined site of vulnerability. Collectively, these findings offer potential approaches to vaccine and therapeutic design for the Lassa virus.

Keywords: Lassa virus; antibody; challenge study; cryo-EM; nanoparticles; vaccine.


Conflict of interest statement

Declaration of interests Y.W. has taken up a position at AstraZeneca; all experimental work was performed prior to this development.

Figures

None
Graphical abstract
Figure 1
Figure 1
Biophysical characterization, antigenicity, and glycosylation of GPC-I53-50A (A) Linear schematic of the GPC and GPC-I53-50A constructs with GPCysR4 mutations annotated. The disulfide bond (207C–360C) that connects GP1 to GP2 is shown in gray. SP, signal peptide. (B) BN-PAGE analysis of GPC (−) and GPC-I53-50A (+). (C) 2D-class averages from nsEM with GPC (left) and GPC-I53-50A (right). (D) Sensorgrams from BLI experiments showing binding of GPC and GPC-I53-50A to immobilized human (b)NAbs 12.1F, 19.7E, 37.7H, and 25.10C. (E) Site-specific glycan analysis of GPC-I53-50A. Each pie chart summarizes the quantification of oligomannose (green), hybrid (dashed pink), and complex glycans (pink) for each glycan site on GP1 or GP2. The experimentally observed glycans are modeled on the trimeric GPC structure (PDB: 5VK214). The glycans are colored according to the oligomannose content as defined in the legend. GP1 and GP2 subunits are colored light gray and dark gray, respectively.
Figure 2
Figure 2
Biophysical and antigenic characterization of GPC-I53-50NPs (A) Representative size-exclusion chromatograph of GPC-I53-50A (left panel) and GPC-I53-50NPs after assembly with I53-50B (right panel). Collected fractions for particle assembly or of purified GPC-I53-50NPs are shown in pink shading. (B) Raw nsEM image of the SEC-purified GPC-I53-50NPs. White scale bar corresponds to 200 nm. (C) Sensorgrams from BLI experiments with GPC-I53-50A and GPC-I53-50NP showing the binding of bNAbs 12.1F, 37.7H, 19.7E, and 25.10C.
Figure 3
Figure 3
High-resolution cryo-EM structure of GPC-I53-50NPs (A) Sample micrograph (white scale bar corresponds to 100 nm), 2D class averages, and initial 3D reconstruction of the GPC-I53-50NP are displayed in the top left part of the panel. Focused refinement was applied to reconstruct the 3D map of the nanoparticle core (right). The structure of the I53-50NP is shown inside the map (I53-50A—yellow; I53-50B—blue; map—transparent white surface). Localized reconstruction approach was used for analysis of the presented antigen (bottom left). Refined GPC model is shown in dark gray with glycans displayed in golden yellow. (B) Comparison of the cryo-EM structure of GPC (dark gray) and the crystal structure of GPC (light gray) in complex with 18.5C antibody (green) (PDB: 6P9120) with the overlay of the two structures shown below. Comparison of the fusion peptide conformations is displayed in the bottom right part of this panel (cryo-EM model—pink; crystal structure—turquoise). Side chains of residues G260-W264 are displayed in each case. Comparison of the apex conformations in two structures is displayed in the top right part of this panel. The distances between N119 glycans are shown for each model (cryo-EM model—pink; crystal structure—turquoise).
Figure 4
Figure 4
Immunogenicity of GPC-I53-50A and GPC-I53-50NP in rabbits and protective efficacy of GPC-I53-50NP in guinea pigs (A) Schematic representation of the rabbit immunization schedule with color coding for each immunogen. (B) Midpoint binding titers against GPC-I53-dn5B at weeks 0, 4, 6, 18, and 30. (C) Midpoint NAb titers against autologous pseudovirus (lineage IV) at weeks 6, 18, and 30 (left panel). Endpoint NAb titers against authentic LASV (lineage IV) at week 30 (right panel). The dotted line indicates the lower limit of detection. (D) Midpoint NAb titers against heterologous pseudoviruses (lineages II, III, and V) at week 30. (E) Correlation plot of autologous NAb titers versus heterologous NAb titers (lineages II or III). The r and p values are shown for two-tailed Spearman correlations (n = 7 rabbits; all rabbits with an autologous neutralization ID50 > 20). (F) Schematic representation of the guinea pig challenge study schedule. (G) Midpoint binding titers against GPC-I53-dn5B at weeks 0, 4, 6, 16, and 18. The dark gray line represents the median. (H) CD16 expression on NK cells after incubation with GPC-specific serum antibodies from vaccinated and control guinea pigs. The lower dotted line represents median CD16 levels after incubation with a combination of phorbol myristate acetate (PMA) and ionomycin (positive control) whereas the upper dotted line represents median CD16 levels in the absence of serum antibodies (negative control). (I) Binding to monocytes (THP-1 cells) by GPC-specific serum antibodies from vaccinated and control guinea pigs. The lower dotted line represents median monocytes binding in the absence of serum antibodies (negative control). (J) Median RNA viral loads in vaccinated and control guinea pigs after challenge. The shaded area indicates the range. Statistical differences between two groups (days 6 and 9: n = 4 for vaccinated, n = 5 for controls; day 12: n = 4 for vaccinated and controls) were determined using two-tailed Mann-Whitney U-tests (p < 0.05). (K) Kaplan-Meier curve showing survival over time for vaccinated and control guinea pigs (n = 4 for vaccinated, n = 5 for controls at day 0) following a LASV challenge. Statistical difference between the two groups was determined using log-rank tests (∗∗p < 0.01). The same color coding was used as in (H). In (B)–(D), (H), and (I), the median titers are indicated by a bar. Statistical differences between groups were analyzed using the two-tailed Mann-Whitney U-test (p < 0.05; ∗∗p < 0.01; n = 6 rabbits for both groups in B–D; n = 5 guinea pigs for both groups in H and I).
Figure 5
Figure 5
Isolation of a monoclonal NAb that targets a previously undefined site of vulnerability on GPC (A) Representative gating strategy for the isolation of GPC-specific B cells. The lymphocyte population was selected, and doublets were excluded (not shown). From live IgG+ B cells (left), cells were selected that showed low reactivity to I53-50A (middle) after which the double-positive GPC-specific B cells were sorted (right). (B) Pseudovirus neutralization of lineage IV (Josiah) by LAVA01-LAVA04. The dotted line indicates 50% neutralization. Shown are the mean and SEM of two technical replicates. (C) Pseudovirus neutralization of lineages II, III, IV, and V by LAVA01. The dotted line indicates 50% neutralization. Shown are the mean and SEM of two technical replicates. (D) Endpoint neutralization titers against authentic LASV (lineage IV) by LAVA01, 19.7E, 37.7H, and VRC01 (HIV-1 Env-specific mAb; negative control). The dotted line indicates the upper limit of detection. (E) Reconstructed 3D map (transparent white surface) and relaxed model (GPC—gray, glycans—golden, LAVA01 heavy chain—purple, LAVA01 light chain—blue) shown in top and side view. (F) Peptide (turquoise) and glycan (golden) epitope components for LAVA01 antibody. (G) Overlay of the LAVA01 footprint (transparent light blue circle) with the histidine triad (green) and proposed LAMP-1 receptor-binding site residues determined by mutagenesis (purple). (H) Representative sensorgram from BLI experiments showing the binding of recombinant LAMP-1 ectodomain to GPC-I53-50A, in the presence (+LAVA01) or absence (−LAVA01) of LAVA01. (I) Sequence conservation of GPC with the LAVA01 footprint shown (transparent light blue circle).

References

    1. Günther S., Lenz O. Lassa virus. Crit. Rev. Clin. Lab. Sci. 2004;41:339–390. doi: 10.1080/10408360490497456. - DOI - PubMed
    1. Dan-Nwafor C.C., Ipadeola O., Smout E., Ilori E., Adeyemo A., Umeokonkwo C., Nwidi D., Nwachukwu W., Ukponu W., Omabe E., et al. A cluster of nosocomial Lassa fever cases in a tertiary health facility in Nigeria: description and lessons learned, 2018. Int. J. Infect. Dis. 2019;83:88–94. doi: 10.1016/j.ijid.2019.03.030. - DOI - PubMed
    1. Fisher-Hoch S.P., Tomori O., Nasidi A., Perez-Oronoz G.I., Fakile Y., Hutwagner L., McCormick J.B. Review of cases of nosocomial Lassa fever in Nigeria: the high price of poor medical practice. BMJ. 1995;311:857–859. doi: 10.1136/bmj.311.7009.857. - DOI - PMC - PubMed
    1. Andersen K.G., Shapiro B.J., Matranga C.B., Sealfon R., Lin A.E., Moses L.M., Folarin O.A., Goba A., Odia I., Ehiane P.E., et al. Clinical sequencing uncovers origins and evolution of Lassa virus. Cell. 2015;162:738–750. doi: 10.1016/j.cell.2015.07.020. - DOI - PMC - PubMed
    1. McCormick J.B., Webb P.A., Krebs J.W., Johnson K.M., Smith E.S. A prospective study of the epidemiology and ecology of Lassa fever. J. Infect. Dis. 1987;155:437–444. doi: 10.1093/infdis/155.3.437. - DOI - PubMed

LinkOut - more resources