

A set-theoretic definition of cell types with an algebraic structure on gene regulatory networks and application in annotation of RNA-seq data
- PMID: 36400029
- PMCID: PMC9859932
- DOI: 10.1016/j.stemcr.2022.10.015
A set-theoretic definition of cell types with an algebraic structure on gene regulatory networks and application in annotation of RNA-seq data
Abstract
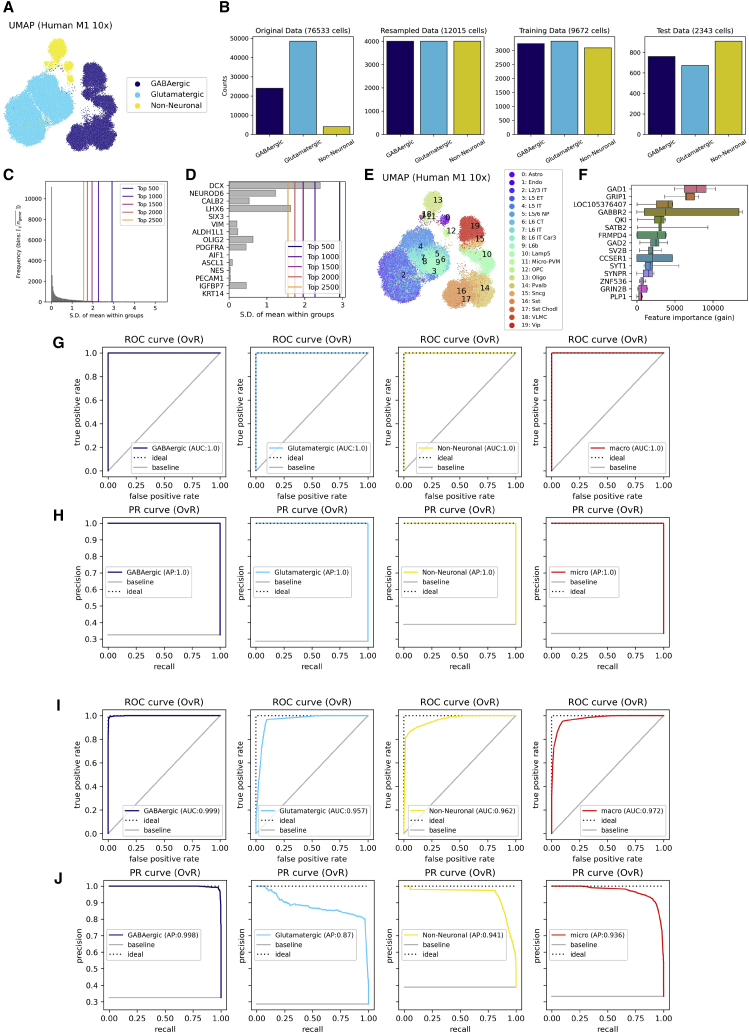
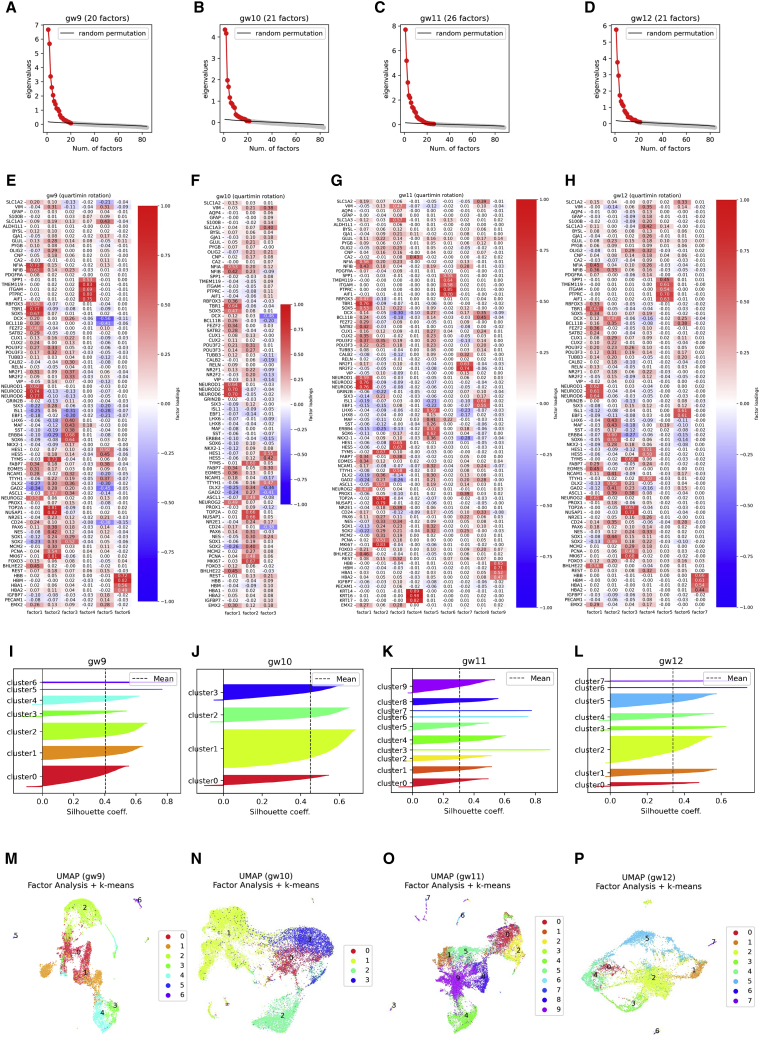
The emergence of single-cell RNA sequencing (RNA-seq) has radically changed the observation of cellular diversity. Although annotations of RNA-seq data require preserved properties among cells of an identity, annotations using conventional methods have not been able to capture universal characters of a cell type. Analysis of expression levels cannot be accurately annotated for cells because differences in transcription do not necessarily explain biological characteristics in terms of cellular functions and because the data themselves do not inform about the correct mapping between cell types and genes. Hence, in this study, we developed a new representation of cellular identities that can be compared over different datasets while preserving nontrivial biological semantics. To generalize the notion of cell types, we developed a new framework to manage cellular identities in terms of set theory. We provided further insights into cells by installing mathematical descriptions of cell biology. We also performed experiments that could correspond to practical applications in annotations of RNA-seq data.
Keywords: annotation; cell type; cellular state; mathematical model; scRNA-seq; set theory; transcriptome.
Copyright © 2022 The Authors. Published by Elsevier Inc. All rights reserved.
Conflict of interest statement
Conflict of interests H.O. is a compensated scientific consultant for San Bio Co., Ltd.; RMiC; and K Pharma, Inc.
Figures


Similar articles
-
XgCPred: Cell type classification using XGBoost-CNN integration and exploiting gene expression imaging in single-cell RNAseq data.Comput Biol Med. 2024 Oct;181:109066. doi: 10.1016/j.compbiomed.2024.109066. Epub 2024 Aug 24. Comput Biol Med. 2024. PMID: 39180857
-
scPLAN: a hierarchical computational framework for single transcriptomics data annotation, integration and cell-type label refinement.Brief Bioinform. 2024 May 23;25(4):bbae305. doi: 10.1093/bib/bbae305. Brief Bioinform. 2024. PMID: 38935069 Free PMC article.
-
Continually adapting pre-trained language model to universal annotation of single-cell RNA-seq data.Brief Bioinform. 2024 Jan 22;25(2):bbae047. doi: 10.1093/bib/bbae047. Brief Bioinform. 2024. PMID: 38388681 Free PMC article.
-
Respiratory epithelial cell types, states and fates in the era of single-cell RNA-sequencing.Biochem J. 2023 Jul 12;480(13):921-939. doi: 10.1042/BCJ20220572. Biochem J. 2023. PMID: 37410389 Free PMC article. Review.
-
Identifying cell types to interpret scRNA-seq data: how, why and more possibilities.Brief Funct Genomics. 2020 Jul 29;19(4):286-291. doi: 10.1093/bfgp/elaa003. Brief Funct Genomics. 2020. PMID: 32232401 Review.
Cited by
-
Multi-organ frailty is enhanced by periodontitis-induced inflammaging.Inflamm Regen. 2025 Feb 3;45(1):3. doi: 10.1186/s41232-025-00366-5. Inflamm Regen. 2025. PMID: 39894806 Free PMC article.
References
-
- Allen P.J. A fundamental theorem of homomorphisms for semirings. Proc. Am. Math. Soc. 1969;21:412–416.
-
- Ankan A., Panda A. Proc. 14th Python Sci. Conf. 2015. Pgmpy: probabilistic graphical models using Python. - DOI
-
- Bookstein A., Kulyukin V.A., Raita T. Generalized hamming distance. Inf. Retr. Boston. 2002;5:353–375.
-
- Cheng J., Bell D.a., Liu W. An algorithm for Bayesian belief network construction from data. Proc. Mach. Learn. Res. 1997:83–90.
Publication types
MeSH terms
Substances
LinkOut - more resources
Full Text Sources
