. 2022 Dec:66:101639.
doi: 10.1016/j.molmet.2022.101639. Epub 2022 Nov 15.

Glucagon receptor antagonism impairs and glucagon receptor agonism enhances triglycerides metabolism in mice

Affiliations

Glucagon receptor antagonism impairs and glucagon receptor agonism enhances triglycerides metabolism in mice

Katrine D Galsgaard et al. Mol Metab. 2022 Dec.

Abstract

Objective: Treatment with glucagon receptor antagonists (GRAs) reduces blood glucose but causes dyslipidemia and accumulation of fat in the liver. We investigated the acute and chronic effects of glucagon on lipid metabolism in mice.

Methods: Chronic effects of glucagon receptor signaling on lipid metabolism were studied using oral lipid tolerance tests (OLTTs) in overnight fasted glucagon receptor knockout (Gcgr-/-) mice, and in C57Bl/6JRj mice treated with a glucagon receptor antibody (GCGR Ab) or a long-acting glucagon analogue (GCGA) for eight weeks. Following treatment, liver tissue was harvested for RNA-sequencing and triglyceride measurements. Acute effects were studied in C57Bl/6JRj mice treated with a GRA or GCGA 1 h or immediately before OLTTs, respectively. Direct effects of glucagon on hepatic lipolysis were studied using isolated perfused mouse liver preparations. To investigate potential effects of GCGA and GRA on gastric emptying, paracetamol was, in separate experiments, administered immediately before OLTTs.

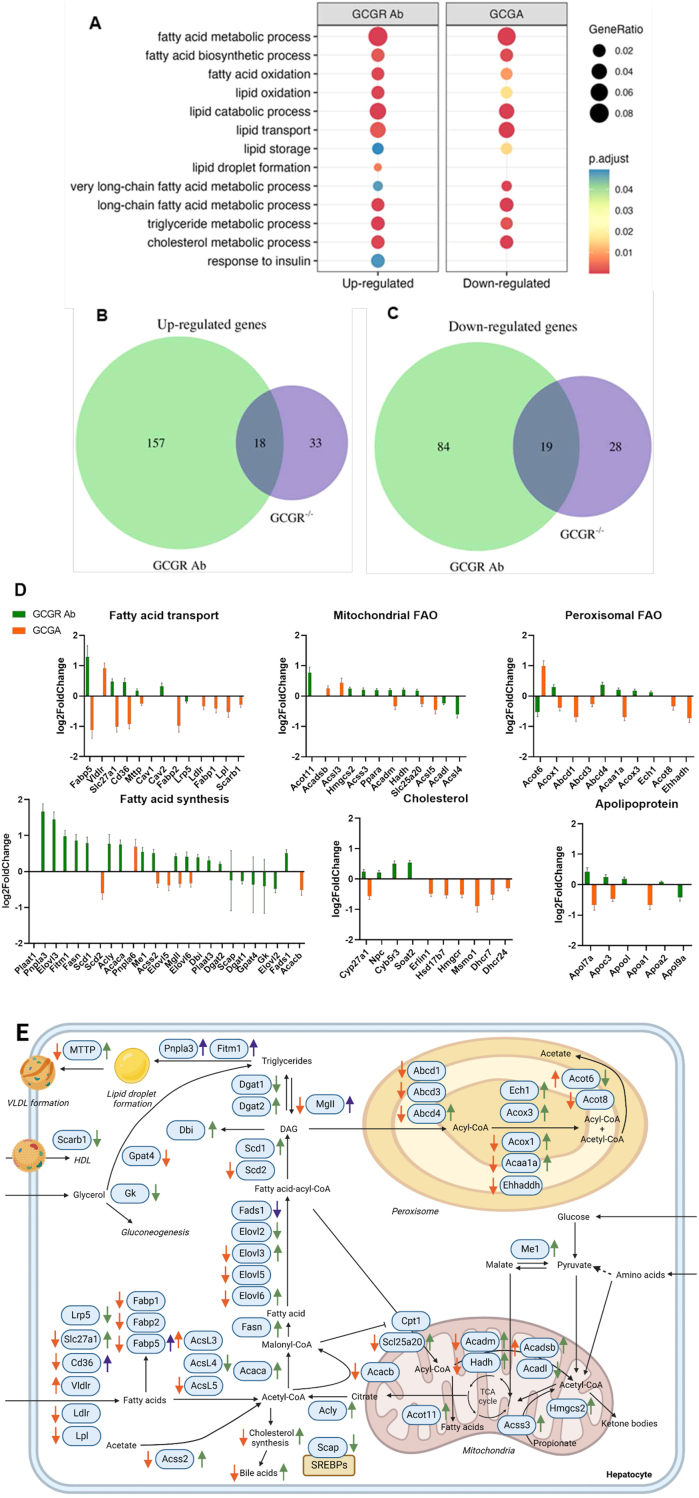
Results: Plasma triglyceride concentrations increased 2-fold in Gcgr-/- mice compared to their wild-type littermates during the OLTT (P = 0.001). Chronic treatment with GCGR Ab increased, whereas GCGA treatment decreased, plasma triglyceride concentrations during OLTTs (P < 0.05). Genes involved in lipid metabolism were upregulated upon GCGR Ab treatment while GCGA treatment had opposite effects. Acute GRA and GCGA treatment, respectively, increased (P = 0.02) and decreased (P = 0.003) plasma triglyceride concentrations during OLTTs. Glucagon stimulated hepatic lipolysis, evident by an increase in free fatty acid concentrations in the effluent from perfused mouse livers. In line with this, GCGR Ab treatment increased, while GCGA treatment decreased, liver triglyceride concentrations. The effects of glucagon appeared independent of changes in gastric emptying of paracetamol.

Conclusions: Glucagon receptor signaling regulates triglyceride metabolism, both chronically and acutely, in mice. These data expand glucagon´s biological role and implicate that intact glucagon signaling is important for lipid metabolism. Glucagon agonism may have beneficial effects on hepatic and peripheral triglyceride metabolism.

Keywords: Cholesterol; Glucagon; Non-esterified/ free fatty acids; Steatosis; Triglycerides.


Figures

Image 1
Graphical abstract
Figure 1
Figure 1
Fasted female mice with permanent genetic deletion of glucagon receptor signaling show postprandial lipid intolerance. (A) Blood glucose, (B) netAUC0–180 min blood glucose, (C) plasma triglyceride, (D) netAUC0–180 min triglyceride, (E) non-esterified fatty acid (NEFA), (F) netAUC0–180 min NEFA, (G) glycerol, (H) netAUC0–180 min glycerol concentrations during an oral lipid tolerance test (olive oil, 10 μL/g body weight via oral gavage) in female glucagon receptor knockout (Gcgr−/−) (red circles and lines) and female wild-type littermates (Gcgr+/+) (black squares and lines). (I) Liver triglyceride concentrations. (J) Plasma cholesterol profiles in overnight fasted Gcgr−/− (red circles) and Gcgr+/+ (black squares) mice not subjected to an oral lipid tolerance test. VLDL (very-low density lipoprotein), LDL (low density lipoprotein), and HDL (high density lipoprotein). Data in XY graphs are shown as mean ± SEM, and data in AUC graphs and (I) are shown as mean ± SD, n = 15–19, mice 12–25 weeks of age. P-values by unpaired t-test.
Figure 2
Figure 2
Chronic pharmacological inhibition and activation of glucagon receptor signaling, respectively, impairs and enhances postprandial lipid tolerance in female mice. (A, C) Blood glucose, (B, D)netAUC0–180 min blood glucose, (E, G) insulin, (F, H)netAUC0–120 min insulin, (I, K) non-esterified fatty acid (NEFA), (J, L)netAUC0–180 min NEFA, and (M, O) triglyceride (measured using ab65336) concentrations during an oral lipid tolerance test (olive oil, 10 uL/g body weight (BW) via oral gavage) in female C57BL/6JRj mice treated with a glucagon receptor antibody (GCGR Ab, REGN1193, Regeneron, 10 mg/kg BW) (green closed circles and solid lines), control antibody (Ctl Ab, REGN1945, Regeneron, 10 mg/kg BW) (green open circles and dotted lines) once weekly for eight weeks or a long-acting glucagon analogue (GCGA, NNC9204-0043, Novo Nordisk A/S, 1.5 nmol/kg BW) (orange closed circles and solid lines) or PBS + 1% BSA (PBS) (orange open circles and dotted lines) twice daily for eight weeks. The female mice were seven weeks old at the start of treatment. (N, P) Plasma cholesterol profiles in the GCGR Ab (green circles), Ctl Ab (black circles), GCGA (orange circles), and PBS (black circles) treated mice following the oral lipid tolerance test. VLDL (very-low density lipoprotein), LDL (low density lipoprotein), and HDL (high density lipoprotein). Data in XY graphs are shown as mean ± SEM, and data in AUC graphs are shown as mean ± SD, n = 4–8. ∗P < 0.05 by unpaired t-test of 180 or 120 min values and ∗∗P < 0.01 by unpaired t-test of netAUC.
Figure 3
Figure 3
Chronic pharmacological inhibition of glucagon receptor signaling increases liver triglyceride concentrations in non-fasted female mice. (A, B) Liver weights, (C, D) liver glycogen (3 of the measurements were under the detection limit and are shown as 0 μg/mg), and (E, F) liver triglyceride concentrations following an overnight fast and oral lipid tolerance test (olive oil, 10 uL/g body weight (BW) via oral gavage) in female C57BL/6JRj mice treated with a glucagon receptor antibody (GCGR Ab, REGN1193, Regeneron, 10 mg/kg BW) (green closed circles), control antibody (Ctl Ab, REGN1945, Regeneron, 10 mg/kg BW) (green open circles) once weekly for eight weeks or a long-acting glucagon analogue (GCGA, NNC9204-0043, Novo Nordisk A/S, 1.5 nmol/kg BW) (orange closed circles) or PBS + 1% BSA (PBS) (orange open circles) twice daily for eight weeks. Hematoxylin- and eosin-stained liver sections following (G) GCGR Ab, (H) Ctl Ab, (I) PBS, and (J) GCGA treatment, overnight fasting, and oral lipid tolerance test shown using a ×10 magnification, scale bar 1 mm. (K, L) Liver triglyceride concentrations in GCGR Ab, Ctl Ab, GCGA, or PBS treated mice not subjected to an overnight fast or oral lipid tolerance test. The female mice were seven weeks old at the start of treatment. Data shown as mean ± SD, n = 7–8. P-values by unpaired t-test.
Figure 4
Figure 4
Chronic pharmacological inhibition and activation of glucagon receptor signaling cause up- and down-regulation, respectively, of genes regulating lipid metabolism in female mice. (A) Gene ontology (GOBP) biological processes enriched for up- and down-regulated genes in the livers of female C57BL/6JRj mice treated with glucagon receptor antibody (GCGR Ab, REGN1193, Regeneron, 10 mg/kg body weight (BW), once weekly) or a long-acting glucagon analogue (GCGA, NNC9204-0043, Novo Nordisk A/S, 1.5 nmol/kg BW, twice daily) for eight weeks compared to their respective controls (control antibody (REGN1945, Regeneron) or PBS + 1% BSA), n = 6–8. Venn diagrams showing the number of significantly up-regulated (B) and down-regulated (C) genes in GCGR Ab mice (green) and Gcgr−/− mice (purple) and overlapping genes. FDR<0.05 was applied to all analyses to correct for multiple testing. (D) Log2fold changes of selected genes of interest in GCGR Ab (green) and GCGA (orange) treated mice presented as mean ± SEM. (E) Differentially regulated selected genes of interest are shown in blue rectangles. The orange arrows indicate differential mRNA expression in the livers GCGA treated mice compared to PBS, green arrows indicate differential mRNA expression in the livers of GCGR Ab treated mice compared to Ctl Ab, and purple arrows indicate differential mRNA expression in livers of both GCGR Ab treated and Gcgr−/− mice. Arrows pointing upwards indicate increased expression compared to the respective control and downward arrows indicate decreased expression. Created with BioRender.com.
Figure 5
Figure 5
Acute pharmacological inhibition and activation of glucagon receptor signaling, respectively, impairs and enhances postprandial lipid tolerance. (A, C) Blood glucose, (B, D) netAUC0–180 min blood glucose, (E, G) plasma triglyceride, (F, H) netAUC0–180 min triglyceride, (I, K) non-esterified fatty acid (NEFA), (J) netAUC0–180 min NEFA, (L) totalAUC0–180 min NEFA, (M) glycerol, and (N) netAUC0–180 min glycerol concentrations during an oral lipid tolerance test (olive oil, 10 μL/g body weight (BW) via oral gavage) in overnight fasted C57BL/6JRj female mice treated with a glucagon receptor antagonist (GRA, 25-2648, Novo Nordisk A/S, 100 mg/kg BW) (closed circles and solid lines), vehicle (open circles and dotted lines), a long-acting glucagon analogue (GCGA, NNC9204-0043, Novo Nordisk A/S, 3 nmol/kg BW, orange circles and lines or 30 nmol/kg BW, purple circles and lines), or PBS + 1% BSA (PBS) (black circles and lines). Liver triglyceride concentrations in (O) GRA and vehicle and (P) GCGA and PBS treated mice. (G) Measured using ab65336. Data in XY graphs are shown as mean ± SEM, and data in AUC graphs are shown as mean ± SD, n = 6–8, mice 13 weeks of age. (B, F, J, and N) P-values by unpaired t-test and (D, H, and L) P-values by one-way ANOVA.
Figure 6
Figure 6
Glucagon increases hepatic lipolysis in perfused livers of male mice. (A) Non-esterified fatty acids (NEFA) and (C) glucose concentrations in effluent from the perfused liver of male C57BL/6JRj mice, 10–12 weeks of age, perfused with 10 nmol/L glucagon. The vertical dotted line indicates the start of glucagon stimulation. Data shown as mean ± SEM. (B) Comparison of the average NEFA and (D) glucose concentrations during the baseline (Baseline) stimulation with the average concentration during glucagon stimulation (Glucagon). ∗∗ indicates a significant increase in the average NEFA output during glucagon stimulation compared with the baseline using a paired t-test. n = 5.

References

    1. Kazda C.M., Ding Y., Kelly R.P., Garhyan P., Shi C., Lim C.N., et al. Evaluation of efficacy and safety of the glucagon receptor antagonist LY2409021 in patients with type 2 diabetes: 12- and 24-week phase 2 studies. Diabetes Care. 2016;39(7):1241–1249. - PubMed
    1. Kazda C.M., Frias J., Foga I., Cui X., Guzman C.B., Garhyan P., et al. Treatment with the glucagon receptor antagonist LY2409021 increases ambulatory blood pressure in patients with type 2 diabetes. Diabetes, Obesity and Metabolism. 2017;19(8):1071–1077. - PubMed
    1. Guzman C.B., Zhang X.M., Liu R., Regev A., Shankar S., Garhyan P., et al. Treatment with LY2409021, a glucagon receptor antagonist, increases liver fat in patients with type 2 diabetes. Diabetes, Obesity and Metabolism. 2017;19(11):1521–1528. - PubMed
    1. Dresler C.M., Fortner J.G., McDermott K., Bajorunas D.R. Metabolic consequences of (regional) total pancreatectomy. Annals of Surgery. 1991;214(2):131–140. - PMC - PubMed
    1. Han S., Akiyama T.E., Previs S.F., Herath K., Roddy T.P., Jensen K.K., et al. Effects of small interfering RNA-mediated hepatic glucagon receptor inhibition on lipid metabolism in db/db mice. The Journal of Lipid Research. 2013;54(10):2615–2622. - PMC - PubMed

Publication types