. 2022 Nov 18;13(1):7074.
doi: 10.1038/s41467-022-34775-8.

Centromere defects, chromosome instability, and cGAS-STING activation in systemic sclerosis

Affiliations

Centromere defects, chromosome instability, and cGAS-STING activation in systemic sclerosis

Souren Paul et al. Nat Commun. .

Abstract

Centromere defects in Systemic Sclerosis (SSc) have remained unexplored despite the fact that many centromere proteins were discovered in patients with SSc. Here we report that lesion skin fibroblasts from SSc patients show marked alterations in centromeric DNA. SSc fibroblasts also show DNA damage, abnormal chromosome segregation, aneuploidy (only in diffuse cutaneous (dcSSc)) and micronuclei (in all types of SSc), some of which lose centromere identity while retaining centromere DNA sequences. Strikingly, we find cytoplasmic "leaking" of centromere proteins in limited cutaneous SSc (lcSSc) fibroblasts. Cytoplasmic centromere proteins co-localize with antigen presenting MHC Class II molecules, which correlate precisely with the presence of anti-centromere antibodies. CENPA expression and micronuclei formation correlate highly with activation of the cGAS-STING/IFN-β pathway as well as markers of reactive oxygen species (ROS) and fibrosis, ultimately suggesting a link between centromere alterations, chromosome instability, SSc autoimmunity, and fibrosis.


Conflict of interest statement

The authors declare no competing interests.

Figures
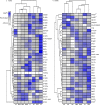
Fig. 1
Fig. 1. Centromere size variation in primary fibroblasts from patients with SSc.
a A heatmap depicting alpha-satellite content (rows) obtained by qPCR in 50 ng of DNA from fibroblasts obtained from healthy individuals (N59, N63, N67, and N68) and patients with lcSSc (17, 18, 19, 25). Unsupervised hierarchical clustering analysis was conducted to ascertain if distinct genetic signatures distinguish healthy fibroblasts from lesion fibroblasts. Normal samples are noted to cluster with diseased samples, suggesting that centromeric alterations in fibroblasts obtained from patients with lcSSc do not diverge from variations that occur at baseline in fibroblasts obtained from health individuals. b A heatmap depicting alpha-satellite content in fibroblasts from healthy individuals (N59, N60, and N64) and patients with dcSSc (43, 60, 65, and 74). With the exception of the dcSSc sample 74, diseased samples are distinct genetically at the centromeric locus as compared to healthy samples (N59, N60, and N64) and show evidence of marked loss of centromere repeats in multiple chromosomes. The color gradient bar represents relative abundance (left). No significant variation of chromosomal arm gene copy numbers GAPDH, TTR, and TOP3A were observed. The nomenclature of these α-satellites begins with the letter D, followed by their chromosome number (1–22, X or Y), followed by a Z, and a number indicating the order in which these sequences were discovered. The DYZ3 repeat accurately represents the gender of the individuals (light gray: female; blue: male). Data obtained in three replicates were analyzed using a multiple unpaired t-test, assuming a gaussian distribution. Stars indicate statistically significant differences between the groups in a t-test analysis (*p = < 0.5, **p = < 0.1, ***p = < 0.001). LNA lock nucleic acid. Source Data are provided as a Source Data file.
Fig. 2
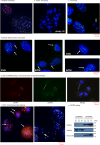
Fig. 2. Cytogenetic analysis of SSc skin fibroblasts.
Fibroblasts from skin biopsies of healthy individuals (a) and SSc patients (bg) were arrested in metaphase with colchicine. Chromosomal spreads were stained with anti-CENPA (red) or anti-CENPB (green) antibodies. (In b, c, and f only anti-CENPB). The nuclei/chromosomes were counterstained with DAPI. Shown are representative pictures of at least 10 micrographs. a Healthy fibroblasts showing normal ploidy, b Aneuploidy in dcSSc fibroblasts showing 52 chromosomes, c Micronuclei in SSc fibroblasts (arrows). d Nuclear defects and micronuclei (arrows) in dcSSc and lcSSc. e Loss of centromere identity in micronuclei from SSc fibroblasts. The arrow indicates a micronucleus stained with CENPB but not CENPA antibodies. f Cytoplasmic centromere proteins (arrows) in fibroblasts from ACA-positive lcSSc patients. Yellow indicates colocalization of CENPA and CENPB. g Western blotting analysis of CENPA, GAPDH and H3K9Me3 in cytoplasmic and chromatin fractions from SSc fibroblasts grown in the presence of colchicine. GAPDH (cytoplasmic) and H3K9Me3 (chromatin) confirmed the specificity and purity of the fractions. CENPA was detected mostly in nuclear chromatin fractions as expected but was found leaked into the cytoplasmic fraction in lcSSc patient 025, who has ACAs. Patients 043 and 116 with dcSSc are seronegative for ACAs. A faint band is seen in the cytoplasmic fraction in patient 043. A more quantitative description of the data is found in Supplementary Table 1.
Fig. 3
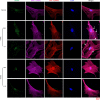
Fig. 3. Colocalization of cytoplasmic/membrane CENPB and MHC Class II molecules in lcSSc skin fibroblasts of patients with ACAs.
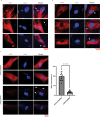
We performed IF to visualize CENPB (green) and the expression of the MHC class II molecules DRB1 (beta 1 chain: purple) and DRB5 (beta 5 chain: red) in SSc and healthy skin fibroblasts. Nuclei were counterstained with DAPI (Blue). Shown are representative pictures of at least 10 micrographs. Arrows indicate colocalization of cytoplasmic/membrane CENPB and both MHCII regions in lcSSc patients (025 and 111), who have ACAs. No colocalization was visualized in dcSSc skin fibroblasts (043 and 116). The scale bar is shown at the bottom right.
Fig. 4
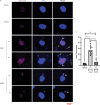
Fig. 4. Nuclei and micronuclei membrane integrity in SSc fibroblasts.
a We performed IF to visualize the expression of BANF1/BAF (purple), a marker for nuclear membrane integrity, in SSc skin fibroblasts. Nuclei and micronuclei were counterstained with DAPI (blue). In contrast to healthy and dcSSc skin fibroblasts (patient 43), abnormal expression of BANF1/BAF was found in the nuclei of the fibroblasts from an lcSSc patient (111) with centromere protein leaking suggesting nuclear membrane disruption. The micrographs also show that the fibroblasts from both of the SSc patients have several micronuclei stained with BANF1/BAF (white arrows) as well as micronuclei without BANF1/BAF staining (green arrows). The scale bar is shown at the bottom right. b The bar graph shows the mean fluorescence level of BANF1/BAF in SSc patients compared to healthy skin fibroblasts (n = 10 micrographs). Data were analyzed using one-way ANOVA and Tukey’s multiple comparisons test. ****p < 0.0001 ns = p 0.305. Data are presented as mean values +/− SD. Source Data are provided as a Source Data file.
Fig. 5
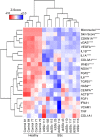
Fig. 5. Expression of profibrotic, proinflammatory, vasculopathy, ROS, and cGAS-STING genes in fibroblasts of SSc patients.
A heatmap analysis depicting gene expression content (rows) obtained by qRT-PCR in 50 ng of RNA from skin fibroblasts dissected from healthy individuals and patients with lcSSc and dcSSc. Unsupervised hierarchical clustering analysis was conducted to ascertain if distinct genetic signatures separate healthy fibroblasts from lesion fibroblasts. Normal samples (denoted as “control”) do not cluster with diseased samples, suggesting that gene expression alterations in fibroblasts obtained from SSc patients diverge from variations that occur at baseline in fibroblasts obtained from healthy individuals. The number of micronuclei found per 500 nuclei count and the mRSS are included in the analysis. Data obtained in three replicates were analyzed using a multiple unpaired t-test, assuming a gaussian distribution. Stars indicate statistically significant differences between the control cells and SSc patients in a t-test analysis (**p < 0.1, ***p < 0.001, ****p < 0.0001). Source Data are provided as a Source Data file.
Fig. 6
Fig. 6. Colocalization of cGAS to micronuclei in SSc fibroblasts.
IF analysis of expression of cGAS (red) in SSc fibroblasts. Nuclei and micronuclei were stained in DAPI (blue). a Micrographs showing cGAS expression and colocalization to micronuclei in an lcSSc patient (111). b Micrographs showing only cGAS expression but not co-localization to micronuclei in the same lcSSc patient (111). c Confirmation of the specificity of c-GAS staining in a and b. Representative fluorescence images and quantification using ImageJ showing reduction of cGAS expression in cGAS DsiRNA transfected lcSSc patient fibroblasts (111) compared to control DsiRNA transfected lcSSc patient fibroblasts (111). The scale bars are shown at the bottom right. Arrows indicate micronuclei. The bar graph shows the mean fluorescence level of cGAS expression in Control DsiRNA-treated cells vs cGAS DsiRNA-treated cells (n = 10 micrographs per experiment). ****p < 0.0001. Data are presented as mean values +/− SD. Source Data are provided as a Source Data file.
Fig. 7
Fig. 7. Expression of IRF3 and p65 in SSc skin fibroblasts.
IF showing the expression cGAS-STING downstream factors (red) Phospho-IRF3 (a) and Phospho p65 (RELA) (b) in SSc skin fibroblasts. Nuclei were counterstained with DAPI (blue). IRF3 and p65 are phosphorylated at serine residues following cGAS-STING activation. Phosphorylated IRF3 forms a dimer and translocates to the nucleus to activate IFN-β and other cytokines. P65 (RELA) translocates to the nucleus after cGAS-STING activation. Both proteins activate the IFN-β pathway. The scale bar is shown at the bottom right. The bar graphs (cd) show the mean fluorescence level of respective phopho-protein expression in SSc patients compared to healthy skin fibroblasts (n = 9 micrographs). Data were analyzed using one-way ANOVA and Dunnett’s multiple comparisons test. *p < 0.05, **p < 0.01, ***p < 0.001, ****p < 0.0001. a Normal vs. 025 p = 0.0002; Normal vs. 111 p = 0.0315; Normal vs. 43 p = 0.0406; Normal vs. 116 p = 0.0016. b Normal vs. 116 p = 0.0066), the other p values are <0.0001. Data are presented as mean values +/− SD. Source Data are provided as a Source Data file.
Fig. 8
Fig. 8. Expression of 2′3′-cGAMP and IFN-β in SSc skin fibroblasts and inhibition of cGAS-STING/IFN-β activity with a cGAS inhibitor.
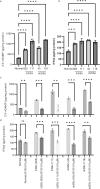
ELISAs were performed to measure the levels of expression of 2′3′-cGAMP (a) and IFN-β (b) in cell lysates and supernatants, respectively, in cultured skin fibroblasts from healthy,lcSSc (025 and 111), and dcSSc (43 and 116) individuals. Inhibition of the cGAS-STING/IFN-β pathway was assessed using the cGAS specific inhibitor G150. After treatment with G150 (10 µM) for 2 h cells were cultured for additional 24 h and the levels of of expression of 2′3′-cGAMP (c) and IFN-β (d) were evaluated using ELISA. Data are presented as mean values +/− SD (n = 3 independent experiments). Data were analyzed using one-way ANOVA and Dunnett’s multiple comparisons test. *p < 0.05, **p < 0.01, ***p < 0.001, ****p < 0.0001. The exact p values can be found in the Source Data file. Source Data are provided as a Source Data file.
Fig. 9
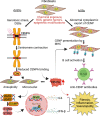
Fig. 9. The model depicting how centromere alterations and chromosome instability could impact the etiology of Systemic Sclerosis.
The damage to skin fibroblasts leads to centromere DNA alterations and/or abnormal centromere protein deposition in the cytoplasm. In dcSSc, centromere damage produces centromeric contractions and reduction of CENPA deposition at the centromere, leading to unstable kinetochore and microtubule attachment. These processes result in chromosome instability (CIN), characterized by aneuploidy and micronuclei formation and upregulation of CENPA. The overexpression of and/or mislocalization of CENPA alters gene expression as we have seen in cancer. In lcSSc, altered deposition of CENP proteins leads to CIN characterized by micronuclei formation as well as to excess of CENPA deposition. In lcSSc patients who develop ACAs, centromere DNA is somewhat affected and centromere proteins leak into the cytoplasm, further increasing the level of CENPA expression, which further drives CIN characterized by micronuclei formation. Given that fibroblasts from patients with SSc are known to express MHC on their surface, these MHC molecules likely present the cytoplasmic CENPs to B cells to induce production of ACAs. The presence of extranuclear DNA (micronuclei) in all SSc fibroblasts leads to activation of the cGAS-STING/IFN-β pathway and autoimmunity. DSBs doubled-strand breaks, IFN-β interferon beta, IL6 interleukin 6, CENP centromere protein, MHC major histocompatibility complex.

References

    1. Barnes J, Mayes MD. Epidemiology of systemic sclerosis: incidence, prevalence, survival, risk factors, malignancy, and environmental triggers. Curr. Opin. Rheumatol. 2012;24:165–170. - PubMed
    1. Fuschiotti P. Current perspectives on the immunopathogenesis of systemic sclerosis. Immunotargets Ther. 2016;5:21–35. - PMC - PubMed
    1. Gabrielli A, Avvedimento EV, T. Krieg T. Scleroderma. N. Engl. J. Med. 2009;360:1989–2003. - PubMed
    1. Denton CP, Khanna D. Systemic sclerosis. Lancet. 2017;10103:1685–1699. - PubMed
    1. Feghali-Bostwick C, Medsger TA, Jr., Wright TM. Analysis of systemic sclerosis in twins reveals low concordance for disease and high concordance for the presence of antinuclear antibodies. Arthritis Rheum. 2003;48:1956–1963. - PubMed

Publication types

Substances