. 2022 Nov 18;13(1):7077.
doi: 10.1038/s41467-022-34806-4.

Biasing the conformation of ELMO2 reveals that myoblast fusion can be exploited to improve muscle regeneration

Affiliations

Biasing the conformation of ELMO2 reveals that myoblast fusion can be exploited to improve muscle regeneration

Viviane Tran et al. Nat Commun. .

Abstract

Myoblast fusion is fundamental for the development of multinucleated myofibers. Evolutionarily conserved proteins required for myoblast fusion include RAC1 and its activator DOCK1. In the current study we analyzed the contribution of the DOCK1-interacting ELMO scaffold proteins to myoblast fusion. When Elmo1-/- mice underwent muscle-specific Elmo2 genetic ablation, they exhibited severe myoblast fusion defects. A mutation in the Elmo2 gene that reduced signaling resulted in a decrease in myoblast fusion. Conversely, a mutation in Elmo2 coding for a protein with an open conformation increased myoblast fusion during development and in muscle regeneration. Finally, we showed that the dystrophic features of the Dysferlin-null mice, a model of limb-girdle muscular dystrophy type 2B, were reversed when expressing ELMO2 in an open conformation. These data provide direct evidence that the myoblast fusion process could be exploited for regenerative purposes and improve the outcome of muscle diseases.


Conflict of interest statement

The authors declare no competing interests.

Figures
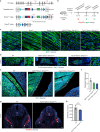
Fig. 1
Fig. 1. Elmo1 and Elmo2 are essential for myoblast fusion.
a Partial representation of the Elmo2 locus to demonstrate the strategy for the generation of Elmo2LacZ and Elmo2flox mice. The WT allele, the targeting vector and the recombined alleles are illustrated. The strategy and the probes used for southern blotting (Supp. Fig. 2c) are also indicated. The targeting vector contained a splice acceptor site and an IRES upstream of the Elmo 2 exon 6, followed by the LacZ reporter gene. Consequently, a truncated form of Elmo2 should be produced in fusion with IRES and β-galactosidase, thus resulting in a non-functional protein (Elmo2LacZ mice). Elmo2flox mice were generated by breeding Elmo2LacZ with Flp expressing mice. En2 SA: splice acceptor of mouse Engrailed2 exon 2; IRES: internal ribosome entry site; LacZ: gene encoding β-galactosidase; pA: polyadenylation signal; hbactP: human β-actin gene promoter; Neo: neomycin resistance gene. b Schematic representation showing the analysis performed on mouse embryos. Differentiation of muscle cells was assessed on E11.5 embryos, primary fibers following the first wave of myogenesis were analyzed on E14.5 embryos, and secondary myofibers following the second wave of myogenesis were analyzed on E16.5 embryos. c Longitudinal muscle sections of E14.5 embryos. Myosin heavy chain (MHC)-positive multinucleated myofibers are present in WT, Elmo1−/− and Elmo2LacZ/LacZ embryos, while only mononucleated muscle cells are present in either Myf5CREElmo1−/−Elmo2flox/flox or Pax3CREElmo1−/−Elmo2flox/flox embryos. This experiment was done at least 3 times per genotype. df Sections of E16.5 embryos. d A reduction in muscle content is observed in both Myf5CREElmo1−/−Elmo2flox/flox and Pax3CREElmo1−/−Elmo2flox/flox embryos. This experiment was done at least two times per genotype. e The diaphragm thickness is smaller in both Myf5CREElmo1/Elmo2flox/flox and Pax3CREElmo1−/−Elmo2flox/flox embryos. f Quantification of the diaphragm thickness from e. Data are presented as the mean values +/− SD (n = 3 embryos for WT; n = 2 embryos for Myf5CREElmo1-/Elmo2flox/flox and Pax3CREElmo1−/−Elmo2flox/flox). g Similar DESMIN expression is observed in control WT and Pax3CREElmo1−/−Elmo2flox/flox embryos. h Quantification of DESMIN mean fluorescent intensity (MFI) at the myotome from g. Data are presented as the mean values +/− SD (n = 3 embryos). Mann-Whitney test (two-tailed) was used to determine the p-value. i liver, D diaphragm, Lu lung. Muscle cells and fibers were stained with anti-MHC (green) or anti-DESMIN (red), and Hoechst (blue) to reveal nuclei. (Scale bar: c, d, e = 50 µm; g = 100 µm). Source data are provided as a Source Data file.
Fig. 2
Fig. 2. Manipulating ELMO2 conformational regulation impacts on myoblast fusion during muscle development and growth.
a Schematic representation showing the closed and open conformations of the ELMO-DOCK complex. In the closed state, ELMO is in a closed conformation and the DHR-2 domain of DOCK is blocked by the RBD domain of ELMO, thus preventing RAC1 activation and the binding of interactors to the RBD of ELMO. Upon activation of the ELMO-DOCK complex, binding sites for ELMO interactors become available and the DHR2 of DOCK can activate RAC1. The RBD L43A mutation abrogates the binding of the RHOG and ARL4a GTPases, hence diminishing the signaling from ELMO/DOCK. The EID I196D mutation favors the open conformation of ELMO, which increases RAC1 activation by ELMO/DOCK. b Representative muscle fibers cross-sections of the indicated mice stained with H&E. c Quantification of b showing the mean myofibers cross-sectional area (CSA) +/−SD per genotype (n = 5 mice). d, e Distribution of myofibers size from (b) of the indicated mice. Data are presented as the mean values +/− SD (n = 5 mice). f Cross-sectional muscle sections of WT, Elmo2EID/EID and Elmo1−/−Elmo2RBD/RBD mice stained with anti-DYSTROPHIN (green) and Hoechst (magenta). Arrowheads indicate myonuclei located inside the myofibers. g Quantification of the number of myonuclei located inside the myofibers of e. Data are presented as the mean values +/− SD (n = 3 mice). (Scale bar: 50 µm). The Student’s t-test (for comparison of two independent groups) was used to calculate the P-values (two-tailed) presented in ce, g; *P < 0.05, **P < 0.01, ***P < 0,001. h Expression heatmap of known fusogenes between WT and Elmo2EID/EID myoblasts. Samples and genes were clustered using Euclidian distance. P-values for differential expression were calculated using the Wald test and adjusted for multiple comparisons using the Benjamini-Hochberg method. Significantly differentially expressed genes (padj < 0.05) are represented by black boxes. Source data are provided as a Source Data file.
Fig. 3
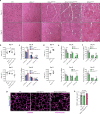
Fig. 3. Manipulating ELMO2 conformational regulation impacts on myoblast fusion during muscle regeneration.
a Representative cross-sections of TA muscle 14 and 21 days following CTX-induced injury. b–f Quantification of (a) showing b, d the mean CSA per mice, c, e the percentage (%) of myofibers at different ranges of myofiber size and f the number of nuclei per myofibers at day 14 and 21 following injury for the indicated mice. Data are presented as the mean values +/−  SD (n = 5 mice). g, h The number of PAX7-positive cells is not affected in both Elmo2EID/EID and Elmo1/-Elmo2RBD/RBD mice. Satellite cells are stained with anti-PAX7 (green), the basement membrane of muscle is stained with anti-LAMININ or anti-DYSTROPHIN (magenta) antibodies and nuclei were revealed with Hoechst (blue). (Scale bar: 50 µm). h Quantification of (g) Data are presented as the mean values +/− SD (n = 3 mice) The Student’s t-test (for comparison of two independent groups) was used to calculate the P-values (two-tailed) in bf, h; *P < 0.05, **P < 0.01, ***P < 0,001 and ****P < 0.0001. Source data are provided as a Source Data file.
Fig. 4
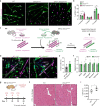
Fig. 4. Manipulating ELMO2 conformational regulation regulates myoblast fusion in a cell intrinsic manner.
a Fusion assay performed with primary myoblasts isolated from the indicated mice after 72 h of differentiation. Myoblasts were stained with anti-MHC (green) and Hoechst (magenta) to reveal the nuclei (n = 4). b Quantification of (a) showing the fusion index of mononucleated (1 nucleus), binucleated (2 nuclei) and multinucleated myofibers (≥3 nuclei). Data are presented as the mean values +/− SD (n = 4). c Schematic representation of the mix population assay performed with primary myoblasts isolated from the indicated mice. The first population of primary myoblasts were stained with a red dye (represented here in magenta) and were differentiated for 72 h. A second population of primary myoblasts of the indicated genotypes were stained with a green dye and added with the magenta myofibers. A second round of differentiation was induced for 72 h and light pink myofibers (mixed myofibers) were quantified. d Mix population assay performed with primary myoblasts, as described in c. e Quantification of (d) showing the fusion index of light pink myofibers (mixed myofibers) for each condition. Data are presented as the mean values +/− SD (n = 3 independent experiments for WT:WT and n = 2 independent experiments for WT:Elmo2EID). f Relative fold change from the indicated differentiation markers were obtained from RNA sequencing performed on WT or Elmo2EID myoblasts differentiated for 72 h. Data are presented as the mean values +/− SD (n = 3). g To induce multiple cycles of degeneration/regeneration, CTX was injected in the TA 3 times, every 28 days. One month following the last injection, muscle was harvested and analyzed. h Representative muscle cross-sections stained with H&E of mice of the indicated genotype following repeated CTX injections. i Quantification of (g) showing the mean CSA per mice. Data are presented as the mean values +/− SD (n = 5 mice). (Scale bar: 50 µm). Student’s t-test (for comparison of two independent groups) was used to calculate the P-values (two-tailed) presented in b and i; *P < 0.05, **P < 0.01. Source data are provided as a Source Data file.
Fig. 5
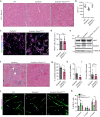
Fig. 5. Expression of open conformation of ELMO2 rescues the dystrophic phenotypes of the Dysferlin−/− mouse model.
a Representative muscle cross-sections of the indicated mice stained with H&E, at day 14 following CTX-injection. b Quantification of (a) showing the mean CSA per mice +/−SD (n = 5 mice). WT mice used for quantification are the same group as in Fig. 2g–l. c Representative muscle cross-sections of mice of the indicated genotypes stained with anti-LAMININ(magenta), anti-PAX7 (green) and Hoechst (blue). Arrowheads indicate PAX7-positive cells located on the myofibers. d Quantification of the number of PAX7-positive cells from (c). Data are presented as the mean values +/− SD (n = 10 measurements for Dysferlin−/−, n = 12 for Dysferlin−/−Elmo2EID/EID, from two mice per condition). e Western blot analysis of ELMO2 expression in primary myoblast isolated from the indicated mice genotypes. Data are representative from two independent mice per condition. f Representative cross-sections of myofibers stained with H&E, from aged (8–12 months old) mice of the indicated genotypes (n = 5 mice). gi Quantification of the muscle cross-sections from (f) of the percentage of the centrally located nuclei myofibers (g), necrotic myofibers (h) and area of fatty deposit (i). Data are presented as the mean values +/− SD (n = 5). j Fusion assays performed on primary myoblasts isolated from mice of the indicated genotypes (n = 5). k Quantification of (j) showing the fusion index of MHC-positive myofibers. Data are presented as the mean values +/− SD (n = 5). WT myoblasts used for quantification are the same cells as in Fig. 4a, b. (Scale bar: 50 µm). Student’s t-test (for comparison of two independent groups) was used to calculate the P-values (two-tailed) in b, d, gi, k; *P < 0.05, **P < 0.01. Source data are provided as a Source Data file.

References

    1. Wakelam MJ. The fusion of myoblasts. Biochem J. 1985;228:1–12. - PMC - PubMed
    1. Abmayr SM, Pavlath GK. Myoblast fusion: lessons from flies and mice. Development. 2012;139:641–656. - PMC - PubMed
    1. Petrany MJ, Millay DP. Cell fusion: merging membranes and making muscle. Trends Cell Biol. 2019;29:964–973. - PMC - PubMed
    1. Yin H, Price F, Rudnicki MA. Satellite cells and the muscle stem cell niche. Physiol. Rev. 2013;93:23–67. - PMC - PubMed
    1. Laurin M, et al. The atypical Rac activator Dock180 (Dock1) regulates myoblast fusion in vivo. Proc. Natl Acad. Sci. USA. 2008;105:15446–15451. - PMC - PubMed

Publication types

Substances