. 2022 Nov 18;12(1):19840.
doi: 10.1038/s41598-022-23872-9.

Model-free phasor image analysis of quantitative myocardial T1 mapping

Affiliations

Model-free phasor image analysis of quantitative myocardial T1 mapping

Wouter M J Franssen et al. Sci Rep. .

Abstract

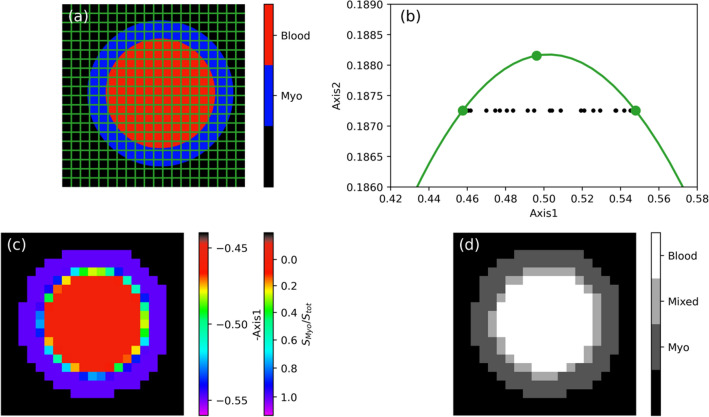
Model-free phasor image analysis, well established in fluorescence lifetime imaging and only recently applied to qMRI [Formula: see text] data processing, is here adapted and validated for myocardial qMRI [Formula: see text] mapping. Contrarily to routine mono-exponential fitting procedures, phasor enables mapping the lifetime information from all image voxels to a single plot, without resorting to any regression fitting analysis, and describing multi-exponential qMRI decays without biases due to violated modelling assumptions. In this feasibility study, we test the performance of our recently developed full-harmonics phasor method for unravelling partial-volume effects, motion or pathological tissue alteration, respectively on a numerically-simulated dataset, a healthy subject scan, and two pilot patient datasets. Our results show that phasor analysis can be used, as alternative method to fitting analysis or other model-free approaches, to identify motion artifacts or partial-volume effects at the myocardium-blood interface as characteristic deviations, or delineations of scar and remote myocardial tissue in patient data.


Conflict of interest statement

The authors declare no competing interests.

Figures

Figure 1
Figure 1
Phasor processing of T1 qMRI data from a simulated heart phantom. (a) Sample architecture, indicating the used sampling grid, with the blood pool in red, and the myocardium in blue. The outside region in black corresponds to absence of MRI signal. (b) Full-harmonics phasor plot of the Inversion Recovery data simulated for the phantom in (a). In green, the mono-exponential reference curve and the dots referring to the three positions used for the full-harmonics projection with T1= 1.5, 1.75 and 2 s. (c) and (d) Image reconstructed from the phasor-space coordinates and its corresponding phasor-based segmentation, respectively.
Figure 2
Figure 2
Phasor or fitting analysis of a 1H T1 qMRI dataset recorded on a healthy volunteer using a MOLLI pulse sequence. (a) Intensity map obtained from the first TI value of the MOLLI data. In red, the outline of the region selected for the phasor analysis is shown. (b) Full-harmonics phasor plot of the selected region. In green the mono-exponential reference curve is plotted, with the green dots referring to the three positions used for the full-harmonics projection. (c) T1 map obtained by single-exponential two-parameter fit. (d) Phasor-coordinate map derived from the x-axis coordinate of the phasor plot, where the phasor-coordinate colourmap has been inverted to match the colour scheme of the T1 map in (c). (e) Map of the phasor-based segmentation.
Figure 3
Figure 3
Effect of motion on full-harmonics phasor plots, with their reference curve in green (top), and on single-exponential T1 mapping images (bottom) for 1H qMRI T1 data for a healthy volunteer. The columns refer to data either devoid of motion artifacts (left) or with added simulated motion using voxel shift (middle), and to data recorded during free breathing of the volunteer (right). The projection plane of the phasor plots was defined by three T1 values, namely 0.7, 1.1, 2 s. The reference curve in (c) looks different than in (a) and (b) due to both the different data sampling (see Sect. “Measured and simulated motion-corruption effects”) and the additional imaging noise caused by respiratory motion.
Figure 4
Figure 4
For two diseased individuals (ae or fj): phasor or fitting analysis of MOLLI data. (a, f) LGE images, with the scar indicated by the brown arrow; (b,g) T1 and (c,h) phasor-coordinates images; (d,i) phasor plots voxels identified either as scar muscle depicted in red, or as healthy myocardium tissue plotted in blue with the reference phasor curve in green The brown and green arrows in the phasor and T1 maps indicate the regions, fully shown in Figure S2 of SI, where these phasor plot voxels are taken from. The data points in grey refer to the whole phasor-coordinate images, partly overlapping with data points for healthy and scar tissue. (e, j) Phasor-based segmentation images for the three phasor plot regions, defined based on Axis1 intervals marked in the phasor plots (d, i) as dashed lines referring to healthy (blue) and scar (red) myocardial tissue, as well as to the whole image (gray) (see Sect. “Patients”). The black regions in (e, j) refer to image voxels, also plotted in gray in (d, i), falling outside the three selected Axis1 intervals and attributed to background noise.

References

    1. Taylor AJ, Salerno M, Dharmakumar R, Jerosch-Herold M. T1 Mapping basic techniques and clinical applications. JACC Cardiovasc. Imaging. 2016;9:67–81. doi: 10.1016/j.jcmg.2015.11.005. - DOI - PubMed
    1. Haaf P, et al. Cardiac T1 mapping and extracellular volume (ECV) in clinical practice: A comprehensive review. J. Cardiovasc. Magn. Reson. 2016;18:89. doi: 10.1186/s12968-016-0308-4. - DOI - PMC - PubMed
    1. Hanson CA, Kamath A, Gottbrecht M, Ibrahim S, Salerno M. T2 relaxation times at cardiac MRI in healthy adults: A systematic review and meta-analysis. Radiology. 2020;297:344–351. doi: 10.1148/radiol.2020200989. - DOI - PMC - PubMed
    1. Triadyaksa P, Oudkerk M, Sijens PE. Cardiac T-2* mapping: Techniques and clinical applications. J. Magn. Reson. Imaging. 2020;52:1340–1351. doi: 10.1002/jmri.27023. - DOI - PMC - PubMed
    1. Ferreira VM, et al. Cardiovascular magnetic resonance in nonischemic myocardial inflammation expert recommendations. J. Am. Coll. Cardiol. 2018;72:3158–3176. doi: 10.1016/j.jacc.2018.09.072. - DOI - PubMed

Publication types