. 2022 Nov 18;9(1):713.
doi: 10.1038/s41597-022-01788-3.

SARS-CoV-2 RNA levels in Scotland's wastewater

Affiliations

SARS-CoV-2 RNA levels in Scotland's wastewater

Livia C T Scorza et al. Sci Data. .

Abstract

Nationwide, wastewater-based monitoring was newly established in Scotland to track the levels of SARS-CoV-2 viral RNA shed into the sewage network, during the COVID-19 pandemic. We present a curated, reference dataset produced by this national programme, from May 2020 to February 2022. Viral levels were analysed by RT-qPCR assays of the N1 gene, on RNA extracted from wastewater sampled at 162 locations. Locations were sampled up to four times per week, typically once or twice per week, and in response to local needs. We report sampling site locations with geographical coordinates, the total population in the catchment for each site, and the information necessary for data normalisation, such as the incoming wastewater flow values and ammonia concentration, when these were available. The methodology for viral quantification and data analysis is briefly described, with links to detailed protocols online. These wastewater data are contributing to estimates of disease prevalence and the viral reproduction number (R) in Scotland and in the UK.


Conflict of interest statement

The authors declare no competing interests.

Figures

Fig. 1
Fig. 1
Overview of the methodology workflow of the Scottish SARS-CoV-2 monitoring in wastewater programme. Incoming wastewater samples are collected by Scottish Water (1) and transferred to SEPA’s laboratories where samples are stored and processed (2). SARS-CoV-2 viral levels are then quantified using RT-qPCR (3). Finally, the data obtained are shared on SEPA’s public dashboard and with the Scottish Government, local authorities and agencies such as Public Health Scotland. Additionally, the detailed methodology and datasets are shared in open online platforms and repositories such as protocols.io, Zenodo and GitHub–, (https://github.com/BioRDM/COVID-Wastewater-Scotland). This figure was created with BioRender.com.
Fig. 2
Fig. 2
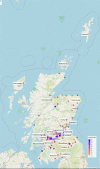
Map of Scotland showing sites from which wastewater samples were collected for SARS-CoV-2 analysis. The coloured circles show normalised SARS-CoV-2 virus levels on the last week of July 2021 in Million gene copies per person per day ([Mgc/pD]; truncated to 90). The grey circles represent sites without measurement on that week. See Methods – Data visualization for further details.
Fig. 3
Fig. 3
Heatmap showing SARS-CoV-2 RNA levels over time at selected sampling sites, illustrating key features of the data across the Alpha, Delta and Omicron waves. The sites represent all 14 Scotland NHS health boards. To obtain the weekly normalized values, the gene copies per person per day falling into the same week for each site were averaged. To build the heatmap, two break points were used in the visualisation colour scale: 2.9 (labelled positive) and 88, which correspond to 3rd quartiles of normalized data labelled as non-positive and positives, respectively. See Methods – Data visualization for further details.

References

    1. Vandenberg O, Martiny D, Rochas O, van Belkum A, Kozlakidis Z. Considerations for diagnostic COVID-19 tests. Nat. Rev. Microbiol. 2021;19:171–183. doi: 10.1038/s41579-020-00461-z. - DOI - PMC - PubMed
    1. Kerr CC, et al. Controlling COVID-19 via test-trace-quarantine. Nat. Commun. 2021;12:2993. doi: 10.1038/s41467-021-23276-9. - DOI - PMC - PubMed
    1. Mak GC, et al. Evaluation of rapid antigen test for detection of SARS-CoV-2 virus. J. Clin. Virol. 2020;129:104500. doi: 10.1016/j.jcv.2020.104500. - DOI - PMC - PubMed
    1. Zuccato E, Chiabrando C, Castiglioni S, Bagnati R, Fanelli R. Estimating Community Drug Abuse by Wastewater Analysis. Environ. Health Perspect. 2008;116:1027–1032. doi: 10.1289/ehp.11022. - DOI - PMC - PubMed
    1. Berchenko Y, et al. Estimation of polio infection prevalence from environmental surveillance data. Sci. Transl. Med. 2017;9:eaaf6786. doi: 10.1126/scitranslmed.aaf6786. - DOI - PubMed