. 2022 Nov;4(11):1573-1590.
doi: 10.1038/s42255-022-00671-0. Epub 2022 Nov 18.

Brown adipose tissue-derived Nrg4 alleviates endothelial inflammation and atherosclerosis in male mice

Affiliations

Brown adipose tissue-derived Nrg4 alleviates endothelial inflammation and atherosclerosis in male mice

Lingfeng Shi et al. Nat Metab. 2022 Nov.

Erratum in

Retraction in

Abstract

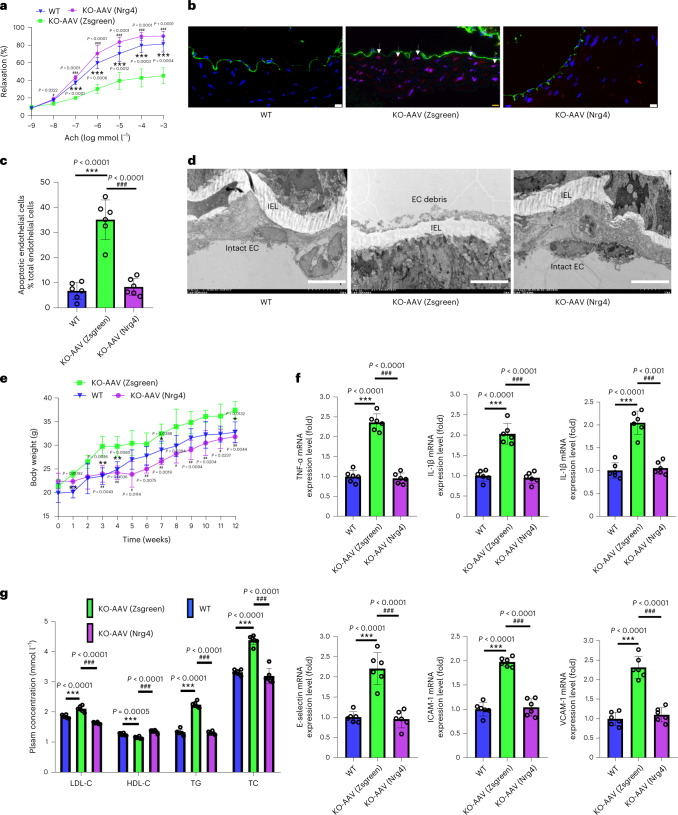
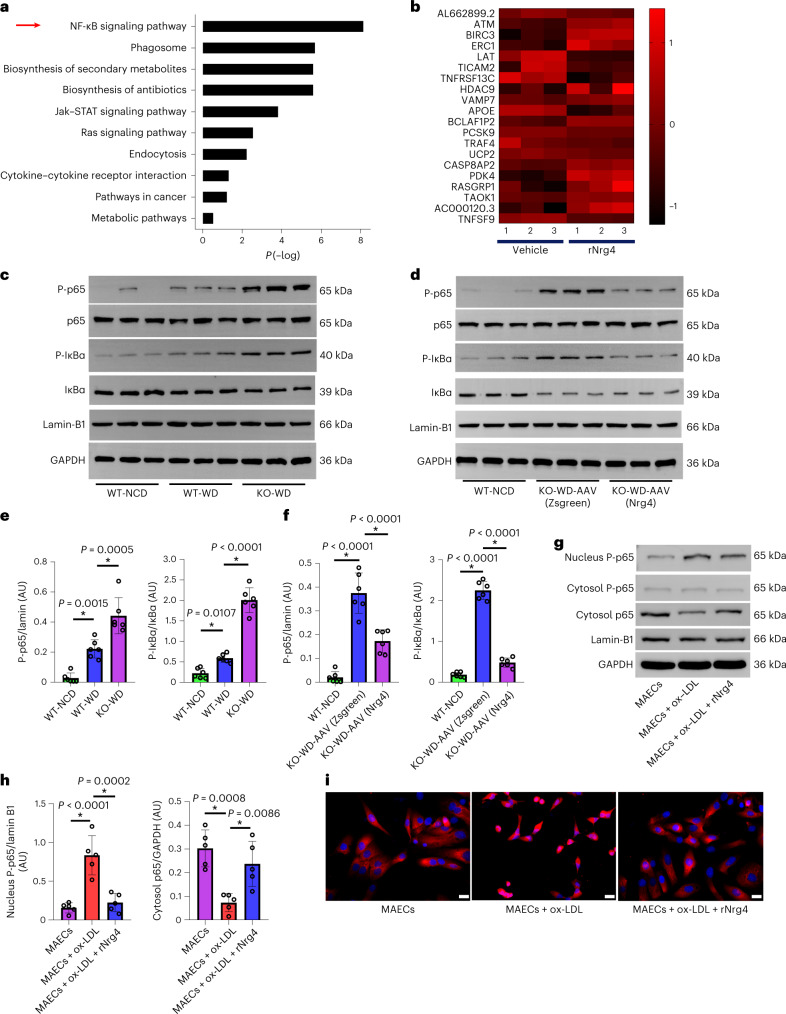
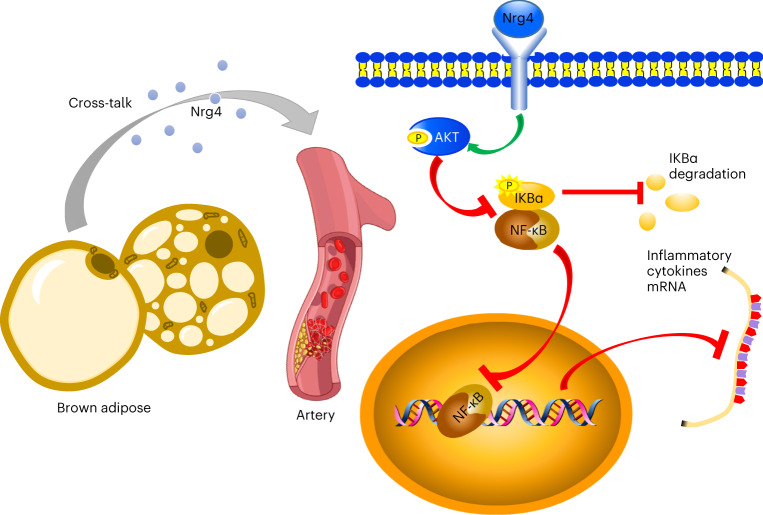
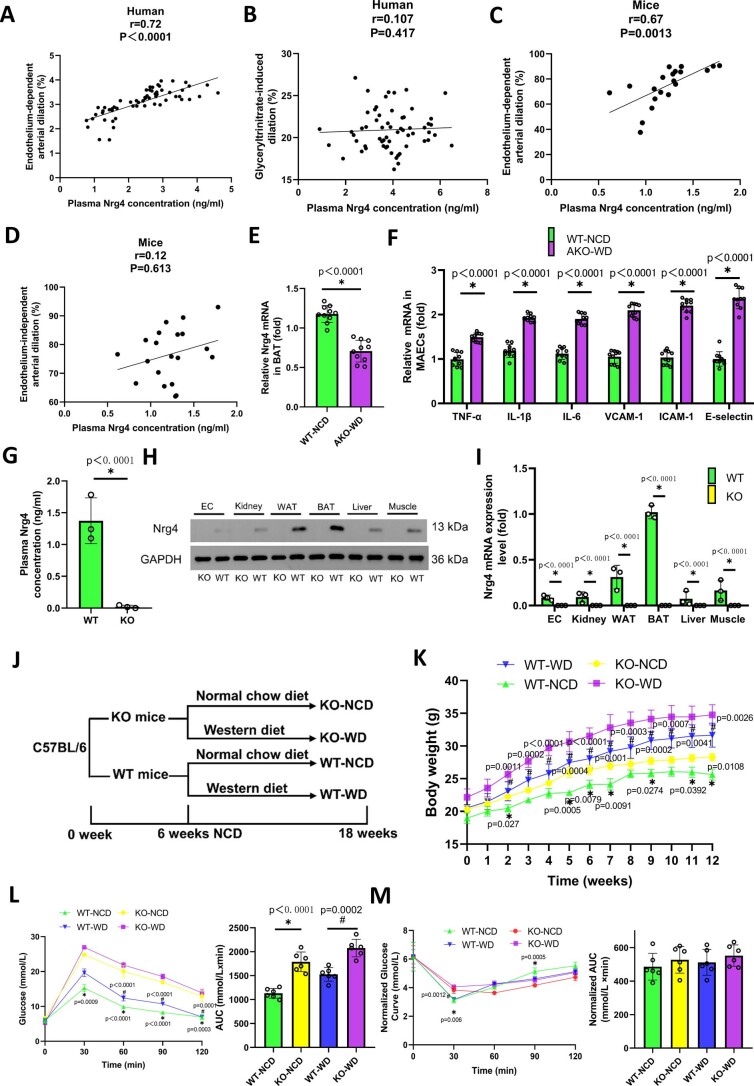
Brown adipose tissue (BAT) activity contributes to cardiovascular health by its energy-dissipating capacity but how BAT modulates vascular function and atherosclerosis through endocrine mechanisms remains poorly understood. Here we show that BAT-derived neuregulin-4 (Nrg4) ameliorates atherosclerosis in mice. BAT-specific Nrg4 deficiency accelerates vascular inflammation and adhesion responses, endothelial dysfunction and apoptosis and atherosclerosis in male mice. BAT-specific Nrg4 restoration alleviates vascular inflammation and adhesion responses, attenuates leukocyte homing and reduces endothelial injury and atherosclerosis in male mice. In endothelial cells, Nrg4 decreases apoptosis, inflammation and adhesion responses induced by oxidized low-density lipoprotein. Mechanistically, protein kinase B (Akt)-nuclear factor-κB signaling is involved in the beneficial effects of Nrg4 on the endothelium. Taken together, the results reveal Nrg4 as a potential cross-talk factor between BAT and arteries that may serve as a target for atherosclerosis.


Conflict of interest statement

The authors declare no competing interests.

Figures

Fig. 1
Fig. 1. Nrg4 deficiency is associated with endothelial injury and inflammation in mice.
KO and WT mice aged 6 weeks were divided into four groups (WT-NCD, KO-NCD, WT-WD and KO-WD) and were fed their respective diets for 12 weeks (6 mice in each group). a, Representative images of terminal deoxynucleotidyl transferase-mediated deoxyuridine triphosphate nick end labeling (TUNEL) staining in sections of thoracic aortas. TUNEL (apoptotic cells, red), anti-CD31 (endothelial cells, green) and 4′,6-diamidino-2-phenylindole (DAPI) (nuclei, blue). Arrows indicate CD31/TUNEL colocalization. Scale bars, 10 μm. b, The percentage of apoptotic endothelial cells (n = 6). c,d, The vasodilation responses to acetylcholine (Ach) (c) and sodium nitroprusside (SNP) (d) (n = 4). e, Representative electron microscopy images of endothelium. EC, endothelial cell; IEL, internal elastic lamina. Scale bars, 5 μm. f, The mRNA levels of inflammation (TNF-α, IL-1β and IL-6) and adhesion molecules (VCAM-1, ICAM-1 and E-selectin) in MAECs of mice (n = 6). P values were calculated by two-sided Student’s t-test (b,f) and two-sided Student’s t-test or one-way analysis of variance (ANOVA) with Tukey’s multiple-comparison test (c,d). The data are presented as mean ± s.e.m. #P < 0.05 versus WT-NCD; ##P < 0.01 versus WT-NCD; *P < 0.05 versus WT-WD; **P < 0.01 versus WT-WD. Source data
Fig. 2
Fig. 2. Nrg4 deficiency is associated with atherosclerotic plaque formation in AKO mice.
AKO and DKO mice aged 6 weeks were fed a WD for 12 weeks (6 mice in each group). a,b, The vasodilatation reaction induced by Ach (a) and SNP (b) (n = 4). c, Representative images of en face atherosclerotic lesions. d, Quantitative analysis of c (n = 6). e, Representative images of the cross-sectional area of the aortic root (n = 6). Scale bars, 200 μm. f, Quantitative analysis of e. g, Representative immunohistochemical staining images of VSMCs (α-smooth muscle actin (α-SMA)), collagen (Masson), macrophages (anti-CD68) and T lymphocytes (anti-CD3) in aortic plaques. Scale bar, 20 μm. h, Quantitative analysis of g (n = 6). I, Representative hematoxylin and eosin (H&E) staining images of plaque. Dashed lines indicate the contour of necrotic lipid core; scale bars, 50 μm. j, The quantitative analysis of necrotic core and fibrous cap thickness. The necrotic core is presented as a percentage of lesion area and the fibrous cap thickness is measured at the midpoint and shoulder regions of each lesion and quantified as the ratio of cap thickness to lesion size (n = 6). AU, arbitrary units. k, The expressions of matrix metalloproteinase (MMP) 2 and MMP9 in mice aortic tissue. l, Quantitative analysis of k (n = 6). m, The mRNA levels of adhesion molecules (VCAM-1, ICAM-1 and E-selectin) and inflammation (TNF-α, IL-1β and IL-6) in MAECs of mice (n = 6). Statistical significance was calculated using two-sided Student’s t-tests. The data are presented as mean ± s.e.m. *P < 0.05; #P < 0.01. Source data
Fig. 3
Fig. 3. BAT-derived Nrg4 deficiency accelerated endothelium injury and atherosclerosis.
Mice aged 6 weeks were fed a WD for 12 weeks (6 mice in each group). a, The vasodilatation reaction induced by Ach (n = 6). b, Representative images of TUNEL staining in sections of thoracic aortas (n = 6). Arrows indicate CD31/TUNEL colocalization. Scale bars, 100 μm. c, The percentage of apoptotic endothelial cells (n = 6). d, Representative electron microscopy images of endothelium. Scale bars, 5 μm. e, Representative images of en face atherosclerotic lesions. f, Quantitative analysis of e (n = 6). g, Representative images of the cross-sectional area of the aortic root (n = 6). Scale bars, 200 μm. h, Quantitative analysis of g. i, Representative immunohistochemical staining images of VSMCs (α-SMA), collagen (Masson), macrophages (anti-CD68) and T lymphocytes (anti-CD3) in aortic plaques. Scale bar, 20 μm. j, Quantitative analysis of I (n = 6). k, Representative H&E staining images of plaque. Dashed lines indicate the contour of the lipid core. Scale bars, 50 μm. l, The quantitative analysis of necrotic core and fibrous cap thickness. The necrotic core was presented as a percentage of lesion area and the fibrous cap thickness was measured at the midpoint and shoulder regions of each lesion and quantified as the ratio of cap thickness to lesion size (n = 6). m, The expressions of MMP2 and MMP9 in mice aortic tissue. n, Quantitative analysis of m (n = 6). Statistical significance was calculated using two-sided Student’s t-tests. The data are presented as the mean ± s.e.m. *P < 0.05; #P < 0.01. Source data
Fig. 4
Fig. 4. Nrg4 overexpression alleviated endothelial injury and inflammation and improved metabolic profiles in KO mice.
AAV-Nrg4 or AAV-Zsgreen at a dose of 1 × 1012 viral genomes were injected into the BAT in the interscapular region of KO mice at aged 6 weeks. a, Aortic vasodilatation induced by Ach in KO mice (n = 4). b, Representative images of TUNEL staining in sections of thoracic aortas. TUNEL (apoptotic cells, red), anti-CD31 (endothelial cells, green) and DAPI (nuclei, blue). Scale bars, 10 μm. c, The percentage of apoptotic endothelial cells (n = 6 biologically independent samples). d, Representative electron microscopy images of endothelium in KO mice (n = 6). Scale bars, 5 μm. e, The body weight of mice in different groups (n = 4). f, The mRNA levels of adhesion molecules (VCAM-1, ICAM-1 and E-selectin) and inflammation (TNF-α, IL-1β and IL-6) in MAECs of mice aged 18 weeks (n = 6). g, The lipid profiles in mice aged 18 weeks (n = 6). Statistical significance was calculated using two-sided Student’s t-tests or one-way ANOVA (Tukey’s multiple-comparison test). Data are shown as mean ± s.e.m. *P < 0.05 versus KO-AAV (Zsgreen); **P < 0.01 versus KO-AAV (Zsgreen); ***P < 0.001 versus KO-AAV (Zsgreen); #P < 0.05 versus KO-AAV (Zsgreen); ##P < 0.01 versus KO-AAV (Zsgreen); ###P < 0.001 versus KO-AAV (Zsgreen). Source data
Fig. 5
Fig. 5. Nrg4 overexpression alleviated atherosclerosis in mice.
AAV-Nrg4 or AAV-Zsgreen at a dose of 1 × 1012 viral genomes were injected into the BAT in the interscapular region of KO mice at aged 6 weeks. a, Representative images of en face atherosclerotic lesion areas in AKO and DKO mice. b, Representative images of the cross-sectional area of the aortic root in AKO and DKO mice. Scale bars, 200 μm. c, Quantitative analysis of a (n = 6). d, Quantitative analysis of b (n = 6). e, Representative immunohistochemical staining images of VSMCs (α-SMA), collagen (Masson), macrophages (anti-CD68) and T lymphocytes (anti-CD3) in aortic plaques. Scale bar, 20 μm. f, Quantitative analysis of e (n = 6). g, Representative H&E staining images of plaque. Dashed lines indicate the contour of the lipid core. Scale bars, 50 μm. h, The quantitative analysis of necrotic core and fibrous cap thickness. The necrotic core is presented as a percentage of lesion area and the necrotic lipid core and the fibrous cap thickness is measured at the midpoint and shoulder regions of each lesion and quantified as the ratio of cap thickness to lesion size (n = 6). i, The expressions of MMP2 and MMP9 in mice aortic tissue. j, Quantitative analysis of i (n = 6). Statistical significance was calculated using two-sided Student’s t-tests or one-way ANOVA (Tukey’s multiple-comparison test). Data are shown as mean ± s.e.m. *P < 0.05 versus AKO-AAV (Zsgreen); **P < 0.01 versus AKO-AAV (Zsgreen); ***P < 0.001 versus AKO-AAV (Zsgreen); #P < 0.05 versus DKO-AAV (Zsgreen); ##P < 0.01 versus DKO-AAV (Zsgreen); ###P < 0.001 versus DKO-AAV (Zsgreen); NS, not significant. Source data
Fig. 6
Fig. 6. The Nrg4 overexpression of BAT in situ decreased the leukocytes homing within aortic plaques in DKO mice.
Nrg4 overexpression of BAT in situ by AAV-Nrg4 was performed in DKO mice aged 6 weeks and leukocyte homing was analyzed in DKO-AAV (Zsgreen) or DKO-AAV (Nrg4) mice that were fed a WD for 12 weeks. a, The mRNA expression of the macrophage markers F4/80 and CD68 in aortas (n = 6). b, The mRNA expression of the chemokines in aortas (n = 6). c,d, The homing of GFP leukocytes to atherosclerotic plaques 48 h after intravenous injection into DKO-AAV (Zsgreen) and DKO-AAV (Nrg4) mice that were fed a WD for 12 weeks. c, Fluorescence micrograph of aortic root plaques. The dashed line indicates the plaque border. Inset, magnification of GFP leukocytes. DAPI (left); GFP (middle); merge (right). Scale bars, 200 μm. d, Quantification of GFP leukocytes per square millimeter of plaque (n = 6). e, The representative images of aortic arch sections stained with CD31 (red, as an endothelial marker), VCAM-1 or ICAM-1 (green) and DAPI (blue) (n = 6). Arrowheads indicate CD31/VCAM-1 or CD31/ICAM-1 colocalization. Scale bars, 150 μm. f, The mRNA expressions from MAECs of the aorta for VCAM-1 and ICAM-1 (n = 6). Statistical significance was calculated using two-sided Student’s t-tests. Data are shown as mean ± s.e.m. *P < 0.001. Source data
Fig. 7
Fig. 7. Nrg4 inhibited NF-κB signal in vivo and in vitro.
AAV-Nrg4 or AAV-Zsgreen at a dose of 1 × 1012 viral genomes were injected into the BAT in the interscapular region of KO mice at aged 6 weeks and then were fed WD or NCD for 12 weeks. a, KEGG pathway analysis indicated the altered function of NF-κB signaling pathway. b, Heat map of the NF-κB pathway and apoptosis-associated genes. c, The expression levels of NF-κB signaling in MAECs of KO and WT mice. d, The expression levels of NF-κB signaling in MAECs of KO and WT mice with or without the overexpression of Nrg4. e, Quantitative analysis of c (n = 6). f, Quantitative analysis of d (n = 6). g, The expression of p65 and P-p65 in MAECs nucleus or cytoplasm under the presence or absence of rNrg4. h, Quantitative analysis of g (n = 5 independent experiments). I, The p65 nuclear translocation in MAECs. Scale bar, 50 μm. P values were calculated by two-sided Student’s t-test or one-way ANOVA with Tukey’s multiple-comparison test. Data are shown as mean ± s.e.m. *P < 0.001. Source data
Fig. 8
Fig. 8. Graphical abstract. Schematic showing that Nrg4 plays a protective role in atherosclerosis via ErbB4–Akt–NF-κB signaling pathway.
This work describes that BAT-derived Nrg4 serves as a potential cross-talk factor between BAT and arteries and attenuates endothelial inflammation or adhesion responses, inhibits leukocyte homing and reduces endothelial injury or atherosclerosis in a manner involving Akt–NF-κB signaling. Thus, BAT-derived Nrg4 may become a new therapeutic drug for atherosclerosis and BAT could serve as a new target for atherosclerosis.
Extended Data Fig. 1
Extended Data Fig. 1. Decreased Nrg4 resulted in increased endothelial dysfunctions and impaired metabolic profiles.
(A-D)The correlation between plasma Nrg4 and vascular endothelium-dependent (A) and -independent (B) dilation function in human (n = 60) and mice (n = 10) (C, D). (E) The levels of BAT Nrg4 mRNA in mice (n = 10, *P < 0.001). (F) The levels of inflammatory cytokines and adhesion molecules mRNA levels in MAECs of aortas (n = 10 biologically independent animals, *P < 0.001). (G) The level of Nrg4 in blood and Nrg4 protein expression in BAT, kidney, WAT, liver, muscle and endothelium cells (EC) (H) in KO and WT mice (n = 3, *P < 0.001). (I)The mRNA expression of Nrg4 in the same tissues in (H) (n = 3, *P < 0.001). (J) The experiment schedule for the effects of Nrg4 deficiency on endothelial function, endothelial inflammation and metabolic profiles in WT and KO mice (6 mice in each group). (K) Body weight (n = 6, *P < 0.01 vs. KO-NCD; #P < 0.01 vs. KO-WD). (L) Results of GTT (n = 6) and the AUC for GTT using the trapezoidal rule (*P < 0.01 vs. KO-NCD; #P < 0.01 vs. KO-WD). (M) Results of normalized ITT as a percentage of fasting glucose (n = 6) and the AUC for ITT (*P < 0.01 vs. KO-NCD; #P < 0.01 vs. KO-WD). KO and WT mice aged 6 weeks were divided into four groups (WT-NCD, KO-NCD, WT-WD and KO-WD) and were fed their respective diets for 12 weeks (6 mice in each group). For a, b, c, d, Pearson correlations were used to identify correlations between variables. For e, f, g, i, p values were calculated by two-sided t-test. For k, l, m, p values were calculated by two-sided t-test or one-way ANOVA with Tukey’s multiple-comparison test. Data were shown as mean ± SEM. Source data
Extended Data Fig. 2
Extended Data Fig. 2. Improved energy metabolism in mice and Nrg4 alleviated inflammation and adhesion response in MAECs.
(A) The weight of inguinal WAT (iWAT), epididymal WAT (eWAT) and interscapular BAT (iBAT) in WT and KO mice aged 18 weeks (n = 6, *P < 0.001 vs. WT-NCD; #P < 0.001 vs. WT-WD.). (B) The weekly food intake of WT and KO mice (n = 6, *P < 0.001 vs. WT-NCD; #P < 0.001 vs. WT-WD.). (C) The energy expenditure of WT and KO mice aged 18 weeks (n = 6, *P < 0.001 vs. WT-NCD; #P < 0.001 vs. WT-WD). (D) Schematic of the transgenic construct used to generate BAT-specific Nrg4 knockout animals. (E) Nrg4 expression in EC, kidney, WAT, BAT and liver from BKO and WT mice (n = 3, *P < 0.001). (F) The mRNA levels of adhesion molecules (VCAM-1, ICAM-1, and E-selectin) and inflammation cytokines (TNF-α, IL-1β, and IL-6) (n = 6, *P < 0.001). (G) Representative images of binding of IRB-NHS-Nrg4 to endothelium in thoracic aorta in vivo. Nrg4 (red), anti-CD31 (endothelial cells, green) and 4′,6-diamidino-2-phenylindole (DAPI) (nuclei; blue). Arrowheads indicate CD31/IRB-NHS-Nrg4 colocalization. Scale bar, 20μm (n = 3 biologically independent samples). (H) Representative bioluminescence images of mice aged 14 weeks injected AAV-Zsgreen (n = 6). (I) The circulating Nrg4 concentration weekly in KO mice after AAV intervention (n = 3). (J) The experiment schedule for the effects of Nrg4 overexpression on endothelial function, endothelial inflammation and metabolic profiles in mice (6 mice in each group). KO and WT mice aged 6 weeks were divided into four groups (WT-NCD, KO-NCD, WT-WD and KO-WD) and were fed their respective diets for 12 weeks (6 mice in each group). AAV-Nrg4 or AAV-Zsgreen at a dose of 1 × 1012 viral genomes were injected into the BAT in the interscapular region of KO mice at aged 6 weeks. Statistical significance was calculated using two-sided t-tests. Data were shown as mean ± SEM. Source data
Extended Data Fig. 3
Extended Data Fig. 3. BAT-derived Nrg4 improved metabolic profiles, alleviated endothelial dysfunction and inflammation or adhesion response in mice.
(A) The Nrg4 protein level in BAT, eWAT, iWAT and liver of mice in KO-AAV (Nrg4) groups (n = 3). (B) Results of GTT (n = 6) and the AUC for GTT (*P < 0.001, n = 6). (C) Normalized the AUC for ITT as a percentage of fasting glucose and the AUC for it (*P < 0.001, n = 6). (D) The energy expenditure of mice aged 18 weeks in different groups (n = 6, *P < 0.001). (E) The blood Nrg4 level in mice of different groups (n = 6). (F) The Ach induced aortic vasodilatation of mice in different groups (n = 6). (G) The experiment schedule for the effects of Nrg4 overexpression in BAT in situ in both AKO and DKO mice (6 mice in each group). (H) The experiment schedule for BATT in KO recipients (n = 6 in each group). (I) The mRNA levels of adhesion molecules (VCAM-1, ICAM-1, and E-selectin) and inflammation (TNF-α, IL-1β, and IL-6) (n = 6). ((E), (F), (I): *P < 0.01 versus DKO-AAV(Zsgreen), #P < 0.05 versus AKO-AAV(Zsgreen). *P < 0.05 vs. AKO-AAV(Zsgreen); **P < 0.01 vs. AKO-AAV(Zsgreen); ***P < 0.001 vs. AKO-AAV(Zsgreen); #P < 0.05 vs. DKO-AAV(Zsgreen); ##P < 0.01 vs. DKO-AAV(Zsgreen); ###P < 0.001 vs. DKO-AAV(Zsgreen)). (J) The confirmation experiments for circulating expression of Nrg4 in BATT KO recipients. All mice aged 12 weeks were treated with BATT and then fed a WD for 12 weeks (n = 3). (K) The experiment schedule for BATT in AKO and DKO mice (n = 6 in each group). (L) Results of GTT (n = 6). (M) The AUC for GTT (n = 6). (N) Normalization ITT as a percentage of fasting glucose. (O) The AUC for (N) (n = 6). (P) The energy expenditure of mice aged 24 weeks. (n = 6). (L-P: *P < 0.05 vs. BATT(KO); **P < 0.01 vs. BATT(KO); ***P < 0.001 vs. BATT(KO); #P < 0.05 vs. BATT(KO); ##P < 0.01 vs. BATT(KO); ###P < 0.001 vs. BATT(KO)). Statistical significance was calculated using two-sided t-test or one-way ANOVA with Tukey’s multiple-comparison test. Data were shown as mean ± SEM. Source data
Extended Data Fig. 4
Extended Data Fig. 4. BAT transplantation (BATT) from WT donor alleviated endothelial injury, inflammation and atherosclerosis, and improved metabolic profiles in mice.
(A) Representative images of TUNEL staining in sections of thoracic aortas. TUNEL (apoptotic cells, red), anti-CD31 (endothelial cells, green), DAPI (nuclei, blue). Arrows indicate CD31/TUNEL colocalization. Scale bars, 10μm. (B) The percentage of apoptotic endothelial cells (n = 6). (C) The aortic vasodilatation induced by Ach in mice aged 24 weeks (n = 6). (D) Representative electron microscopy images of endothelium in mice. Scale bars, 5μm (n = 6). (E) The mRNA levels of adhesion molecules (VCAM-1, ICAM-1 and E-selectin) and inflammation (TNF-α, IL-1β and IL-6) in MAECs of mice aged 24 weeks (n = 6). (F) Body weight (n = 6) after BATT weekly (n = 6). (G) The lipid profiles of mice aged 24 weeks among different groups (n = 6). (H) Representative images of en face atherosclerotic lesion areas in AKO and DKO mice. (I) Representative images of the cross-sectional area of the aortic root in AKO and DKO mice. Scale bars, 200μm. (J) Quantitative analysis of (H) (n = 6). (K) Quantitative analysis of (I) (n = 6). (L) Representative immunohistochemical staining images of VSMCs [α–smooth muscle actin (α-SMA)], collagen (Masson), macrophages (anti-CD68), and T lymphocytes (anti-CD3) in aortic plaques. Scale bar, 20 μm. (M) Quantitative analysis of (L) (n = 6). (N) Representative H&E staining images of plaque. A necrotic lipid core is indicated by *; dashed lines indicate the contour of the lipid core; scale bars: 50 μm. (O) The quantitative analysis of necrotic core and fibrous cap thickness. The necrotic core was presented as a percentage of lesion area and the fibrous cap thickness was measured at the midpoint and shoulder regions of each lesion and quantified as the ratio of cap thickness to lesion size (n = 6). (P) The expressions of MMP2 and MMP9 in mice aortic tissue. (Q) Quantitative analysis of (P) (n = 6). For b, c, e, f, and g, P values were calculated by one-way ANOVA with Tukey’s multiple-comparison test. For j, k, m, o and q, P values were calculated by two-sided t-test. Data were shown as mean ± SEM. *P < 0.05; **P < 0.01; ***P < 0.001. Source data
Extended Data Fig. 5
Extended Data Fig. 5. Brown adipocytes (BA) or rNrg4 reduced apoptosis, adhesion and inflammatory responses in MAECs.
(A) Representative images of apoptotic cells in MAECs. (B) The percentage analysis of apoptotic cells of (A). (C and D) Expressions of bax, bcl-2 and cleaved-caspase 3 in MAECs. (E) The mRNA levels of adhesion molecules and inflammatory cytokines in lysate of MAECs. (F) MTT assay for the optimum intervention condition of ox-LDL. (G) MTT assay for the optimum treatment condition of rNrg4. (H) Representative images of apoptotic cells by flow cytometry assay in MAECs and the percentage analysis of apoptotic cells (I). (J) Expressions of bax, bcl-2 and cleaved-caspase 3 in MAECs. (K) MEACs permeability. (L) The mRNA levels of adhesion molecules and inflammatory cytokines in lysate of MAECs. The BA were obtained from WT or KO mice. The co-culture BA experiment was a noncontact co-cultured assay through a transwell 24-well plate for 48 h treatment. The MAECs from WT mice were pretreated with rNrg4 100 ng/ml for 48 h and ox-LDL 100 μg/ml for 12 h. Each experiment was repeated 5 times. Statistical significance was calculated using one-way ANOVA with Tukey’s multiple-comparison test. Data were shown as mean ± SEM. *P < 0.001. Source data
Extended Data Fig. 6
Extended Data Fig. 6. Nrg4 decreased inflammation and migration in macrophages, and inhibited endothelial NF-κB signal through ErbB4 receptor in vivo.
(A) Representative migration images of macrophage. Scale bar, 100μm. (B) Quantitative analysis of (A). (C) The expression levels of NF-κB signaling in MAECs in vitro. (D) Quantitative analysis of (C). (E) The levels of TNF-α, IL-1β and IL-6 in the supernatant, and the mRNA levels in lysate of macrophages. (F) Schematic of the transgenic construct used to generate endothelial-specific ErbB4 knockout animals. (G) The experiment schedule for the effects of the overexpression of Nrg4 in BAT in situ on the protection of endothelial injury in KO and CKO/KO mice (6 mice in each group). (H) MAECs were derived from CKO and WT mice. ErbB4 and VEGFR2 (vascular endothelial growth factor receptor 2) protein expression in MAECs and unselected cell lysates (n = 3). (I) ErbB4 expression in EC, BAT and liver from CKO and WT mice (n = 3). (J) The expression levels of MAECs NF-κB signaling in WT and KO mice with or without overexpression of Nrg4 (n = 6). (K) Quantitative analysis of (J). (L) The expression levels of MAECs NF-κB signaling in WT and CKO/KO mice with or without overexpression of Nrg4 (n = 6). (M) Quantitative analysis of (L). For the macrophages transwell migration assay, the RAW264.7 cells were treated by ox-LDL 100ug/ml for 12 h under the condition with or without rNrg4 100 ng/ml for 48 h. The overexpression of Nrg4 in BAT in situ was performed in KO or CKO/KO mice aged 6 weeks and then fed a WD for 12 weeks (6 mice in each group). For b, k, and m, P values were calculated by two-sided t-test. For d and e, P values were calculated by one-way ANOVA with Tukey’s multiple-comparison test. Data were shown as mean ± SEM. Each experiment was repeated 5 times.*P < 0.001. Source data
Extended Data Fig. 7
Extended Data Fig. 7. ErbB4/Akt signal involved in the protective effect of Nrg4 on endothelium.
(A) The confirmation of Nrg4 and endothelial ErbB4 knockout in CKO/KO mice (n = 2). (B) The mRNA levels of inflammatory cytokines in MAECs of mice from different groups (n = 6). (C) The Ach induced aortic vasodilatation of mice in different groups (n = 6). (D) Representative electron microscopy images of the endothelium. Scale bars, 5μm (n = 6). (E) Representative images of TUNEL staining in sections of thoracic aortas (n = 6). Arrows indicate CD31/TUNEL colocalization. Scale bars, 100μm. (F) The experiment schedule for the effects of the overexpression of Nrg4 in BAT in situ on the alleviation of atherosclerosis in mice (6 mice in each group). (G) Representative images of en face atherosclerotic lesion areas in AKO and CKO/AKO mice. (H) Quantitative analysis of (G) (n = 6). (I) Representative images of the cross-sectional area of the aortic root in AKO and CKO/AKO mice. Scale bars, 200μm. (J) Quantitative analysis of (I) (n = 6). (K and L) The levels of Akt, MAPK, ERK, IKK signaling proteins expression in the MAECs of KO (A) and CKO/KO (B) mice after 12 weeks of interventions (n = 6). (M and N) Quantitative analysis of (K) and (L), respectively (n = 6). (O) The confirmation of ErbB4 knockdown in MAECs by ErbB4 siRNA cocktail. (P) Quantitative analysis of (O) (n = 3). Statistical significance was calculated using one-way ANOVA with Tukey’s multiple-comparison test. Data are presented as mean ± SEM. *P < 0.001; #P < 0.05 vs.WT-NCD, WT-WD and KO-AAV(Nrg4); ##P < 0.001 vs.WT-NCD, WT-WD and KO-AAV(Nrg4); P < 0.001 CKO/KO-AAV(Zsgreen) or CKO/KO-AAV(Nrg4) vs. WT-NCD or WT-WD. Source data
Extended Data Fig. 8
Extended Data Fig. 8. Nrg4 inhibited inflammation and adhesion response in MAECs via ErbB4/Akt/NF-κB signal in vitro.
(A) The levels of IκBα, P-IκBα, Akt, p-Akt, p65 and P-p65 expressions in the MAECs under different conditions. (B) Quantitative analysis of P-Akt, P-IκBα and P-p65 in (A). GAPDH was used as a loading control. (C) The levels of VCAM-1, ICAM-1, E-selectin, IL-1β, IL-6 and TNF-α expressions in the MAECs under different conditions. (D) Cells were seeded onto transwell chambers. Confluent cells were treated with rNrg4 or ox-LDL, and FITC-labelled dextran that migrated through the MAECs monolayer was measured. The data represent the mean fluorescence intensity±SEM. (E) THP-1 monocytes were stained with calcein green and adhered to ox-LDL activated MAECs for 30 min. Fluorescence microscopy was used to measure the number of adherent THP-1 monocytes per microscopic field (x100). (F) Representative images of apoptotic cells in MAECs. (G) Quantitative analysis of (F). (H) The vasodilation responses of human arterial rings to Ach (n = 3). (I, J) NF-κB -luciferase and SV40-Renilla were transfected into MAECs after treatment with si-Control, si-ErbB4 (I), or si-Akt-scramble, si-Akt (J). Cells were left untreated or treated with rNrg4, or/ and ox-LDL before luciferase and Renilla assessment. (K-M) MAECs from WT mice were transfected with si-control and si-ErbB4, then treated with or without rNrg4, or/ and ox-LDL, and IgG, p65 and histone antibodies were used for ChIP assay, and RT–PCR was performed to amplify (K) VCAM-1, (L) E-selectin and (M) IkBa promoters. (N-P) MAECs from WT mice were transfected with si-Akt-scramble and si-Akt, then treated with or without rNrg4, or/ and ox-LDL, and IgG, p65 and histone antibodies were used to ChIP and RT–PCR was performed to amplify (N) VCAM-1, (O) E-selectin and (P) IkBa promoters. MAECs from WT mice were pre-treated with si-RNA, then rNrg4 for 48 h, ox-LDL for 12 h or SC79 for 6 h. For b, c, g and h, P values were calculated by one-way ANOVA with Tukey’s multiple-comparison test. For d, e, i-p, P values were calculated by two-sided t-test or one-way ANOVA with Tukey’s multiple-comparison test. Each experiment was repeated 5 times. *P < 0.01, **P < 0.001, #P < 0.05 vs. Ox-LDL group, ##P < 0.01 vs. Ox-LDL group, ###P < 0.001 vs. Ox-LDL group, P < 0.05 vs. Nrg4 group, ††P < 0.01 vs. Nrg4 group, ††† P < 0.001 vs. Nrg4 group. Source data

Comment in

References

    1. Libby, P. et al. Atherosclerosis. Nat. Rev. Dis. Prim.5, 56 (2019). - PubMed
    1. Xu, Y. et al. Hepatocyte ATF3 protects against atherosclerosis by regulating HDL and bile acid metabolism. Nat. Metab.3, 59–74 (2021). - PMC - PubMed
    1. Jian, D. et al. METTL14 aggravates endothelial inflammation and atherosclerosis by increasing FOXO1 N6-methyladeosine modifications. Theranostics10, 8939–8956 (2020). - PMC - PubMed
    1. Zhu, Y. et al. Research progress on the relationship between atherosclerosis and inflammation. Biomolecules8, 80 (2018). - PMC - PubMed
    1. Gimbrone, M. A. Jr. & García-Cardeña, G. Endothelial cell dysfunction and the pathobiology of atherosclerosis. Circ. Res.118, 620–636 (2016). - PMC - PubMed

Publication types