. 2022 Nov;4(11):1591-1610.
doi: 10.1038/s42255-022-00674-x. Epub 2022 Nov 18.

Single-cell profiling of vascular endothelial cells reveals progressive organ-specific vulnerabilities during obesity

Affiliations

Single-cell profiling of vascular endothelial cells reveals progressive organ-specific vulnerabilities during obesity

Olga Bondareva et al. Nat Metab. 2022 Nov.

Abstract

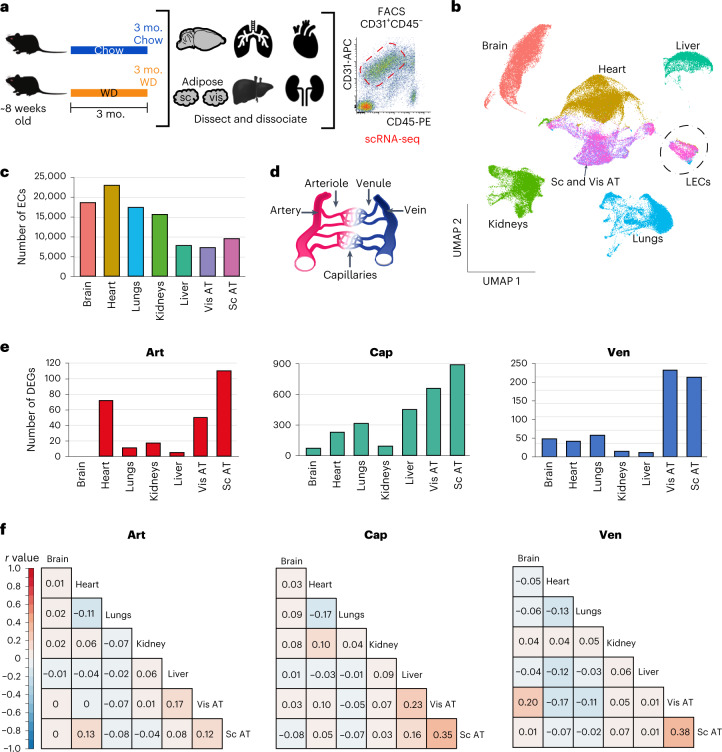
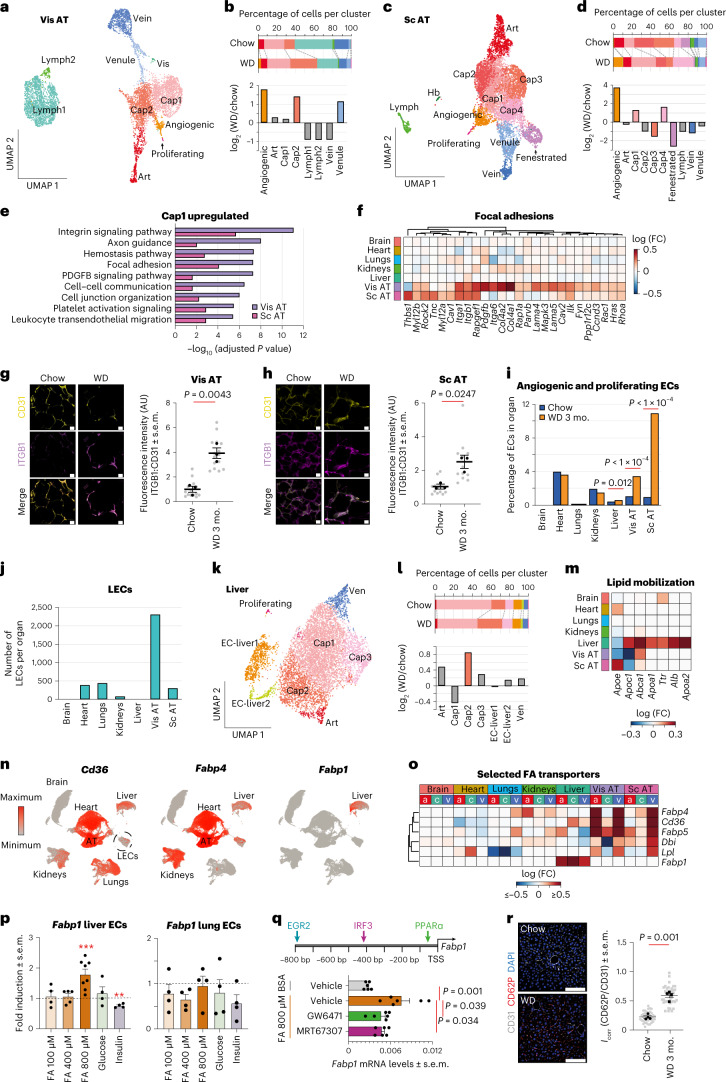
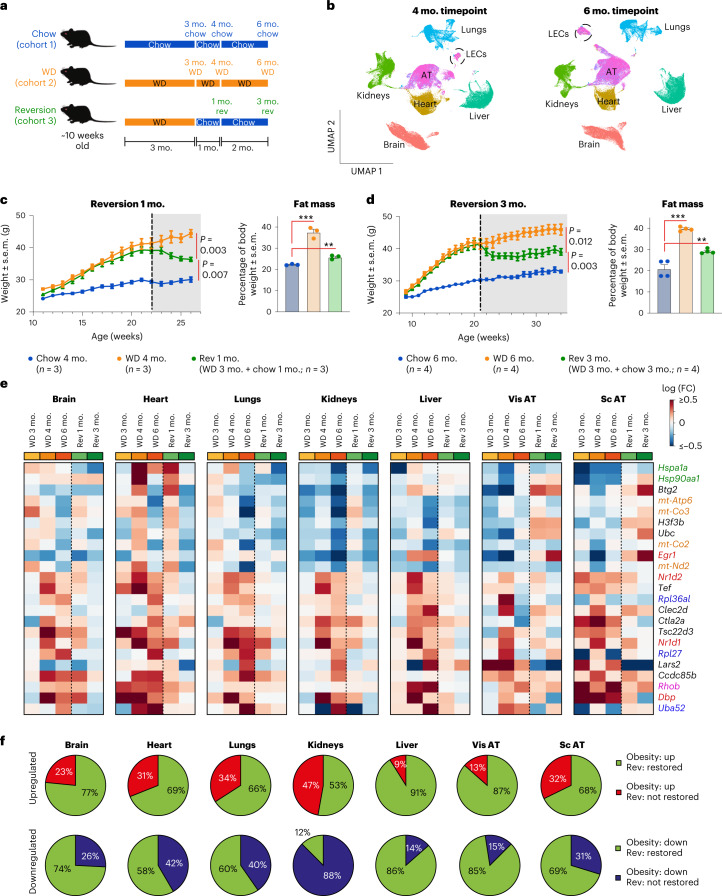
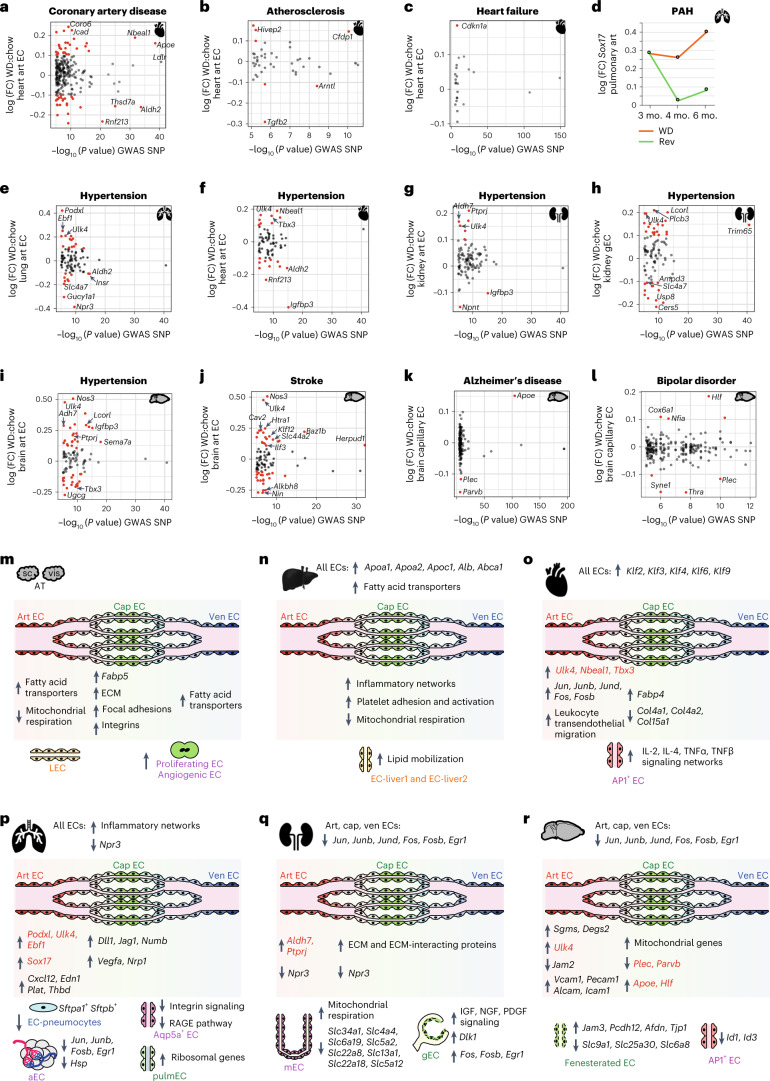
Obesity promotes diverse pathologies, including atherosclerosis and dementia, which frequently involve vascular defects and endothelial cell (EC) dysfunction. Each organ has distinct EC subtypes, but whether ECs are differentially affected by obesity is unknown. Here we use single-cell RNA sequencing to analyze transcriptomes of ~375,000 ECs from seven organs in male mice at progressive stages of obesity to identify organ-specific vulnerabilities. We find that obesity deregulates gene expression networks, including lipid handling, metabolic pathways and AP1 transcription factor and inflammatory signaling, in an organ- and EC-subtype-specific manner. The transcriptomic aberrations worsen with sustained obesity and are only partially mitigated by dietary intervention and weight loss. For example, dietary intervention substantially attenuates dysregulation of liver, but not kidney, EC transcriptomes. Through integration with human genome-wide association study data, we further identify a subset of vascular disease risk genes that are induced by obesity. Our work catalogs the impact of obesity on the endothelium, constitutes a useful resource and reveals leads for investigation as potential therapeutic targets.


Conflict of interest statement

M.B. received honoraria as a consultant and speaker from Amgen, AstraZeneca, Bayer, Boehringer-Ingelheim, Lilly, Novo Nordisk, Novartis and Sanofi. All other authors declare no competing interests.

Figures

Fig. 1
Fig. 1. Obesity induces organ-specific changes in ECs.
a, Experimental design; n = 3 animals per group. The FACS plot shows exemplary gating for CD31+CD45low cells; sc, subcutaneous; vis, visceral; mo., months. b, Uniform manifold approximation and projection (UMAP) clustering of ECs from seven organs of mice on a WD or chow diet after filtering. Colors correspond to the organ from which the ECs were derived. Each dot represents a single EC; n = 3 animals per diet. c, Number of ECs analyzed from each organ after filtering out low-quality cells and non-ECs. d, Schematics of major vessel types. e, Number of DEGs (adjusted P value of <0.05 and | log (fold change (FC)) | > 0.1) in ECs from the different organs of obese versus control mice in (1) art, (2) cap and (3) ven. f, Correlation of gene expression changes in obese versus control conditions across art, cap and ven ECs. Genes showing a | log (FC) | > 0.1 in any tissue for the indicated EC population were used to collate the list of genes used for these analyses. A Pearson r value for each comparison is provided. Adjusted P value indicates adjustments for multiple comparisons using the Benjamini–Hochberg method (e). Source data
Fig. 2
Fig. 2. Obesity induces ECM remodeling, angiogenesis and lipid transporters in AT and liver ECs.
a, UMAP clustering of visceral AT ECs. b, Shifts in EC populations in visceral AT. Populations showing a greater than twofold change in obesity are highlighted in color. c, UMAP clustering of subcutaneous AT ECs. d, Shifts in EC clusters in subcutaneous AT. Populations showing a greater than twofold change in obesity are highlighted in color. e, BioPlanet-annotated pathways upregulated in visceral and subcutaneous AT cap1 ECs in obesity. Significantly upregulated (adjusted P value of <0.05) genes were used for these analyses. f, Expression changes in focal adhesion-related genes in cap ECs in obese versus control animals. g,h, Immunostaining of integrin-β1 (ITGB1) and CD31 in visceral (g) and subcutaneous AT (h); n = 3 animals per group (black dots); n = 4 to 5 sections per animal (gray dots); scale bars, 20 µm; AU, arbitrary units. i, Quantification of proliferating and angiogenic ECs. Data were analyzed using a two-sided χ2 test. j, Number of LECs detected per organ. k, UMAP clustering of liver ECs. l, Shifts in EC liver populations. Populations showing a log2 (WD/chow) > 0.5 change are highlighted in color. m, Changes in select lipid mobilization genes in cap ECs of obese animals. n, UMAPs showing enrichment of fatty acid transporters. o, Changes in fatty acid (FA) transporters in art (a), cap (c) and ven (v) ECs in obesity. p, Fabp1 mRNA expression in response to free fatty acids, glucose and insulin; n = 4–8 replicates per group. Treatments were compared against BSA-treated controls; **P = 0.003 and ***P = 0.0003. q, Predicted transcription factor binding sites in the Fabp1 promoter (top) and impact of PPARα (GW6471) and TBK1/IKKε (MRT67307) inhibitors on fatty acid-driven Fabp1 activation (bottom); n = 6 replicates per group; bp, base pairs; TSS, transcription start site. r, Colocalization of CD62P and CD31 in livers from obese versus control mice; n = 4 animals per group (black dots); n = 10 sections per animal (gray dots); scale bars, 100 µm. Data in g, h, p, q and r are presented as mean ± s.e.m. and were analyzed using a two-sided Student’s t-test. Expression data in p and q were standardized to Gapdh and Rplp0. The adjusted P value indicates adjustments for multiple comparisons using the Benjamini–Hochberg method (e). Source data
Fig. 3
Fig. 3. Obesity triggers deregulation of metabolic and inflammatory networks in subsets of cardiac, lung, kidney and brain ECs.
a, UMAP clustering of cardiac ECs. b, Shifts in cardiac EC populations. Populations showing a log2 (WD/chow) > 0.3 change are highlighted in color. c, BioPlanet-annotated pathways upregulated in cardiac arterial ECs in obesity. The top 100 genes, ranked by fold change, were used for these analyses. d, Obesity-associated changes in the expression of AP1 transcription factor subunits. e, Obesity-associated gene expression changes in KLF-family transcription factors. f, UMAP clustering of lung ECs. g, Obesity-associated shifts in lung EC clusters. Populations showing a log2 (WD/chow) > 0.5 change are highlighted in color. h, FISH images showing overlap of typical pneumocyte markers (Lyz2, Sftpa1 and Sftpb) and EC marker (Pecam1). Double-positive cells are marked with arrows. Data were reproduced in three chow and three obese animals; scale bars, 5 µm. i, Changes in the expression of histocompatibility 2 (H2) genes in obesity. j, MSigDB-annotated pathways upregulated in aEC in obesity. The top 100 genes, ranked by fold change, were used for these analyses. k, UMAP clustering of kidney ECs; Ang, angiogenic. l, BioPlanet-annotated pathways upregulated in mEC2 cells in obesity. The top 100 genes, ranked by fold change, were used for these analyses; TCA, tricarboxylic acid. m, Top metabolic DEGs in mEC2 cells in obesity. n, Obesity-associated changes in the expression of AP1 transcription factor subunits. o, Quantification of DLK1 in gECs; n = 3 animals per group (black dots) and n = 10 images per animal (gray dots); scale bars, 20 µm. p, UMAP clustering of brain ECs. q, Obesity-associated changes in the expression of AP1 transcription factor subunits. r,s, Gene expression changes in select leukocyte adhesion (marked in red), tight junction (blue), adherens junction (green) and gap junction genes (black) in art (r) and fenestrated ECs (s) in obesity. t, Uptake of dextran dyes in the choroid plexus (CP); n = 5 animals per group (black dots); n = 4 sections per animal (gray dots); scale bars, 20 µm. Data in o and t are presented as mean ± s.e.m. and were analyzed using a two-sided Student’s t-test. The adjusted P value indicates adjustments for multiple comparisons using the Benjamini–Hochberg method (c, j and l). Source data
Fig. 4
Fig. 4. Switching obese animals to a healthy diet modifies trajectory of animal weight, fat mass and the EC transcriptome.
a, Experimental design. For the reversion group (cohort 3), animals were fed a WD for 3 months and switched to a chow diet. Data for the 3-month chow and WD timepoints are from Figs. 1–3; rev, reversion. b, UMAPs of all ECs analyzed at the 4-month and 6-month timepoints after filtering out low-quality and non-ECs. c,d, Weights and percent body fat mass of animals analyzed at the 4-month (c) and 6-month (d) timepoints. The dotted line indicates when the WD was switched to a chow diet in reversion animals. Data are presented as mean ± s.e.m.; ***P = 0.0005 and **P = 0.0029 (c); ***P = 7.56 × 10−5 and **P = 0.0062 (c,d; two-sided Student’s t-test). e, Heat map representing genes most commonly impacted in cap ECs across organs in obesity and after reversion diet. The list of genes was generated based on the 6-month WD timepoint. The following genes are marked: translation-related genes (blue), transcription regulators (red), stress response genes (green), electron respiratory chain genes (orange) and signaling molecules (pink). Data were standardized to the appropriate chow control at each timepoint. f, Proportion of up- and downregulated genes in cap ECs that retain the obesity transcriptional profile or change their trajectory toward a healthier profile in the reversion group (cohort 3). Gene expression changes after 6 months of a WD were compared to the 3-month reversion timepoint. Data for both WD and reversion groups were standardized to chow controls at each timepoint. ‘Restored’ indicates genes in the reversion group that show expression levels more similar to the chow versus WD group. Source data
Fig. 5
Fig. 5. Improved trajectories of ECM components in AT ECs and of metabolic and inflammatory networks in liver ECs in the reversion group.
a, Changes in the proportion of angiogenic and proliferating ECs in visceral AT and subcutaneous AT in WD-treated and reversion cohorts. Data are presented relative to chow controls at each timepoint. b, GO cellular component pathways upregulated in AT cap ECs in obesity, which switch toward chow levels in the reversion group. c, Gene expression changes in focal adhesion genes in cap ECs in visceral and subcutaneous AT. d, Gene expression changes in fatty acid transporters in art, cap and ven ECs in the visceral and subcutaneous AT. e, DEGs (adjusted P value of <0.05 and | log (FC) | > 0.1) in hepatic cap ECs at the 6-month timepoint. Genes that show a restored transcriptional profile in the reversion group are indicated. f, BioPlanet-annotated pathways upregulated in cap ECs in obesity (adjusted P value of < 0.05 and log (FC) > 0.1), which are restored toward chow levels in the reversion group. g, Expression of Vcam1, Icam1, Cxcl9 and Cxcl10 in WD and reversion groups in liver cap ECs. h, BioPlanet-annotated pathways downregulated in hepatic cap ECs in obesity (adjusted P value of <0.05 and log (FC) < 0.1), which are restored toward healthy chow levels in the reversion group. i, Gene expression changes in fatty acid transporters in liver art, cap and ven ECs. j, Expression of Apoc1, Apoa2, Apoc3 and Ldlr in WD and reversion groups in liver cap ECs. k, UMAPs showing coexpression of endothelial markers (Pecam1 and Flt1) and platelet markers (Pf4, Ppbp and Nrgn) in the liver EC-platelet population, which is marked by the black arrow. l, Percentage of ECs positive for Pf4, Ppbp or Nrgn in liver in chow, WD and reversion cohorts at each timepoint. The adjusted P value indicates adjustments for multiple comparisons using the Benjamini–Hochberg method (b, f and h). Source data
Fig. 6
Fig. 6. Partial improvement in trajectories of obesity-induced gene expression changes in heart, lung, kidney and brain ECs by a reversion diet.
a, Changes in the gene expression levels of AP1 transcription factor subunits in arteriole ECs in obesity and reversion conditions. b, DEGs associated with ECM organization, including Col4a1, Col4a2, Col15a1 and Nrp2, in cardiac cap ECs. c, Gene expression changes in Klf genes in cardiac art, cap and ven ECs of obese and reversion animals. d, Quantification of the EC-pneumocyte population as a proportion of all lung ECs. e, MSigDB-curated pathways upregulated in obesity in lung cap ECs (adjusted P value of <0.05 and log (FC) > 0.1), which show improved trajectory in the diet reversion group. f, Expression levels of select inflammation-associated genes upregulated in lung cap and art ECs in obesity. g, Gene expression changes in members of the fourth mitochondrial respiratory chain complex in the aEC population. h, Gene expression changes in AP1 transcription factor subunits in kidney art, cap and ven ECs of obese and reversion animals. i, Differential expression of genes encoding mitochondrial respiration subunits in the kidney mEC2 population. Select genes are indicated. Data were standardized to the chow control group at each timepoint. j, BioPlanet-annotated pathways upregulated in brain cap ECs in obesity (adjusted P value of <0.05 and log (FC) > 0.1), showing an improved trajectory in the reversion group. k, Expression of select leukocyte adhesion genes in brain art ECs. Adjusted P values in e and j indicate adjustments for multiple comparisons using the Benjamini–Hochberg method. Source data
Fig. 7
Fig. 7. Integration of human GWAS data reveals vascular disease risk genes that are induced by obesity.
a, Comparison of known high-risk variants (identified via GWAS) for coronary artery disease with obesity-induced gene expression changes in heart art ECs at the 6-month timepoint. b, Comparison of known high-risk variants for atherosclerosis with obesity-induced gene expression changes in heart art ECs at the 6-month timepoint. c, Comparison of known high-risk variants for heart failure with obesity-induced gene expression changes in heart art ECs at the 6-month timepoint. d, Expression levels of Sox17, the most significant genetic risk factor for pulmonary arterial hypertension (PAH), in pulmonary art ECs in obesity and after reversion. ei, Comparison of known high-risk variants for hypertension with obesity-induced gene expression changes in lung art (e), heart art (f), kidney art (g), kidney gEC (h) and brain art (i) ECs at the 6-month timepoint. j, Comparison of known high-risk variants for stroke with obesity-induced gene expression changes in brain art ECs at the 6-month timepoint. k, Comparison of known high-risk variants for Alzheimer’s disease with obesity-induced gene expression changes in brain cap ECs at the 6-month timepoint. l, Comparison of known high-risk variants for bipolar disorder with obesity-induced gene expression changes in brain cap ECs at the 6-month timepoint. mr, Summary of the most prominent obesity-induced gene expression changes in EC populations identified in this study. Changes in EC populations of the AT (m), liver (n), heart (o), lungs (p), kidneys (q) and brain (r) are provided. Genes indicated in red are high-risk genes for the development of vascular pathologies and overlap with human GWAS studies. The x axes in ac and el represent the –log10 (P value) of disease-associated SNPs assigned to a gene, while the y axes in al represent the log (FC) of the marked gene in obesity. Genes with | log (FC) | > 0.1 are highlighted in red. Select candidate genes are labeled. SNPs associated with each disease were obtained from the NHGRI-EBI GWAS database. Source data
Extended Data Fig. 1
Extended Data Fig. 1. Isolation and bioinformatical filtering of ECs.
(a) Mouse body weight over 3 months of WD. N = 9 animals per group. (b) Percentage of lean versus fat mass in animals maintained on WD and chow diets for 3 months. N = 9 animals per group. (c) Metabolomics (GC-MS) data showing serum cholesterol, palmitate and stearic acid levels in obese versus control animals. N = 3 animals on chow diet, 4 on WD. (d) Correlation matrix comparing the overall EC transcriptome from the 7 indicated organs, with WD and chow groups combined. Pearson’s r-value for each comparison is provided. (e) Representative FACS plots showing sorting strategy for ECs at the 3-month timepoint. Single cells were selected based on forward and side scatter, dead cells removed based on propidium iodide staining, and enriched populations of ECs isolated based on high CD31 (PECAM1) and low CD45 levels. (f) UMAPs showing the presence of vascular EC, mural, fibroblast (FB), hematopoietic and lymphatic EC (LEC) markers across all CD31+ CD45low cell analyzed by scRNA-seq. The arrows indicate the positive population in each category. Data are presented as mean ± SEM and were analyzed using a two-sided Student’s t-test (a-c). Source data
Extended Data Fig. 2
Extended Data Fig. 2. Identification of major EC subtypes across organs.
(a) Assignment of arterial + arteriole (art), capillary (cap) and veins + venule (ven) identities to ECs in each organs. The identities were defined based on markers presented in panel (b). Cells indicated in gray are specialized ECs that don’t broadly fit into the art, cap and ven EC categories. (b) UMAPs showing representative markers of art, cap and ven ECs for each organ. All markers, including the representatives shown here, were derived from published scRNA-seq datasets,,–. Arrows mark the respective positive cell populations. (c) Number of differentially expressed genes (DEGs) in the art, cap and ven ECs after down-sampling. Down-sampling to 73 ECs was done to ensure equal statistical power in each group. As down-sampling also resulted in lower statistical power, a lenient cut-off of p < 0.05 (rather than Benjamini-Hochberg adjusted p-value < 0.05) was used. Source data
Extended Data Fig. 3
Extended Data Fig. 3. Obesity induces ECM genes in adipose tissue ECs.
(a-b) Top 5 enriched genes in (a) visceral and (b) subcutaneous AT EC clusters. (c-d) Comparison of obesity-induced gene expression changes across EC clusters in (c) visceral and (d) subcutaneous AT. Any gene showing a |log(FC)| > 0.1 in any cluster was used to collate the list of genes used for these analyses. The numbers show the Pearson’s r-value for each comparison. (e) BioPlanet-annotated pathways enriched in DEGs in the cap2 versus cap1 population in visceral AT. Data are expressed as -log10(p-adj). Genes significantly enriched (p-adj < 0.05) in cap2 versus cap1 ECs were used for this analysis. (f) Heatmap showing obesity-associated gene expression changes in select ECM components. a – arteries + arterioles (art), c – capillaries, v – veins + venules (ven). Art, capillary and ven ECs were defined using markers outlined in Extended Data Fig. 2. (g) Heatmap showing gene expression changes in the ‘Integrin signaling’ pathway in cap ECs. Cap ECs were defined using markers outlined in Extended Data Fig. 2. (h-i) Quantification of (h) angiogenic and (i) proliferating ECs in each of the 7 tissues. Top genes enriched in angiogenic and proliferating ECs in the AT are provided in Extended Data Fig. 3a, b and Supplementary Tables 3–6. Data were analyzed using a two-sided χ2-test. (j) Obesity-associated changes in the expression of genes associated with angiogenesis and proliferation in visceral and sc AT capillary ECs. (k-l) BioPlanet-annotated terms significantly enriched in genes (k) upregulated and (l) downregulated in LECs in visceral and sc AT. Data are expressed as -log10(p-adj). Top 100 (k) up- and (l) downregulated genes, ranked by log(FC), were used for these analyses. p-adj indicates adjustments for multiple comparisons using the Benjamini-Hochberg method, FC – fold change. Differential expression from scRNA-seq data is expressed on a natural log (loge) scale. Source data
Extended Data Fig. 4
Extended Data Fig. 4. Liver ECs activate lipid mobilization networks in obesity.
(a) Top 5 enriched genes in liver EC clusters. (b) Comparison of obesity-associated gene expression changes across EC clusters in liver. Any gene showing a |log(FC)| > 0.1 in any cluster was used to collate the list of genes used for these analyses. The numbers show the Pearson’s r-value for each comparison. (c) BioPlanet-annotated pathways significantly enriched in the liver cap1 population relative to other capillary ECs. Data are expressed as -log10(p-adj). (d) BioPlanet-annotated pathways significantly enriched in the liver cap2 population relative to other capillary ECs. Data are expressed as -log10(p-adj). (e) KEGG and BioPlanet terms most significantly enriched in cap2 versus cap1 population. Data are expressed as -log10(p-adj). Genes significantly enriched (p-adj < 0.05) in the cap2 population versus cap1 were used for this analysis. (f) UMAPs showing expression of Apoa1, Apoa2, Apoc1, Alb, Apoe and Abca1 in ECs across all organs. (g) Heatmap showing induction of lipid mobilization genes in liver EC clusters relative to chow controls. (h-i) Induction of (h) Fabp4 and (i) Fabp5 mRNA expression in response to 100 µM, 400 µM and 800 µM free fatty acids (FA), as well as 30 mM glucose and 10 µg per ml insulin in primary mouse liver and lung ECs. Data were standardized against BSA-treated controls and are presented as mean ± SEM. N = 4 replicates per group, with ECs for each replicate derived from a different animal. Expression data were standardized to Gapdh and Rplp0. (h) **p = 0.002; (i) ***p = 0.0003, *p = 0.021 (two-sided Student’s t-test). Each condition was compared against BSA-controls. (j) KEGG, BioPlanet and gene ontology – biological process (GO BP) terms enriched in genes downregulated in the liver cap1 population in obesity. Data are expressed as -log10(p-adj). p-adj indicates adjustments for multiple comparisons using the Benjamini-Hochberg method, FC – fold change. Differential expression from scRNA-seq data is expressed on a natural log (loge) scale. Source data
Extended Data Fig. 5
Extended Data Fig. 5. Leukocyte migration and inflammation networks are activated by obesity in cardiac ECs.
(a) Top 5 enriched genes in each of the heart EC clusters. (b) GO terms for genes significantly enriched in arteriole ECs relative to other cardiac ECs. Data are expressed as -log10(p-adj). Exemplary genes found across all listed GO categories are provided. Genes significantly enriched (p-adj < 0.05) in the arteriole EC population relative to other cardiac ECs were used for this analysis. (c) Obesity-associated gene expression changes in Meox2 and Tcf15 in cardiac arteriole ECs. (d) Comparison of obesity-associated gene expression changes across cardiac EC clusters. Any gene showing a |log(FC)| > 0.1 in any cluster was used to collate the list of genes used for these analyses. Pearson’s r-value for each comparison is provided. (e) Relative Klf2 and Klf4 mRNA levels in bulk FACS-isolated CD31+ CD45 cells from hearts of control and obese animals. N = 8 animals in chow group; 5 in WD group. Data were standardized to Rplp0 expression and analyzed using a two-sided Student’s t-test. Data are presented as mean ± SEM. (f-g) BioPlanet-annotated terms significantly (f) upregulated and (g) downregulated in cardiac LECs in obesity. Data are expressed as -log10(p-adj). Top 100 (f) up- and (g) downregulated genes, ranked by log(FC), were used for these analyses. Exemplary genes for select pathways are listed. (h) BioPlanet annotated pathways significantly upregulated in AP1 ECs in obesity. Data are expressed as -log10(p-adj). Top 100 upregulated genes, ranked by log(FC), were used for these analyses. p-adj indicates adjustments for multiple comparisons using the Benjamini-Hochberg method, FC – fold change. Differential expression from scRNA-seq data is expressed on a natural log (loge) scale. Source data
Extended Data Fig. 6
Extended Data Fig. 6. Obesity induces inflammatory networks in lung ECs.
(a) Top 5 enriched genes in each of the lung EC clusters. (b) UMAPs showing the co-expression of EC markers Pecam1 and Flt1 with pneumocyte markers Sftpa1 and Sftpb. Arrows indicate the population showing overlap of pneumocyte and EC markers. (c) Representative fluorescence in situ hybridization (FISH) images showing the colocalization of pneumocyte markers (Lyz2, Sftpa1, Sftpb) and endothelial marker Pecam1. Tubb3 is provided as a negative control, as it is typically not expressed in the lungs. White arrows indicate the double positive cells. The data were reproduced in 3 control and 3 WD fed animals. Scale bars equal 5 µm. (d) KEGG curated pathways enriched in the EC-pneumocyte population relative to other lung ECs. Data are expressed as -log10(p-adj). Genes significantly enriched (p-adj < 0.05) in the EC-pneumocyte population relative to other lung ECs were used for this analysis. (e) Comparison of obesity-associated gene expression changes across lung EC clusters. Any gene showing a |log(FC)| > 0.1 in any cluster was used to collate the list of genes used for these analyses. The numbers presented are Pearson’s r-value for each comparison. (f) Expression of histocompatibility genes H2-Ab1, H2-Aa and H2-Eb1 in bulk FACS-isolated CD31+ CD45 cells from lungs of control and obese animals. N = 5 animals in chow group; 4 in WD group. Data were standardized to Hsp90ab1 and Gapdh expression. Data are presented as mean ± SEM and were analyzed via a Student’s t-test. (g) BioPlanet curated pathways downregulated in Aqp5a ECs in obesity. Data are expressed as -log10(p-adj). Top 100 downregulated genes, ranked by log(FC), were used for these analyses. (h) Heatmap showing obesity-induced gene expression changes in select ribosomal genes across lung EC clusters. (i) UMAP of Npr3 expression across organs. Bar graphs represent obesity-associated changes in Npr3 expression in lung and kidney ECs. p-adj indicates adjustments for multiple comparisons using the Benjamini-Hochberg method, FC – fold change. Differential expression from scRNA-seq data is expressed on a natural log (loge) scale. Source data
Extended Data Fig. 7
Extended Data Fig. 7. Obesity induces metabolic changes and downregulation of solute transporters in kidney ECs.
(a) Top 5 enriched genes in each of the kidney EC clusters. mEC – medullary ECs, gEC – glomerular ECs. (b) Obesity-associated shifts in kidney EC clusters. Populations showing a change of log2(WD/chow) > 0.5 in obesity are highlighted in color. (c) Comparison of obesity-associated gene expression changes across renal EC subtypes. Any gene showing a |log(FC)| > 0.1 in any cluster was used to collate the list of genes used for these analyses. Pearson’s r-value for each comparison is provided. (d) KEGG curated pathways significantly enriched in AP1 ECs versus other kidney ECsGenes significantly enriched (p-adj < 0.05) in AP1 ECs were used for these analyses. (e) KEGG pathways enriched in the mEC1 and mEC2 clusters relative to other kidney ECs. Genes significantly enriched (p-adj < 0.05) in mEC1 and mEC2, relative to other kidney EC populations, were used for these analyses. (f) Enrichment in the expression of metabolic genes across kidney EC clusters. Z-scores of average gene expression per cluster are presented. (g) Enrichment of genes encoding SLC transporters across kidney EC clusters. SLC transporters enriched in the mEC1 population are highlighted in red and indicated below the heatmap. (h) UMAPs showing the enrichment of Slc34a1, Slc4a4, Slc6a19, Slc5a2, Slc22a8, Slc13a1, Slc22a18 and Slc5a12 in renal mEC1 cells. The mEC1 population is marked by the black arrows. (i) Obesity-associated gene expression changes in SLC transporters in the mEC1 population. (j) Changes in the expression of mitochondrial respiratory genes in the mEC2 population in obesity. Respiratory complex identities are marked at the bottom. (k) BioPlanet curated pathways upregulated in glomerular ECs (gECs) in obesity. Top 100 downregulated genes, ranked by log(FC), were used for these analyses. (l) Top differentially expressed genes, ranked by p value, in gECs. (m) Obesity-associated changes in the expression of Notch target genes Hey1 and Hes1 in gECs. p-adj indicates adjustments for multiple comparisons using the Benjamini-Hochberg method, FC – fold change, gEC – glomerular EC, mEC – medullary EC. Differential expression from scRNA-seq data is expressed on a natural log (loge) scale. Source data
Extended Data Fig. 8
Extended Data Fig. 8. Brain ECs show obesity-induced changes in metabolic, cell junction and solute carrier genes.
(a) Top 5 enriched genes in each of the neural EC clusters. (b) Shifts in neural EC clusters. Quantification of the shifts is provided in the lower bar graph, with changes expressed on a log2 scale. (c) Comparison of obesity-associated gene expression changes across neural EC subtypes. Any gene showing a |log(FC)| > 0.1 in any cluster was used to collate the list of genes used for these analyses. Pearson’s r-value for each comparison is provided. (d) Heatmap depicting obesity-induced gene expression changes in mitochondrial encoded members of the electron respiration chain. (e) UMAPs depicting enrichment of Sgms1 and Degs2 mRNA in ECs across all organs. Obesity-associated gene expression changes in neural ECs are shown. (f) Enrichment (z-scores) of tight junctions (blue), adherent junctions (green), gap junctions (black) and leukocyte adhesion molecules (red) across neural EC clusters. (g) Heatmap showing the enrichment (z-scores) of SLC transporters across neural EC clusters. The Slc genes enriched in fenestrated EC population are indicated by the red box. (h) Gene expression changes in select Slc genes in fenestrated ECs in obesity. (i) Representative mages of Dextran 3 kDa (FITC) and Dextran 70 kDa (Texas red) in the choroid plexus of obese and control animals. ECs were immunostained with CD31 (purple). All images were taken with the same exposure and laser power. Quantifications are provided in Fig. 2r. N = 5 animals per group. Scale bars represent 20 µm. FC – fold change. Differential expression from scRNA-seq data is expressed on a natural log (loge) scale. Source data
Extended Data Fig. 9
Extended Data Fig. 9. Impact of diet reversion on ECs.
(a) Representative FACS plots showing enrichment of ECs based on PECAM1 (CD31) and CD45 staining. ECs from the heart, brain, lungs, kidneys and liver were enriched at the 4- and 6-month timepoints using CD31 magnetic beads prior to staining and FACS. (b) Number of ECs analyzed at each timepoint and in each experimental group after filtering out low quality and non-ECs. (c) UMAPs of ECs combined from all timepoints showing distinct clusters in each organ. Markers described in Extended Data Figs. 1–8 were used to define these populations. These markers were originally obtained from published scRNA-seq datasets,,–. (d) UMAPs showing the presence of typical EC, mural, fibroblast (FB), hematopoietic and lymphatic EC (LEC) markers at the 4-month time point (4-month chow, 4-month WD, 1-month reversion groups). The arrows indicate the positive population in each category. (e) UMAPs showing the presence of typical EC, mural, fibroblast (FB), hematopoietic and lymphatic EC (LEC) markers at the 6-month time point (6-month chow, 6-month WD, 3-month reversion groups). The arrows indicate the positive population in each category. (f) Select genes showing similar deregulation across all organs in obesity. The 6-month WD timepoint was used to select these genes. Expression is shown relative to the chow control at each timepoint. Following genes are marked: translation-related genes (blue), transcription regulators (red), stress response genes (green), electron respiratory chain-related genes (orange), and signaling molecules (pink). FC – fold change. Differential expression from scRNA-seq data is expressed on a natural log (loge) scale. Source data
Extended Data Fig. 10
Extended Data Fig. 10. Changes in trajectories of EC transcriptome following a reversion diet.
(a) Changes in the expression levels of Hif1a in AT cap ECs. (b) BioPlanet pathways enriched in visceral and sc AT cap ECs. Analysis was done on genes significantly downregulated by sustained obesity (6 m WD, p-adj < 0.05, |log(FC)| > 0.1), which recover towards control levels in the dietary reversion group. (c) BioPlanet terms upregulated by sustained obesity (6 m WD, p-adj < 0.05, |log(FC)| > 0.1) in visceral AT ECs, which recover towards control levels in the dietary reversion group. (d) Gene expression changes of integrin signaling network in cap ECs of visceral and subcutaneous (sc) AT. (e) Gene expression changes in mitochondrial respiratory network in liver art, cap and ven EC clusters. Respiratory complex identities are marked on the right side. (f) BioPlanet terms enriched in the brain EC-platelet population relative to other ECs. Genes significantly enriched (p-adj < 0.05) in the EC-platelet population were used for these analyses. (g) Quantification of platelet marker-positive ECs in the brain, heart, lungs, and kidneys as a proportion of all ECs in the respective organ. (h) UMAPs showing enrichment of large vessel and arterial markers in heart ECs. The arrow denotes arterial ECs, where all the tested markers overlap. (i) Gene expression changes in AP1 transcription factor subunits in cardiac arteries. (j) Expression of Fabp4 in heart cap ECs. (k) Obesity-associated gene expression changes in mitochondria-encoded genes in lung art, cap and ven EC populations. (l) BioPlanet terms significantly upregulated by sustained obesity (6 m WD, p-adj < 0.05, |log(FC)| > 0.1) in lung cap ECs, which do not recover towards control levels in the dietary reversion group. (m) Changes in expression levels of AP1 transcription factor subunits and Hsp genes in the lung aEC population. (n) BioPlanet pathways upregulated by sustained obesity (6 m WD, p-adj < 0.05, |log(FC)| > 0.1) in the kidney cap population, which do not recover towards control levels in the dietary reversion group. p-adj indicates adjustments for multiple comparisons using the Benjamini-Hochberg method, FC – fold change. Differential expression from scRNA-seq data is expressed on a natural log (loge) scale. Source data

References

    1. Blüher M. Obesity: global epidemiology and pathogenesis. Nat. Rev. Endocrinol. 2019;15:288–298. doi: 10.1038/s41574-019-0176-8. - DOI - PubMed
    1. World Health Organization, WHO Fact sheet—obesity and overweight. https://www.who.int/news-room/fact-sheets/detail/obesity-and-overweight (2016).
    1. Kivipelto M, et al. Obesity and vascular risk factors at midlife and the risk of dementia and Alzheimer disease. Arch. Neurol. 2005;62:1556–1560. doi: 10.1001/archneur.62.10.1556. - DOI - PubMed
    1. Zhang X, Lerman LO. Obesity and renovascular disease. Am. J. Physiol. Ren. Physiol. 2015;309:F273–F279. doi: 10.1152/ajprenal.00547.2014. - DOI - PMC - PubMed
    1. Frank RC, et al. Obesity is associated with pulmonary hypertension and modifies outcomes. J. Am. Heart Assoc. 2020;9:e014195. doi: 10.1161/JAHA.119.014195. - DOI - PMC - PubMed

Publication types