. 2022 Nov 18;12(1):19874.
doi: 10.1038/s41598-022-24377-1.

Quantifying thermal cues that initiate mass emigrations in juvenile white sharks

Affiliations

Quantifying thermal cues that initiate mass emigrations in juvenile white sharks

Emily Spurgeon et al. Sci Rep. .

Abstract

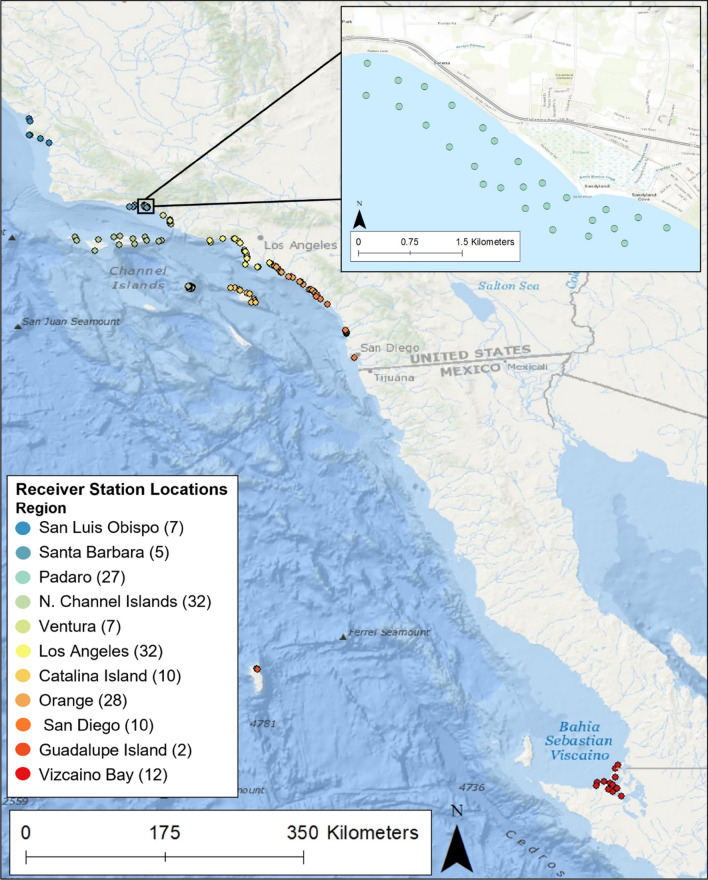
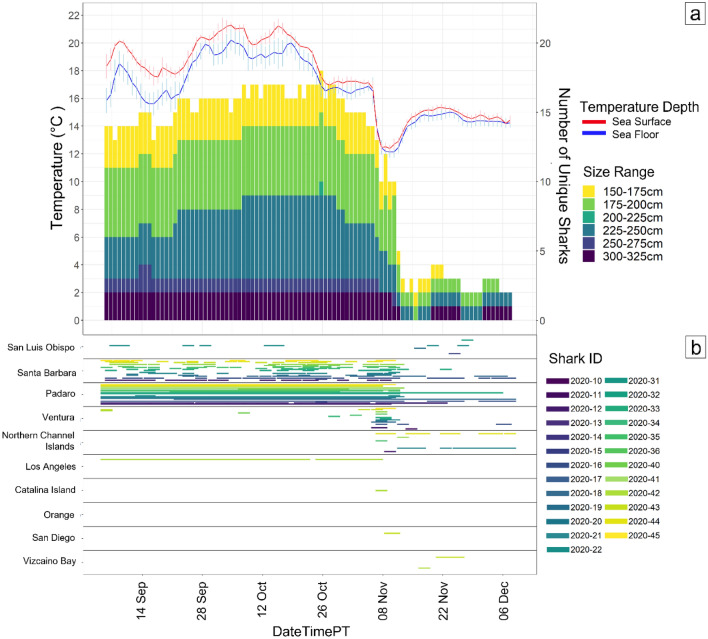
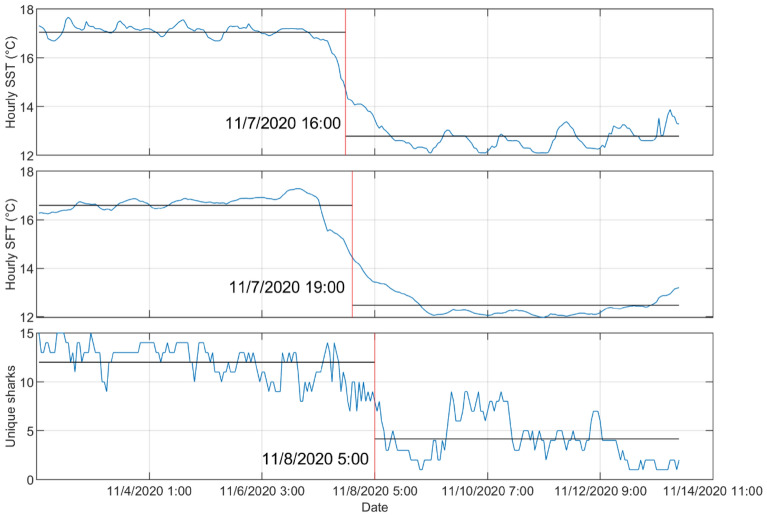
While the function of migration varies among species, environmental temperature is known to be one of the most important abiotic variables that drive animal migration; however, quantifying the thresholds and timing of the cues that influence a mass emigration is difficult, often due to lack of monitoring resolution, particularly for large, highly mobile species. We used acoustic telemetry tracking and high-resolution water temperature data over a relatively large spatial scale (5.5 km2) to identify and quantify a thermal threshold for mass emigration of juvenile white sharks. Sixteen tagged sharks were observed to initiate a search for warmer water within 10-12 hours of an upwelling event where water temperatures dropped below 14 °C. Eleven sharks traveled ~ 35 km away where they experienced similar cold temperatures before returning to the aggregation site within 24 hours. Five days following the upwelling event, most sharks emigrated from the site for the season. Quantifying movement patterns across different spatial and temporal scales is necessary to understand cues and thresholds influencing animal migration, which may be greatly affected by climate anomalies and climate change, resulting in potential impacts on the dynamics of local prey species, management, and conservation policy and practice.


Conflict of interest statement

The authors declare no competing interests.

Figures

Figure 1
Figure 1
The locations of acoustic receivers along the California and Mexican coastline. Each color represents a region where (n) receivers are located. The inset map shows the higher density receiver array at Padaro Beach, CA. Map was produced using ArcMap™ version 10.8.1 with the “Ocean” basemap. https://www.arcgis.com/home/item.html?id=5ae9e138a17842688b0b79283a4353f6.
Figure 2
Figure 2
(a) Sea surface and sea floor temperature plotted with the proportion of tagged sharks (solid black line) that were detected at Padaro between 15 May and 10 December. The error bars around the seafloor and sea surface temperatures represent the 95% confidence interval. (b) Bakun Upwelling Index Values of daily average wind-driven cross-shore transports for the region of 33 N, 119 W. Positive numbers represent upwelling and negative numbers represent downwelling.
Figure 3
Figure 3
Change point analysis of daily averaged sea floor temperature data and proportion of sharks present at Padaro from 15 May to 10 December. Two change points were detected for both temperature and shark presence, the first on the 19 and 22 of August and the other on the 8 and 13 of November as represented by the red solid lines.
Figure 4
Figure 4
From 4 September to 10 December (a) shows a stacked bar plot of different size classes of JWS and how many unique sharks were present each day at Padaro Beach plotted with the sea surface and sea floor average daily temperatures. (b) Abacus plot of what regions the unique sharks that were detected at Padaro were present in. Regions are ordered by latitude.
Figure 5
Figure 5
Change point analysis from daily averaged data from 4 September to 10 December of sea surface temperature, sea floor temperature, and the number of unique sharks present. The change points occurred on 7, 8, and 13 November, respectively represented by the solid red lines.
Figure 6
Figure 6
From 6 to 16 November (a) shows a stacked bar plot of different size classes of JWS and how many unique sharks were present each hour at Padaro Beach plotted with the sea surface and sea floor average hourly temperatures. (b) Abacus plot of hourly detections and the regions each unique shark present at Padaro Beach before the upwelling event was detected. Regions are ordered by latitude.
Figure 7
Figure 7
Change point analysis from hourly averaged data from 1 to 16 November of sea surface temperature, sea floor temperature, and the number of unique sharks present. The change points occurred on 7 November at 16:00 PST, 7 November at 19:00 PST, and 8 November at 05:00 PST respectively as shown by the solid red lines.

References

    1. Chen IC, Hill JK, Ohlemüller R, Roy DB, Thomas CD. Rapid range shifts of species associated with high levels of climate warming. Science. 2011;333(6045):1024–1026. doi: 10.1126/SCIENCE.1206432. - DOI - PubMed
    1. Newton I. Migration within the annual cycle: Species, sex and age differences. J. Ornithol. 2011;152:169–185. doi: 10.1007/S10336-011-0689-Y/TABLES/1. - DOI
    1. Dodson S, Abrahms B, Bograd SJ, Fiechter J, Hazen EL. Disentangling the biotic and abiotic drivers of emergent migratory behavior using individual-based models. Ecol. Model. 2020;432:109225. doi: 10.1016/J.ECOLMODEL.2020.109225. - DOI
    1. Lehikoinen A, Santaharju J, Pape A, Lehikoinen MA, Santaharju J, Møller AP. Sex-specific timing of autumn migration in birds: the role of sexual size dimorphism, migration distance and differences in breeding investment. Ornis Fennica. 2017;94:53–65.
    1. Stewart, B. S. Ontogeny of differential migration and sexual segregation in northern elephant seals. J. Mammol.78(4), 1101–1116 (1997).

Publication types