. 2022 Dec;61(12):1735-1748.
doi: 10.1007/s40262-022-01186-3. Epub 2022 Nov 19.

Physiologically Based Modelling Framework for Prediction of Pulmonary Pharmacokinetics of Antimicrobial Target Site Concentrations

Affiliations

Physiologically Based Modelling Framework for Prediction of Pulmonary Pharmacokinetics of Antimicrobial Target Site Concentrations

Linda B S Aulin et al. Clin Pharmacokinet. 2022 Dec.

Abstract

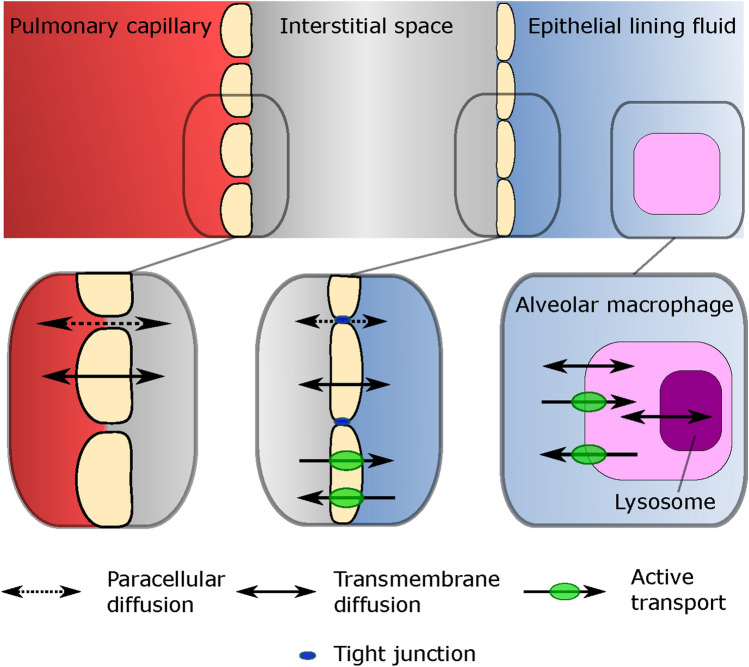
Background and objectives: Prediction of antimicrobial target-site pharmacokinetics is of relevance to optimize treatment with antimicrobial agents. A physiologically based pharmacokinetic (PBPK) model framework was developed for prediction of pulmonary pharmacokinetics, including key pulmonary infection sites (i.e. the alveolar macrophages and the epithelial lining fluid).

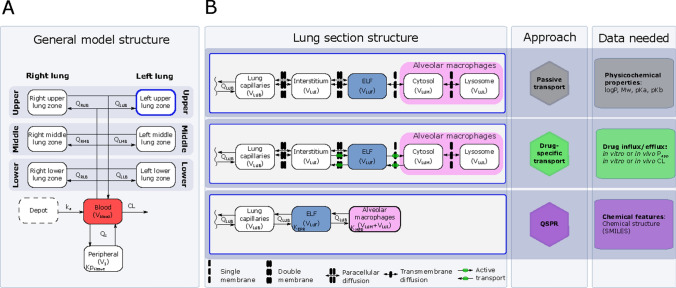
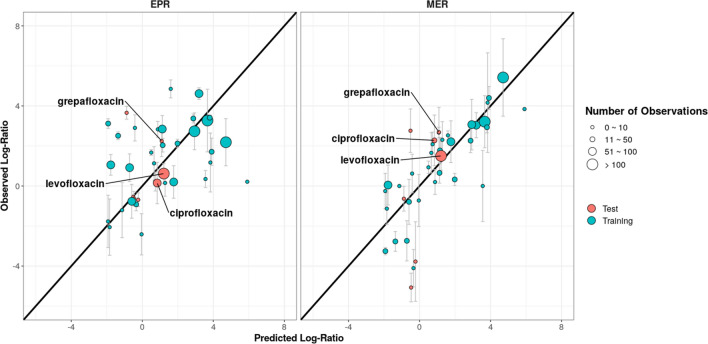
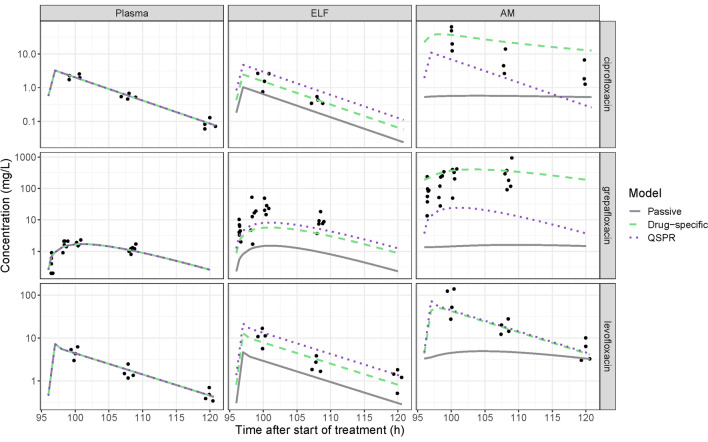
Methods: The modelling framework incorporated three lung PBPK models: a general passive permeability-limited model, a drug-specific permeability-limited model and a quantitative structure-property relationship (QSPR)-informed perfusion-limited model. We applied the modelling framework to three fluoroquinolone antibiotics. Incorporation of experimental drug-specific permeability data was found essential for accurate prediction.

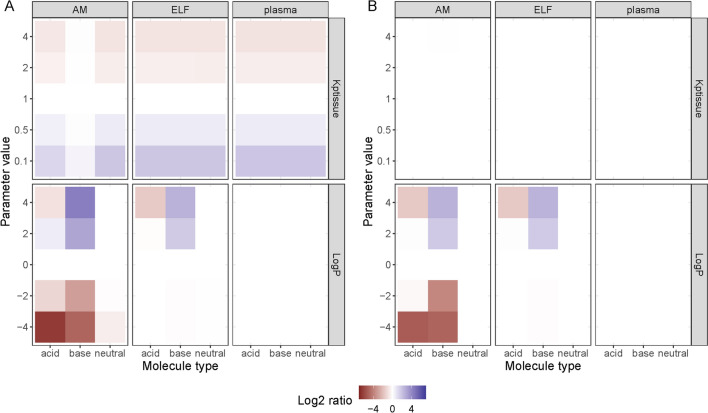
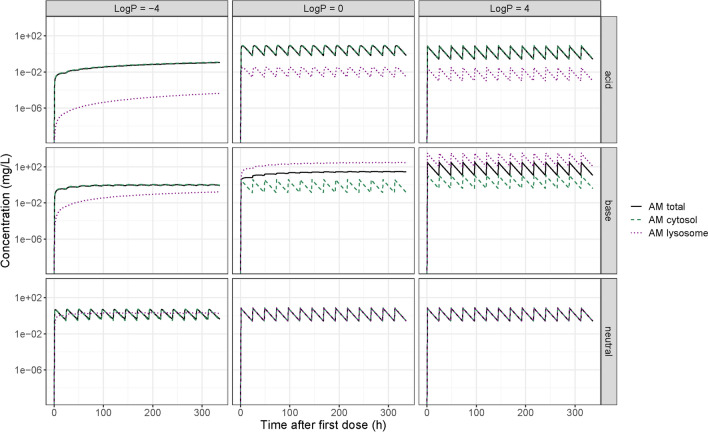
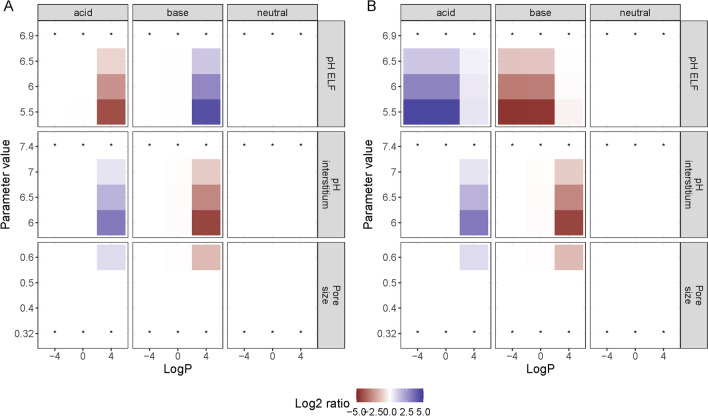
Results: In the absence of drug-specific transport data, our QSPR-based model has generic applicability. Furthermore, we evaluated the impact of drug properties and pathophysiologically related changes on pulmonary pharmacokinetics. Pulmonary pharmacokinetics were highly affected by physiological changes, causing a shift in the main route of diffusion (i.e. paracellular or transcellular). Finally, we show that lysosomal trapping can cause an overestimation of cytosolic concentrations for basic compounds when measuring drug concentrations in cell homogenate.

Conclusion: The developed lung PBPK model framework constitutes a promising tool for characterization of pulmonary exposure of systemically administrated antimicrobials.


Conflict of interest statement

No conflict to declare. The views expressed in this manuscript do not necessarily reflect the position of Finnish Medicines Agency.

Figures

Fig. 1
Fig. 1
Overview of physiological compartments in the lung, their associated barriers and the different modes of transport available over the specific barriers
Fig. 2
Fig. 2
PBPK model structure and associated approaches and data requirements. A General model structure of the minimal PBPK model including the lung section with the six different lung zones. The full cardiac output (Qc) is heterogeneously divided over the different lung zones (z) to account for spatial difference in pulmonary blood flow (QZB). The blood clearance (CL), tissue-to-blood partitioning for the peripheral compartment (Kptissue) and apparent absorption rate (ka) are implemented as empirical parameters while the other included parameters are physiologically derived. B Overview of three variations of the lung sub-model using different approaches to describe lung drug disposition and what data each approach required. ELF epithelial lining fluid, PBPK physiologically based pharmacokinetic, QSPR quantitative structure-property relationship, V volume, LXX left lung, RXX right lung, XUX upper lung zone, XMX middle lung zone, XLX lower lung zone, XXB blood compartment, XXI interstitial compartment, XXF ELF compartment, XXM cytosol compartment, XXL lysosome compartment, KEPR   ELF-plasma partitioning, KMER alveolar macrophage -ELF partitioning
Fig. 3
Fig. 3
Predicted versus observed log epithelial lining fluid–plasma ratio (EPR) and alveolar macrophage–epithelial lining fluid ratio (MER). They each include 130 structural features and the s and λ were 0.20 and 0.10 for the EPR model and 0.25 and 0.25 for the MER model, respectively. The error bars represent the reported range of the within-study mean observed penetration log ratios
Fig. 4
Fig. 4
Steady-state pharmacokinetic (PK) profiles of repeated dosing of ciprofloxacin, grepafloxacin and levofloxacin in plasma, epithelial lining fluid (ELF) and alveolar macrophages (AMs). Observations are shown as dots and model predictions as lines, where the predicted concentration in the pulmonary compartments are the mean of the six lung zones. Three different models were used to predict pulmonary PK; a general passive permeability-limited model (grey solid lines), a drug-specific permeability-limited model (green dashed lines) and a quantitative structure–property relationship (QSPR)-informed perfusion-limited model (purple dotted lines)
Fig. 5
Fig. 5
Impact of drug-specific parameters on A steady-state maximum concentration and B 24-h area under the curve (AUC) for plasma, epithelial lining fluid (ELF) and alveolar macrophages (AMs). The drug-specific parameter altered included tissue partitioning coefficient (Kptissue), the n-octanol-water lipophilicity index (logP) and plasma clearance (CL) and molecular weight (data not shown). The drugs with median parameter values were used as comparator drugs and the colour gradient indicate the log2 change in AUC (A) or Cmax(B) relative to the comparator
Fig. 6
Fig. 6
Pharmacokinetics of the alveolar macrophages (AM), and their intercellular compartments for nine hypothetical drugs with different properties
Fig. 7
Fig. 7
Impact of pathophysiological related changes to system-specific parameters on steady 24-h area under the curve (AUC) for epithelial lining fluid (A) and alveolar macrophages (B) for different drugs. The parameter values of the base scenario are indicated with* And the colour gradient indicate the log2 change in AUC relative to the base scenario

References

    1. Rybak MJ. Pharmacodynamics: relation to antimicrobial resistance. Am J Infect Control. 2006;34:38–45. doi: 10.1016/j.ajic.2006.05.227. - DOI - PubMed
    1. Rodvold KA, Hope WW, Boyd SE. Considerations for effect site pharmacokinetics to estimate drug exposure: concentrations of antibiotics in the lung. Curr Opin Pharmacol. 2017;36:114–123. doi: 10.1016/j.coph.2017.09.019. - DOI - PubMed
    1. Rodvold KA, Yoo L, George JM. Penetration of anti-infective agents into pulmonaryepithelial lining fluid. Clin Pharmacokinet. 2011;50:689–704. doi: 10.2165/11592900-000000000-00000. - DOI - PubMed
    1. Huang YCT, Piantadosi CA. Alveolar barrier function assessed by hydrophobic and hydrophilic fluorescent solutes in rabbit lung. Respir Physiol Neurobiol. 2002;133:153–166. doi: 10.1016/S1569-9048(02)00150-7. - DOI - PubMed
    1. Brillault J, De Castro WV, Couet W. Relative contributions of active mediated transport and passive diffusion of fluoroquinolones with various lipophilicities in a Calu-3 lung epithelial cell model. Antimicrob Agents Chemother. 2010;54:543–545. doi: 10.1128/AAC.00733-09. - DOI - PMC - PubMed

Substances

LinkOut - more resources