

Single-cell RNA-seq analysis to identify potential biomarkers for diagnosis, and prognosis of non-small cell lung cancer by using comprehensive bioinformatics approaches
- PMID: 36401966
- PMCID: PMC9676382
- DOI: 10.1016/j.tranon.2022.101571
Single-cell RNA-seq analysis to identify potential biomarkers for diagnosis, and prognosis of non-small cell lung cancer by using comprehensive bioinformatics approaches
Abstract
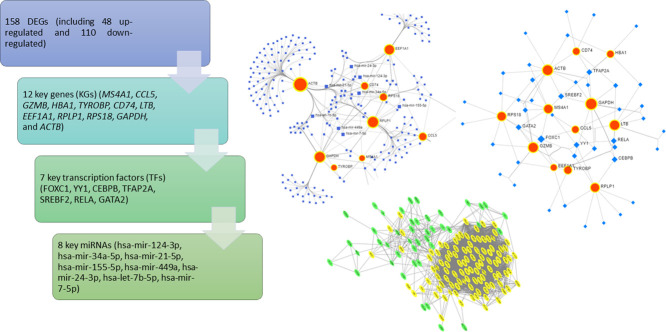
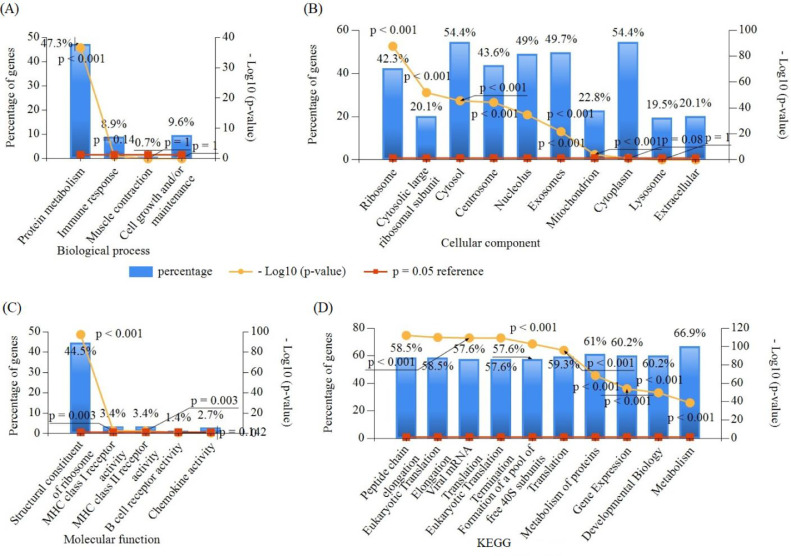
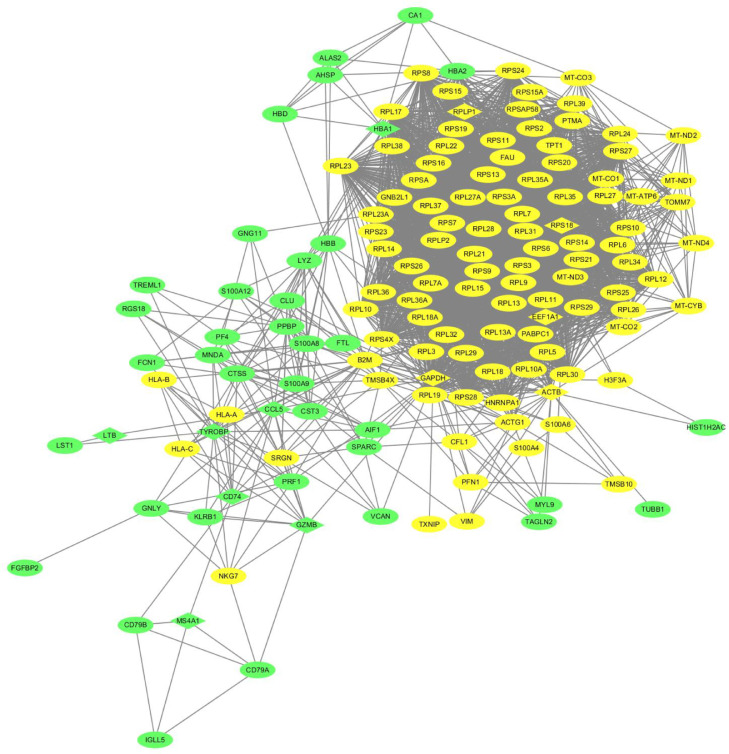
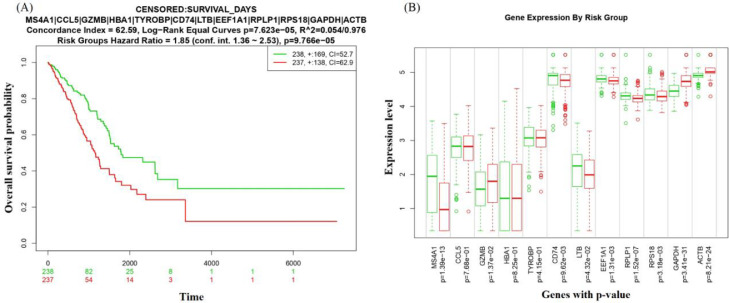
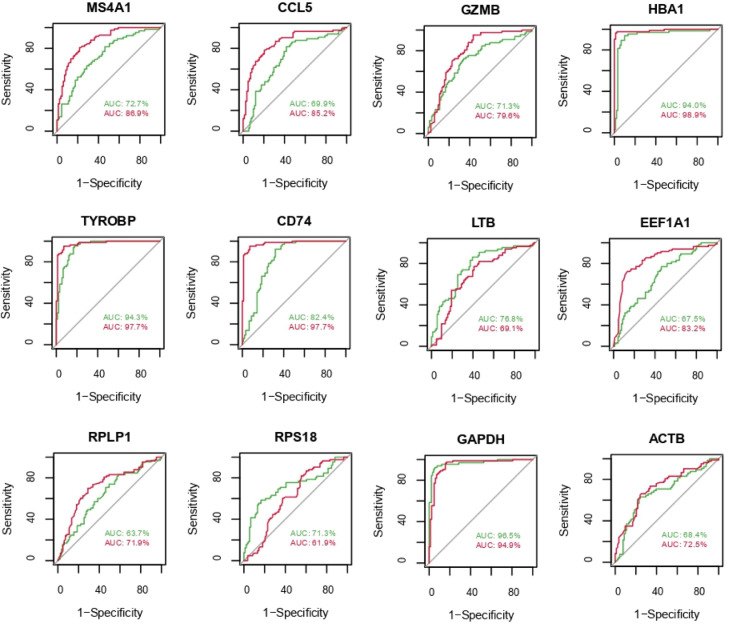
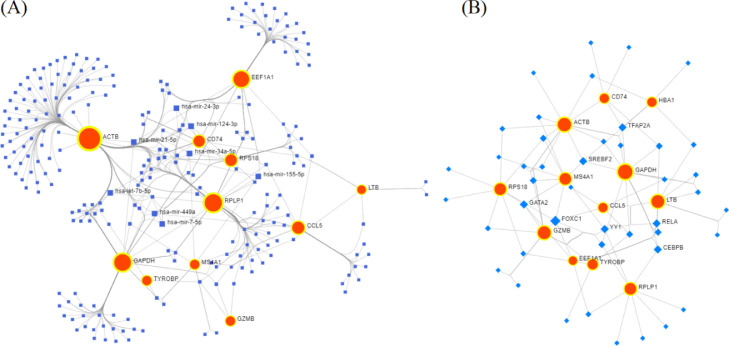
Non-small cell lung cancer (NSCLC) is the most common type of lung cancer and the leading cause of cancer-related deaths worldwide. Identification of gene biomarkers and their regulatory factors and signaling pathways is very essential to reveal the molecular mechanisms of NSCLC initiation and progression. Thus, the goal of this study is to identify gene biomarkers for NSCLC diagnosis and prognosis by using scRNA-seq data through bioinformatics techniques. scRNA-seq data were obtained from the GEO database to identify DEGs. A total of 158 DEGs (including 48 upregulated and 110 downregulated) were detected after gene integration. Gene Ontology enrichment and KEGG pathway analysis of DEGs were performed by FunRich software. A PPI network of DEGs was then constructed using the STRING database and visualized by Cytoscape software. We identified 12 key genes (KGs) including MS4A1, CCL5, and GZMB, by using two topological methods based on the PPI networking results. The diagnostic, expression, and prognostic potentials of the identified 12 key genes were assessed using the receiver operating characteristics (ROC) curve and a web-based tool, SurvExpress. From the regulatory network analysis, we extracted the 7 key transcription factors (TFs) (FOXC1, YY1, CEBPB, TFAP2A, SREBF2, RELA, and GATA2), and 8 key miRNAs (hsa-miR-124-3p, hsa-miR-34a-5p, hsa-miR-21-5p, hsa-miR-155-5p, hsa-miR-449a, hsa-miR-24-3p, hsa-let-7b-5p, and hsa-miR-7-5p) associated with the KGs were evaluated. Functional enrichment and pathway analysis, survival analysis, ROC analysis, and regulatory network analysis highlighted crucial roles of the key genes. Our findings might play a significant role as candidate biomarkers in NSCLC diagnosis and prognosis.
Keywords: Diagnosis; Gene biomarkers; Networking analysis; Non-small cell lung cancer; Single-cell RNA-sequencing.
Copyright © 2022. Published by Elsevier Inc.
Conflict of interest statement
Declaration of Competing Interest The authors declare that they have no known competing financial interests or personal relationships that could have appeared to influence the work reported in this paper.
Figures
References
-
- Xu J., Nie H., He J., Wang X., Liao K., Tu L., et al. Using machine learning modeling to explore new immune-related prognostic markers in non-small cell lung cancer. Front. Oncol. 2020;10 doi: 10.3389/fonc.2020.550002. Epub 2020/11/21PubMed PMID33215029PubMed Central PMCIDPMCPMC7665579. - DOI - PMC - PubMed
-
- Wang Y., Huang L., Wu S., Jia Y., Yang Y., Luo L., et al. Bioinformatics analyses of the role of vascular endothelial growth factor in patients with non-small cell lung cancer. PLoS One. 2015;10(9) doi: 10.1371/journal.pone.0139285. Epub 2015/10/01PubMed PMID26422603PubMed Central PMCIDPMCPMC4589385. - DOI - PMC - PubMed
-
- Wu Q., Zhang B., Sun Y., Xu R., Hu X., Ren S., et al. Identification of novel biomarkers and candidate small molecule drugs in non-small-cell lung cancer by integrated microarray analysis. Onco Targets Ther. 2019;12:3545–3563. doi: 10.2147/OTT.S198621. Epub 2019/06/14PubMed PMID31190860PubMed Central PMCIDPMCPMC6526173. - DOI - PMC - PubMed
LinkOut - more resources
Full Text Sources
