

Disinfectant dodecyl dimethyl benzyl ammonium chloride (DDBAC) disrupts gut microbiota, phospholipids, and calcium signaling in honeybees (Apis mellifera) at an environmentally relevant level
- PMID: 36402032
- PMCID: PMC9664769
- DOI: 10.1016/j.envint.2022.107639
Disinfectant dodecyl dimethyl benzyl ammonium chloride (DDBAC) disrupts gut microbiota, phospholipids, and calcium signaling in honeybees (Apis mellifera) at an environmentally relevant level
Abstract
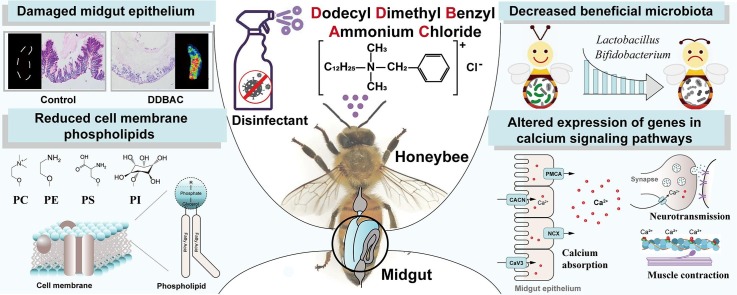
One of the impacts of the Coronavirus disease 2019 (COVID-19) pandemic has been a profound increase in the application amounts of disinfectants. Dodecyl dimethyl benzyl ammonium chloride (DDBAC) is a widely used disinfectant, yet its hazards to non-target species remain largely unknown. We are unaware of any studies assessing DDBAC's impacts on honeybee, a pollinator species that is a useful indicator of environmental pollution essential for many forms of agricultural production. Here, we assessed the potentially negative effects of DDBAC on honeybees. After conducting a formal toxicity evaluation of DDBAC on honeybee mortality, we detected an accumulation of DDBAC in the honeybee midgut. We subsequently studied the midgut tissues of honeybees exposed to sub-lethal concentrations of DDBAC: histopathological examination revealed damage to midgut tissue upon DDBAC exposure, microbiome analysis showed a decreased abundance of beneficial midgut microbiota, lipidomics analysis revealed a significant reduction in cell membrane phospholipids with known functions in signal transduction, and a transcriptome analysis detected altered expression of genes involved in calcium signaling pathways (that variously function in calcium absorption, muscle contraction, and neurotransmission). Thus, our study establishes that DDBAC impacts honeybee midgut functions at multiple levels. Our study represents an early warning about the hazards of DDBAC and appeals for the proper stewardship of DDBAC to ensure the protection of our ecological environment.
Keywords: Calcium signaling; Dodecyl dimethyl benzyl ammonium chloride; Gut microbiota; Honeybee midgut; Phospholipids.
Copyright © 2022 The Authors. Published by Elsevier Ltd.. All rights reserved.
Conflict of interest statement
Declaration of Competing Interest The authors declare that they have no known competing financial interests or personal relationships that could have appeared to influence the work reported in this paper.
Figures


Similar articles
-
Elimination of inhibitory effects of dodecyl dimethyl benzyl ammonium chloride on microalgae in wastewater by cocultivation with a newly screened microbial consortium.Sci Total Environ. 2024 Apr 1;919:170676. doi: 10.1016/j.scitotenv.2024.170676. Epub 2024 Feb 11. Sci Total Environ. 2024. PMID: 38350567
-
Biochar assisted cellulose anaerobic digestion under the inhibition of dodecyl dimethyl benzyl ammonium chloride: Dose-response kinetic assays, performance variation, potential promotion mechanisms.J Environ Manage. 2022 Jun 15;312:114934. doi: 10.1016/j.jenvman.2022.114934. Epub 2022 Mar 24. J Environ Manage. 2022. PMID: 35339793
-
The Mechanism by Which Dodecyl Dimethyl Benzyl Ammonium Chloride Increased the Toxicity of Chlorpyrifos to Spodoptera exigua.Front Pharmacol. 2017 Jul 18;8:475. doi: 10.3389/fphar.2017.00475. eCollection 2017. Front Pharmacol. 2017. PMID: 28769805 Free PMC article.
-
Characterization of Apis mellifera Gastrointestinal Microbiota and Lactic Acid Bacteria for Honeybee Protection-A Review.Cells. 2021 Mar 22;10(3):701. doi: 10.3390/cells10030701. Cells. 2021. PMID: 33809924 Free PMC article. Review.
-
Molecular mechanisms underlying formation of long-term reward memories and extinction memories in the honeybee (Apis mellifera).Learn Mem. 2014 Sep 15;21(10):534-42. doi: 10.1101/lm.033118.113. Print 2014 Oct. Learn Mem. 2014. PMID: 25225299 Free PMC article. Review.
References
-
- Alberoni D., Gaggìa F., Baffoni L., Di Gioia D. Beneficial microorganisms for honey bees: problems and progresses. Appl. Microbiol. Biotechnol. 2016;100:9469–9482. - PubMed
-
- Anderson K.E., Rodrigues P.A., Mott B.M., Maes P., Corby-Harris V. Ecological succession in the honey bee gut: shift in Lactobacillus strain dominance during early adult development. Microb. Ecol. 2016;71:1008–1019. - PubMed
-
- Arrebola-Liébanas F.J., Abdo M.A.H., Moreno J.L.F., Martínez-Vidal J.L., Frenich A.G. Determination of quaternary ammonium compounds in oranges and cucumbers using QuEChERS extraction and ultra-performance liquid chromatography/tandem mass spectrometry. J. AOAC Int. 2014;97:1021–1026. - PubMed
-
- Badiou-Bénéteau A., Benneveau A., Géret F., Delatte H., Becker N., Brunet J.-L., Reynaud B., Belzunces L. Honeybee biomarkers as promising tools to monitor environmental quality. Environ. Int. 2013;60:31–41. - PubMed
MeSH terms
Substances
LinkOut - more resources
Full Text Sources
Medical
