. 2023 Mar;164(3):392-406.e5.
doi: 10.1053/j.gastro.2022.11.018. Epub 2022 Nov 17.

N-glycosylation Regulates Intrinsic IFN-γ Resistance in Colorectal Cancer: Implications for Immunotherapy

Affiliations

N-glycosylation Regulates Intrinsic IFN-γ Resistance in Colorectal Cancer: Implications for Immunotherapy

Julia Krug et al. Gastroenterology. 2023 Mar.

Abstract

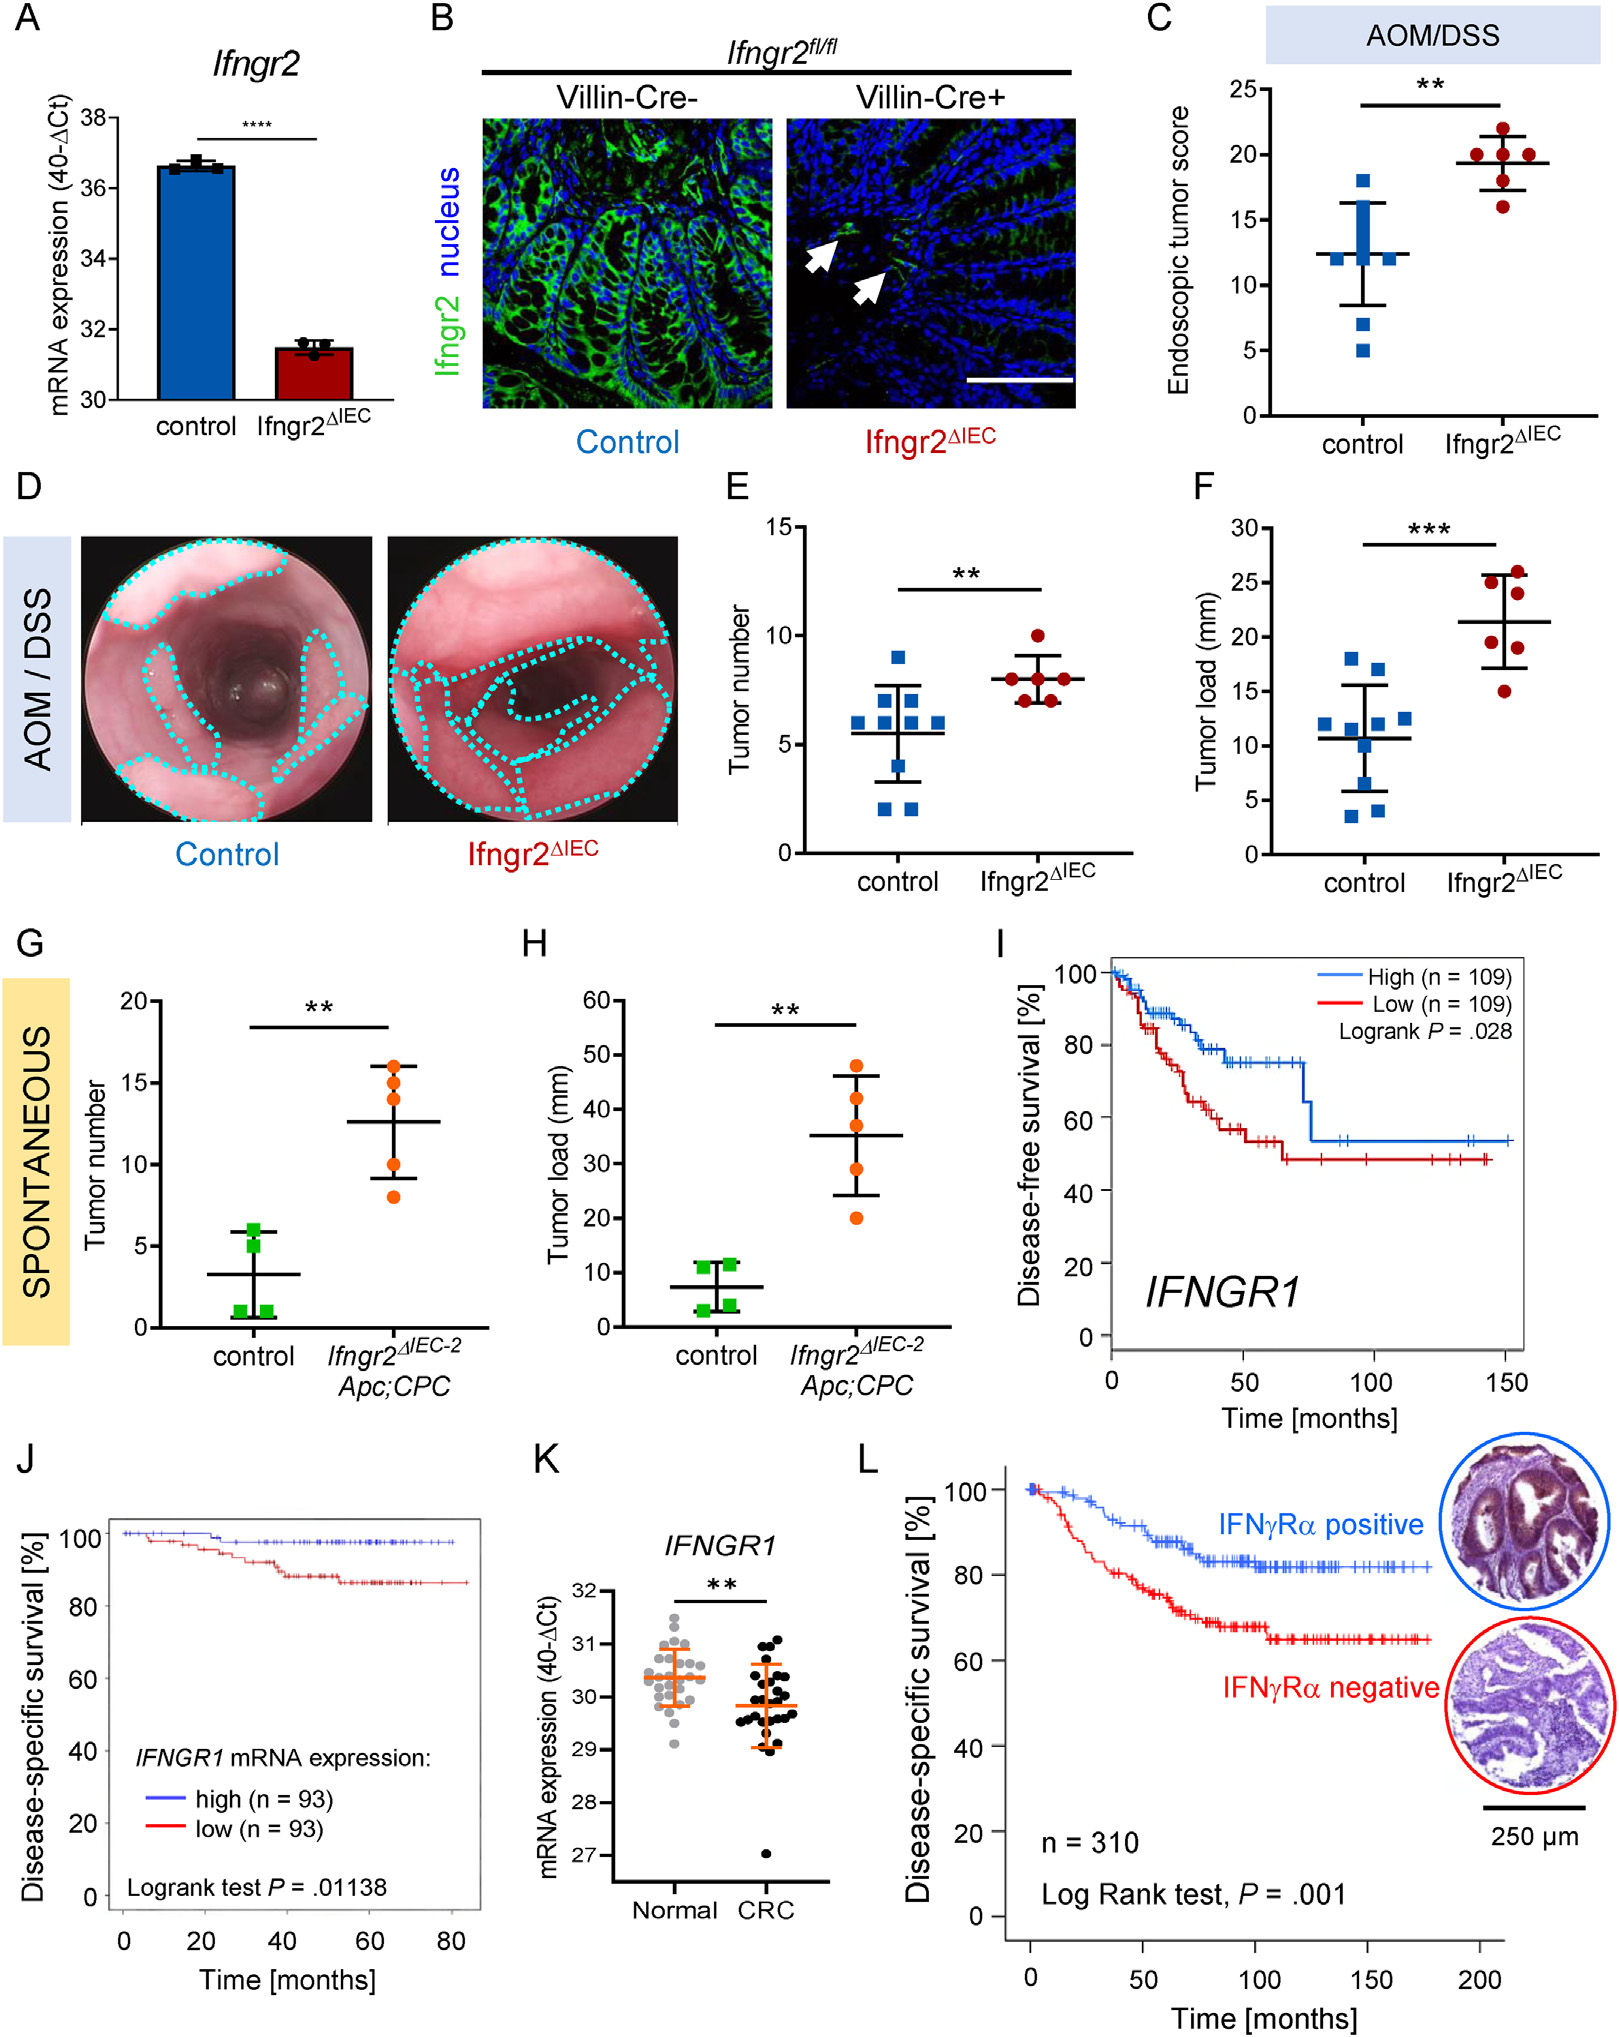
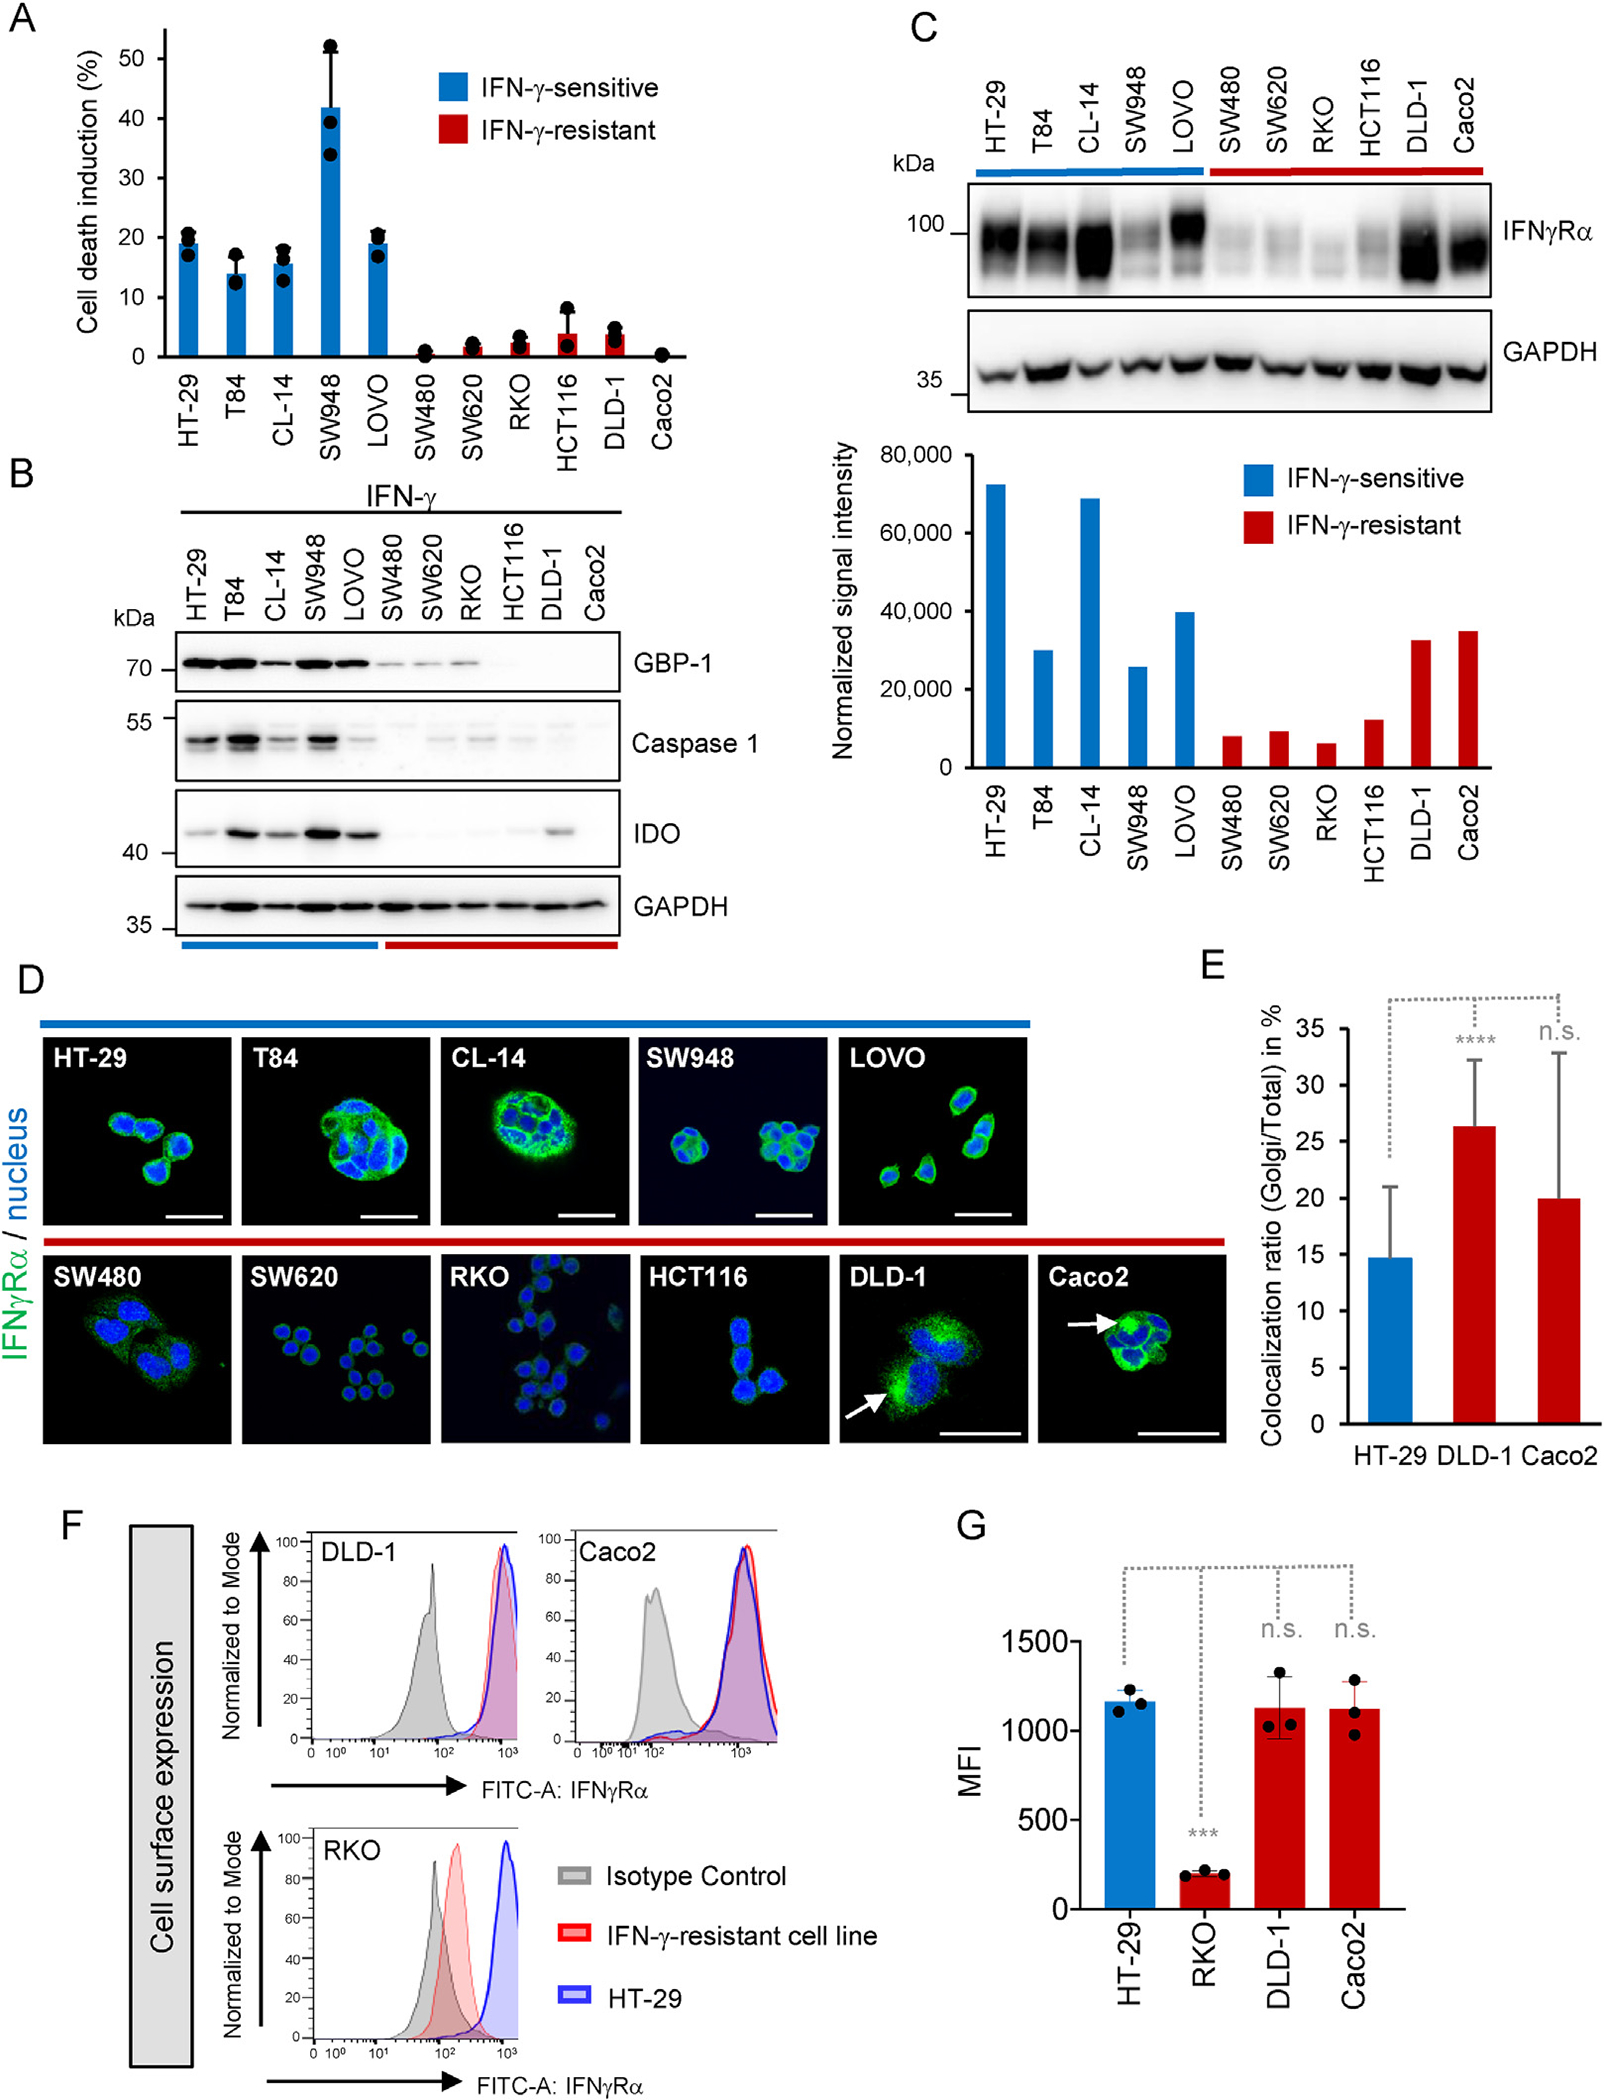
Background & aims: Advanced colorectal carcinoma (CRC) is characterized by a high frequency of primary immune evasion and refractoriness to immunotherapy. Given the importance of interferon (IFN)-γ in CRC immunosurveillance, we investigated whether and how acquired IFN-γ resistance in tumor cells would promote tumor growth, and whether IFN-γ sensitivity could be restored.

Methods: Spontaneous and colitis-associated CRC development was induced in mice with a specific IFN-γ pathway inhibition in intestinal epithelial cells. The influence of IFN-γ pathway gene status and expression on survival was assessed in patients with CRC. The mechanisms underlying IFN-γ resistance were investigated in CRC cell lines.

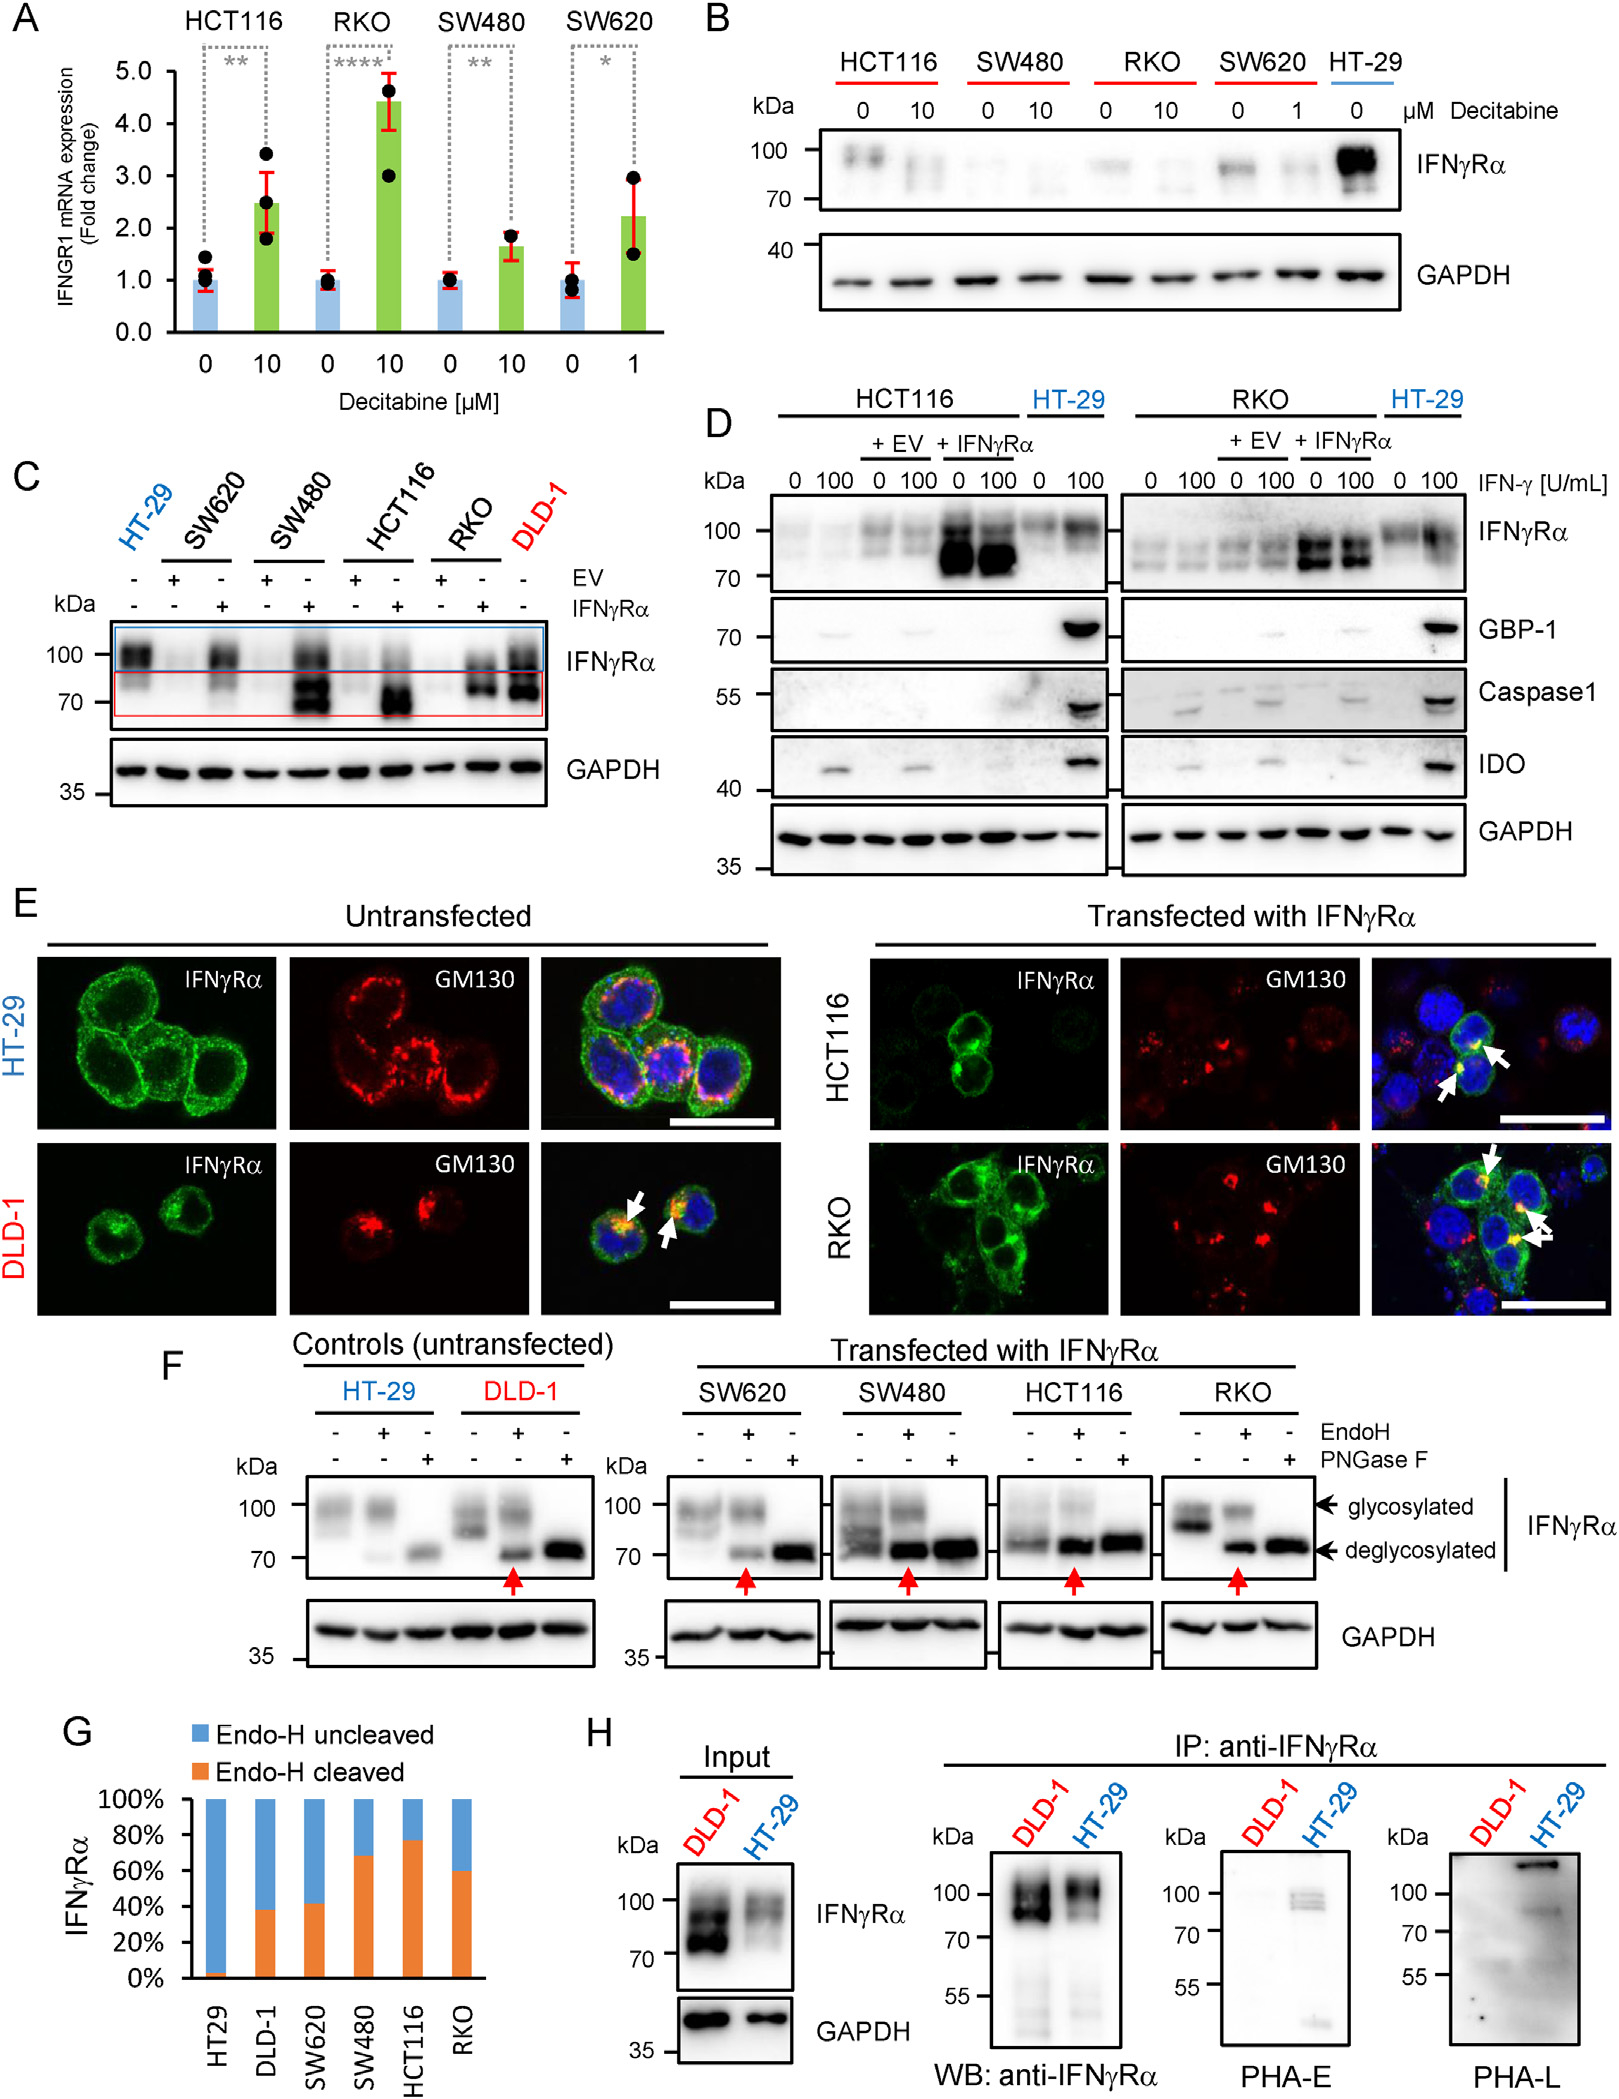
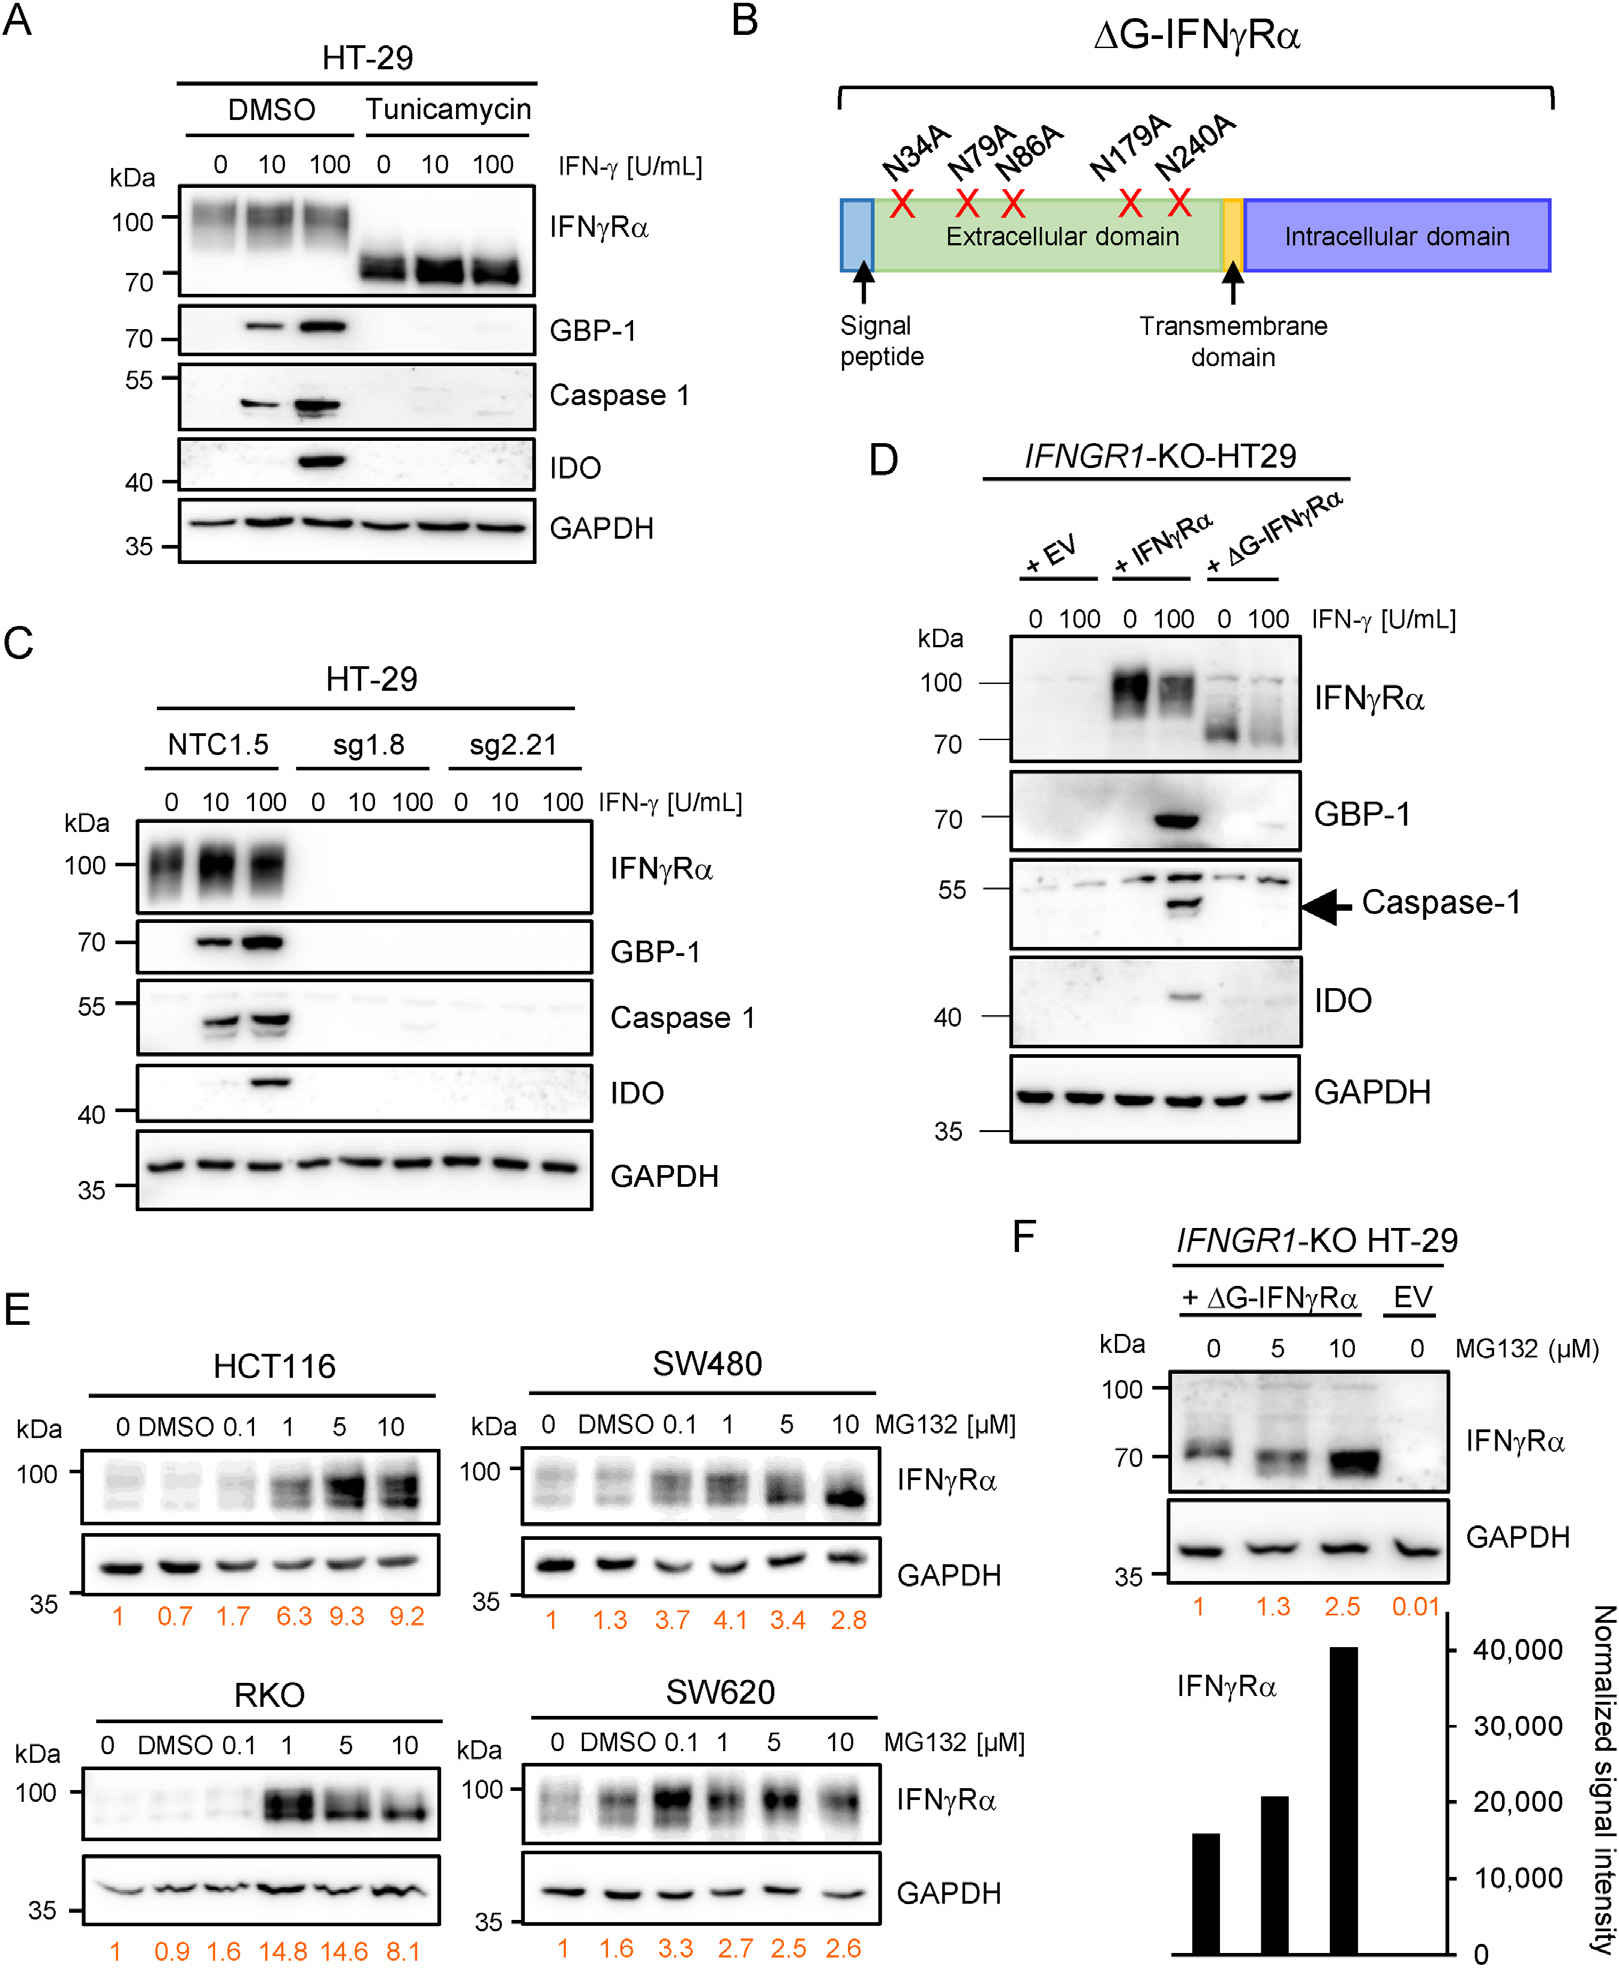
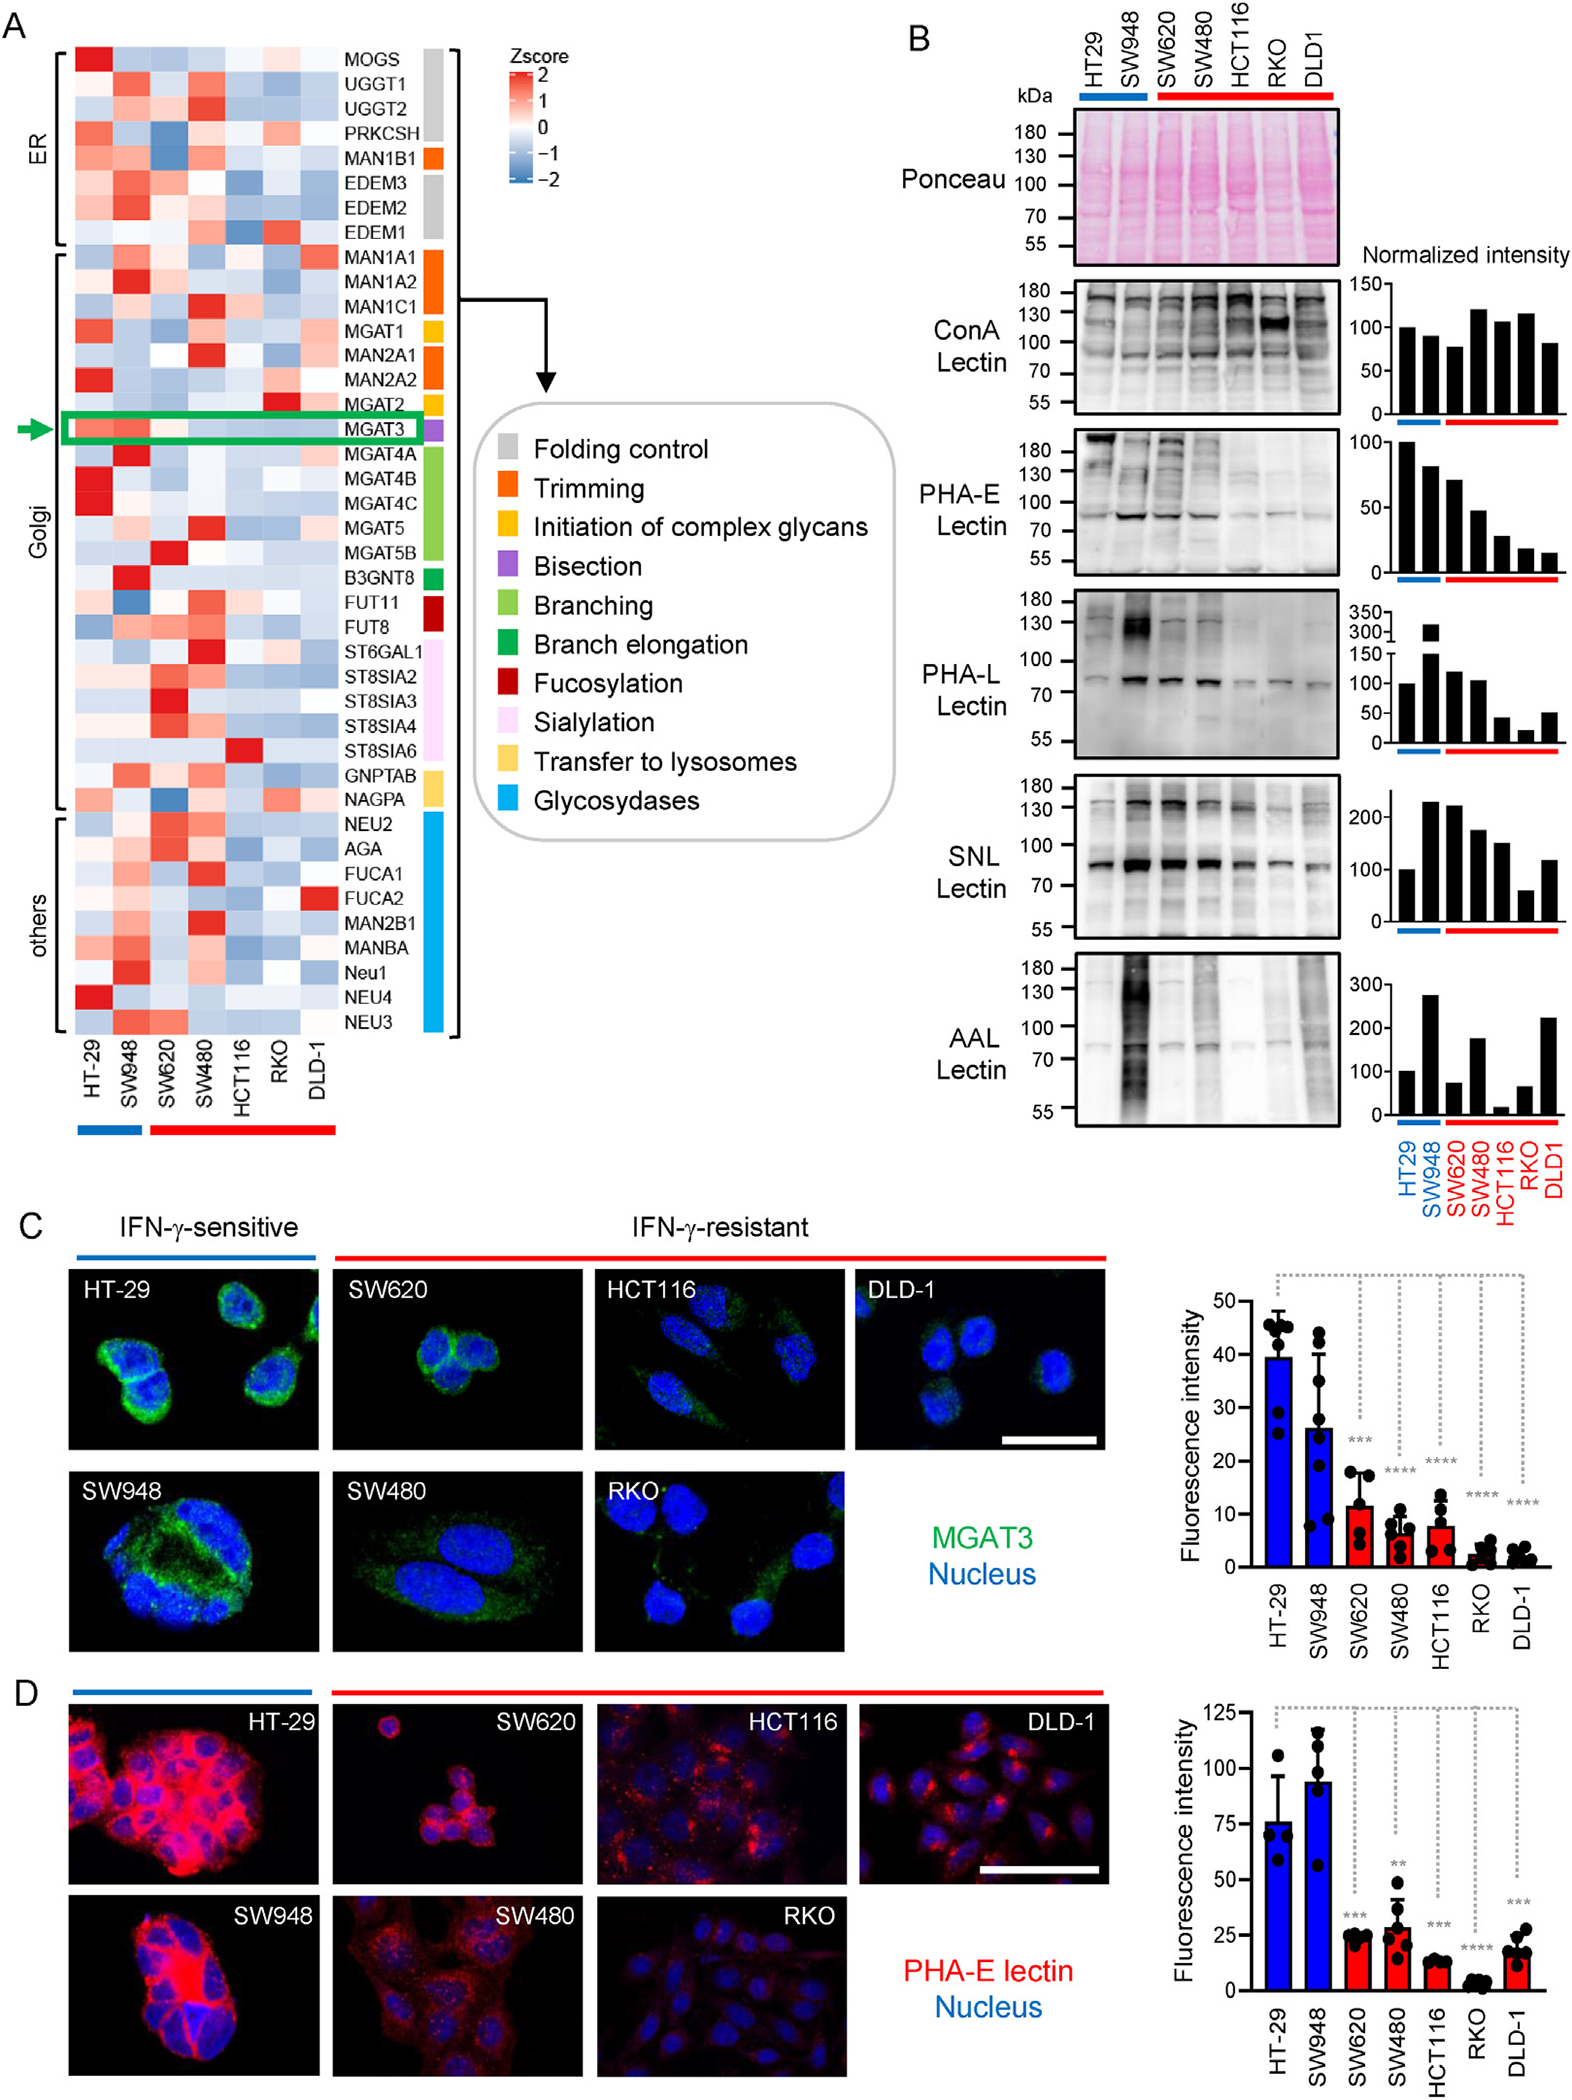
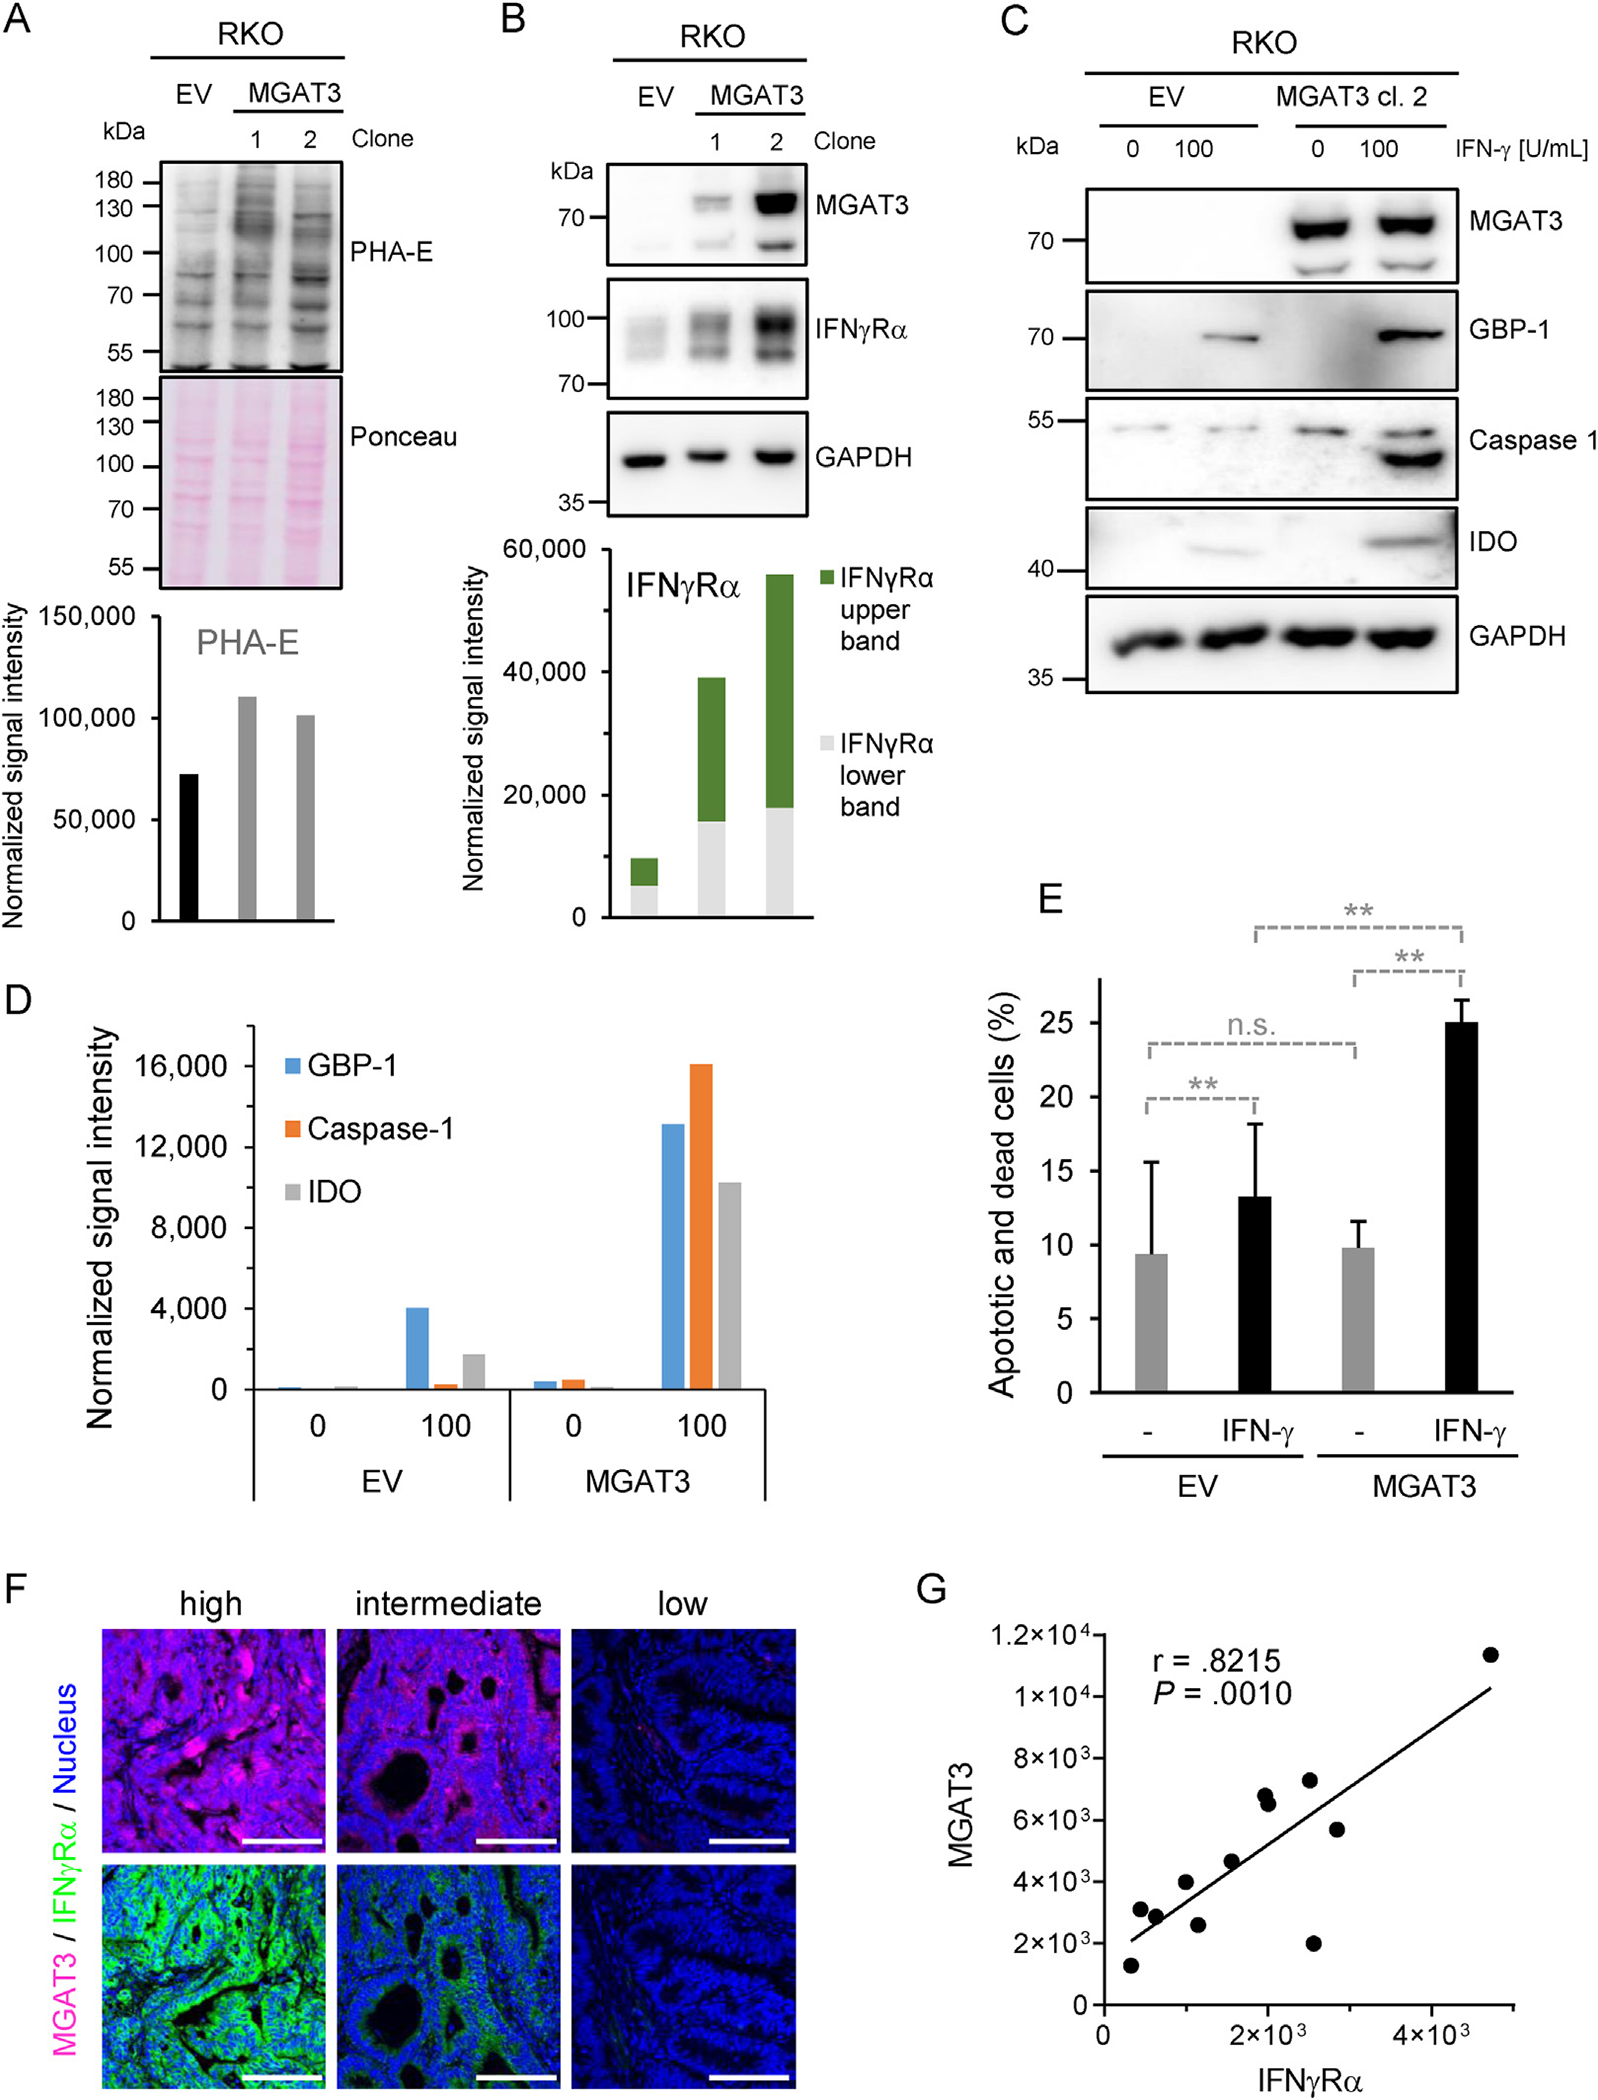
Results: The conditional knockout of the IFN-γ receptor in intestinal epithelial cells enhanced spontaneous and colitis-associated colon tumorigenesis in mice, and the loss of IFN-γ receptor α (IFNγRα) expression by tumor cells predicted poor prognosis in patients with CRC. IFNγRα expression was repressed in human CRC cells through changes in N-glycosylation, which decreased protein stability via proteasome-dependent degradation, inhibiting IFNγR-signaling. Downregulation of the bisecting N-acetylglucosaminyltransferase III (MGAT3) expression was associated with IFN-γ resistance in all IFN-γ-resistant cells, and highly correlated with low IFNγRα expression in CRC tissues. Both ectopic and pharmacological reconstitution of MGAT3 expression with all-trans retinoic acid increased bisecting N-glycosylation, as well as IFNγRα protein stability and signaling.

Conclusions: Together, our results demonstrated that tumor-associated changes in N-glycosylation destabilize IFNγRα, causing IFN-γ resistance in CRC. IFN-γ sensitivity could be reestablished through the increase in MGAT3 expression, notably via all-trans retinoic acid treatment, providing new prospects for the treatment of immune-resistant CRC.

Keywords: Colon Cancer; IFNGR1; Immune Evasion.


Conflict of interest statement

Conflicts of interest

The authors disclose no conflicts.

Figures

Figure 1.
Figure 1.
Absence of IFN-γ-receptor expression in colon tumor cells promotes tumorigenesis in mice and correlates with poor prognosis in patients with CRC. (A) Ifngr2 mRNA expression was measured by quantitative reverse transcription polymerase chain reaction (qRT-PCR) in mouse colon tissue in triplicates. Results are given as mean ± SD of 40-ΔCt (CtIfngr2-CtGapdh) values. Two-tailed unpaired Student t test was used for statistical evaluation (****P < .0001). (B) Representative micrographs of fluorescent immunostaining of IFNγRβ (green) in mouse colon tissues. Nuclei were stained with DRAQ5 (blue). Arrows point at stromal expression of IFNγRβ in otherwise negative colon sections. Scale bar = 100 μm. (CF) Colitis-associated colon carcinogenesis was induced in Ifngr2ΔIEC (n = 6) and control mice (n = 10) by AOM-DSS treatment. Endoscopic scoring (C, D) and macroscopic evaluation of tumor number (E) and tumor load (F) are given. Bars represent means±SD (C, E, F). Two-tailed unpaired Student t test (C, **P = .0014 F, ***P= .0006) or 2-tailed Mann-Whitney test (E, **P = .0079) were used for statistical evaluation. (D) Representative endoscopic pictures showing colonic tumors (turquoise dotted lines). (G and H) Spontaneous colon carcinogenesis was monitored in Apc; CPC mice either heterozygous for Ifngr2 (control, Ifngr2+/−, n = 4) or devoid of Ifngr2 in intestinal epithelial cells (Ifngr2ΔIEC−2, n = 5). Two-tailed unpaired Student t test was used for statistical evaluation of differences in tumor number (G **P = .0029) and tumor load (H **P= .0022). (I) Kaplan-Meier disease-free survival curve of patients with CRC comparing the 30% highest IFNGR1 mRNA gene expression samples (blue, n = 109) with the 30% lowest (red, n = 109 P = .028). (J) Prognostic value of IFNGR1 mRNA expression for human patients with CRC (Polyprobe cohort, n = 410). Kaplan-Meier plots of disease-specific survival comparing the 25% highest (red, n = 93) and the 25% lowest (blue, n = 93) expressing samples (P = .01138). (K) IFNGR1 mRNA expression was determined in triplicate by qRT-PCR in corresponding tumor and normal tissues (n = 28). Results are given as 40-ΔCt (CtIFNGR1-CtRPL37A) (mean ± SD Mann-Whitney test, **P = .0041). (L) Disease-specific survival of patients with colon carcinoma with positive (blue, n = 152) and negative (red, n = 158) tumor cell IFNγRα protein expression (Kaplan-Meier plot, P = .001).
Figure 2.
Figure 2.
INγRα expression is down-regulated in IFN-γ–resistant cells. IFN-γ–resistant cells are highlighted in red, and IFN-γ–sensitive cells in blue. GAPDH was used as loading control for Western blots. (A) Cell death induction determined 72 hours after IFN-γ treatment (100 U/mL) by flow cytometry. Results are given in percent as the difference between IFN-γ–treated and mock-treated controls (mean ± SD, n = 3 distinct samples). (B) ISG expression in CRC cell lines. (C) IFNγRα expression in CRC cell lines. (D) Intracellular staining of IFNγRα in CRC cells. Nuclei were counterstained with DRAQ5 (blue). Scale bars = 25 μm arrows show perinuclear accumulation of IFNγRα. (E) Quantification of IFNγRα Golgi localization in HT-29 (n = 14), DLD-1 (n = 19), and Caco-2 (n = 19) cells. (F) Cell surface expression of IFNγRα analyzed by flow cytometry in CRC cell lines. IFN-γ–resistant cells (red), isotype staining (negative control, gray) and HT-29 (positive control, blue). (G) Mean fluorescence intensity of IFNγRα (MFI) ± SD (n = 3 distinct samples) measured by fluorescence-activated cell sorting in CRC cell lines. Two-tailed unpaired Student t test: ***PRKO = .0009 n.s. = not significant.
Figure 3.
Figure 3.
IFNγRα is aberrantly glycosylated in IFN-γ-resistant CRC cell lines. GAPDH was used as loading control for Western blots. (A) IFNGR1 mRNA expression measured in triplicate by quantitative reverse transcription polymerase chain reaction (qRT-PCR) in IFN-γ–resistant cell lines treated with decitabine (1–10 μM) or dimethyl sulfoxide (DMSO) as control for 96 hours. Results are given as fold-change ± SD compared to DMSO-treated control Student t test was performed using ΔCt (CtIFNGR1-CtRPL37A) values with **PHCT116 = .0059, ****PRKO < .0001, **PSW480 = .0046, and *PSW620 = .0346. (B) IFNγRα protein expression in CRC cell lines treated with decitabine (1–10 μM) or DMSO as control for 96 hours. (C and D) IFNγRα and ISG protein expression in SW620, SW480, HCT116, and RKO after transfection with empty vector or IFNγRα-expressing construct. HT29 and DLD-1 cells were used as expression controls. Rectangles highlight high (blue) and low (red) migrating bands. (E) Staining of IFNγRα (green) and GM130 (red) in CRC cells after reconstitution of IFNγRα expression. Nuclei were counterstained with DRAQ5 (blue). Scale bar = 25 μm arrows indicate colocalization of IFNγRα and GM130. (F) IFNγRα expression in protein lysates from transfected IFN-γ–resistant CRC cells digested with either Endo-H or PNGase-F (each at 1 U/μg protein), lysates processed in absence of enzyme being used as controls. EV, empty vector IFNγRα, IFNγRα expression plasmid. Red arrows indicate digestion of IFNγRα by Endo-H. (G) Signal intensity ratio of cleaved and uncleaved IFNγRα in percent of total. (H) IFNγRα expression and lectin binding (PHA-E and PHA-L) in immunoprecipitated protein lysates from HT-29 and DLD-1 cells. Input samples (10 μg) were analyzed for IFNγRα expression. WB, Western blot.
Figure 4.
Figure 4.
N-glycosylation regulates IFNγRα signaling and protein stability in IFN-γ–resistant cells. GAPDH was used as loading control for Western blots. (A) IFNγRα and ISG protein expression in HT-29 cells treated with tunicamycin or dimethyl sulfoxide (DMSO) as control for 24 hours before stimulation with IFN-γ. (B) Schematic representation of the point mutations inserted in the IFNGR1 sequence to generate a glycosylation-defective mutant (ΔG-IFNγRα). N, asparagine A, alanine. (C) IFNγRα and ISGs protein expression in IFNGR1-KO HT-29 clone sg1.8, sg2.21 and control cells (NTC1.5) after 24 hours of IFN-γ stimulation. (D) IFNγRα and ISG expression in IFNGR1-KO HT-29 cells transduced with empty virus (EV), wild-type IFNγRα, or the ΔG-IFNγRα. Cells were stimulated for 24 hours with indicated amounts of IFN-γ. (E) IFNγRα expression in HCT116, RKO, SW480, and SW620 cell lines treated with increasing concentrations of MG132 (24 hours). The signal intensity for IFNγRα (in orange) was normalized to GAPDH intensity and is given relatively to untreated control (set to 1). (F) IFNγRα expression in IFNΓR1-CRISPR KO HT-29 clone sg 2.21 transduced with EV or ΔG-IFNγRα ± increasing concentrations of MG132 (24 hours). IFNγRα signal intensity (graph, text in orange) was normalized and calculated as in (E).
Figure 5.
Figure 5.
IFN-γ–sensitive and –resistant cells exhibit different N-glycosylation profiles. (A) Heatmap representation of N-glycosylation gene expression data of IFN-γ–sensitive (blue) and IFN-γ–resistant (red) CRC cells. Results are depicted as 2-(ΔCtGOI - ΔCtMean GOI). (B) Lectin blotting analysis of CRC cells (25 μg of protein lysates/lane) was performed using PHA-E, PHA-L, Sambucus nigra lectin, and Aleuria auraentia lectin lectins. Concanavalin A (ConA) detected the overall level of mannose and glucose residues and was used as control. Ponceau staining was used to verify equal loading. Bar diagrams depict intensity values normalized to HT-29 (in percent). (C) Staining of MGAT3 (green) in CRC cell lines. Nuclei were counterstained with DRAQ5 (blue). Scale bar = 25 μm. Bar diagram shows mean ± SD of single cell-corrected fluorescence intensity. Two-tailed unpaired Student t test was used for comparison between HT-29 (blue) and IFN-γ–resistant cell lines (red), with ***PSW620 = .000105, ****PSW480 < .0001, ****PHCT116 < .0001, ****PRKO < .0001, ****PDLD-1 < .0001. (D) CRC cell lines were stained with PHA-E lectin (red) and nuclei were counterstained with DRAQ5 (blue). Scale bar = 50 μm. Bar diagram shows mean ± SD of single cell-corrected fluorescence intensity. Two-tailed unpaired Student t test was used for comparison between HT-29 (blue) and IFN-γ–resistant cell lines (red), with ***PSW620 = .0007, **PSW480 = .0017, ***PHCT116 = .0008, ****PRKO < .0001, ***PDLD-1 = .00017.
Figure 6.
Figure 6.
MGAT3 downregulation reduces IFNγRα bisected N-glycosylation and signaling. (A) PHA-E lectin blotting in RKO cells after stable transfection of MGAT3 (clone 1 and 2) or empty vector (EV) (25 μg of proteins/lane). Ponceau staining served as loading control and for normalization. (B) MGAT3 and IFNγRα protein expression in MGAT3-reconstituted RKO clones or RKO-EV. GAPDH was used as loading control and for normalization. Normalized signal intensity IFNγRα is given with upper and lower bands highlighted in green and gray, respectively. (C) MGAT3 and ISG expression in IFN-γ stimulated RKO cells stably transfected with either MGAT3-expressing or empty vector (EV). Cells were stimulated with indicated amounts of IFN-γ for 24 h. (D) Normalized signal intensity of Western blot in (C). (E) Cell death induction was determined 72 hours after treatment of RKO-EV/-MGAT3 cells with IFN-γ (0–100 U/ml) by flow cytometry. Results are given in percent of apoptotic and necrotic cells (mean ± SD, n = 3 distinct samples). Student P test: n.s., not significant **PEV+/−IFN-γ = .009, **PMGAT3+/−IFN-γ = .0031, **PEV+IFN-γ/MAGT3++IFN-γ = .0077. (F) Staining of MGAT3 (pink) and IFNγRα (green) in consecutive human CRC sections. Scale bars = 100μ. (G) Single tumor-corrected fluorescence intensity of MGAT3 and IFNγRα consecutive staining (n = 12) with Pearson’s correlation coefficient r and P value.

References

    1. Galon J, Costes A, Sanchez-Cabo F, et al. Type, density, and location of immune cells within human colorectal tumors predict clinical outcome. Science 2006. 313:1960–1964. - PubMed
    1. Fridman WH, Pages F, Sautes-Fridman C, et al. The immune contexture in human tumours: impact on clinical outcome. Nat Rev Cancer 2012. 12:298–306. - PubMed
    1. Schreiber RD, Old LJ, Smyth MJ. Cancer immunoediting: integrating immunity’s roles in cancer suppression and promotion. Science 2011. 331:1565–1570. - PubMed
    1. Hoekstra ME, Bornes L, Dijkgraaf FE, et al. Long-distance modulation of bystander tumor cells by CD8+ T-cell-secreted IFN-γ. Nat Cancer 2020. 1:291–301. - PMC - PubMed
    1. Thibaut R, Bost P, Milo I, et al. Bystander IFN-γ activity promotes widespread and sustained cytokine signaling altering the tumor microenvironment. Nat Cancer 2020. 1:302–314. - PMC - PubMed

Publication types