. 2023 Feb 5;74(3):1074-1089.
doi: 10.1093/jxb/erac456.

The transcription factor OsWRKY10 inhibits phosphate uptake via suppressing OsPHT1;2 expression under phosphate-replete conditions in rice

Affiliations

The transcription factor OsWRKY10 inhibits phosphate uptake via suppressing OsPHT1;2 expression under phosphate-replete conditions in rice

Shichao Wang et al. J Exp Bot. .

Abstract

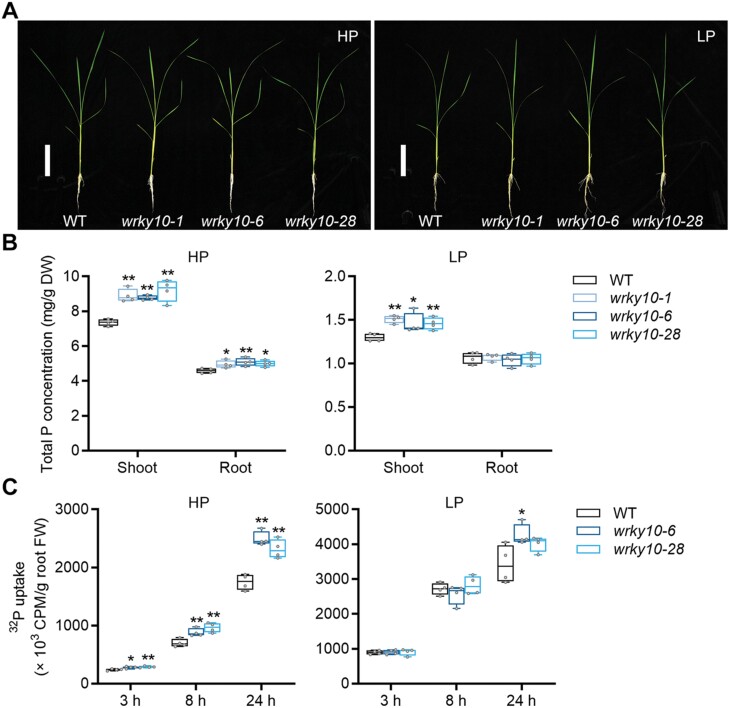
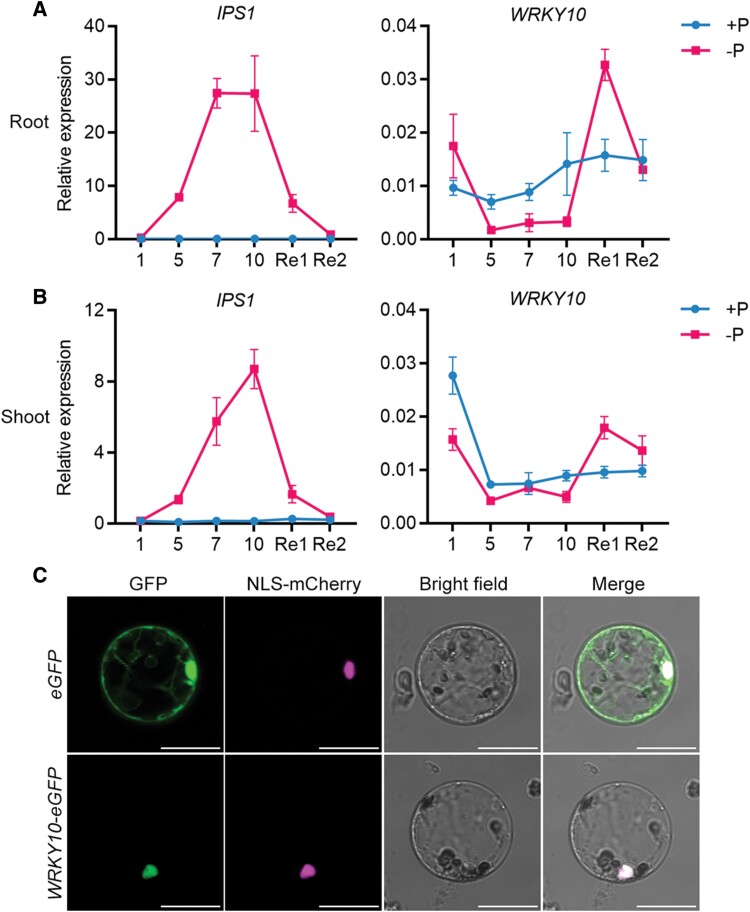
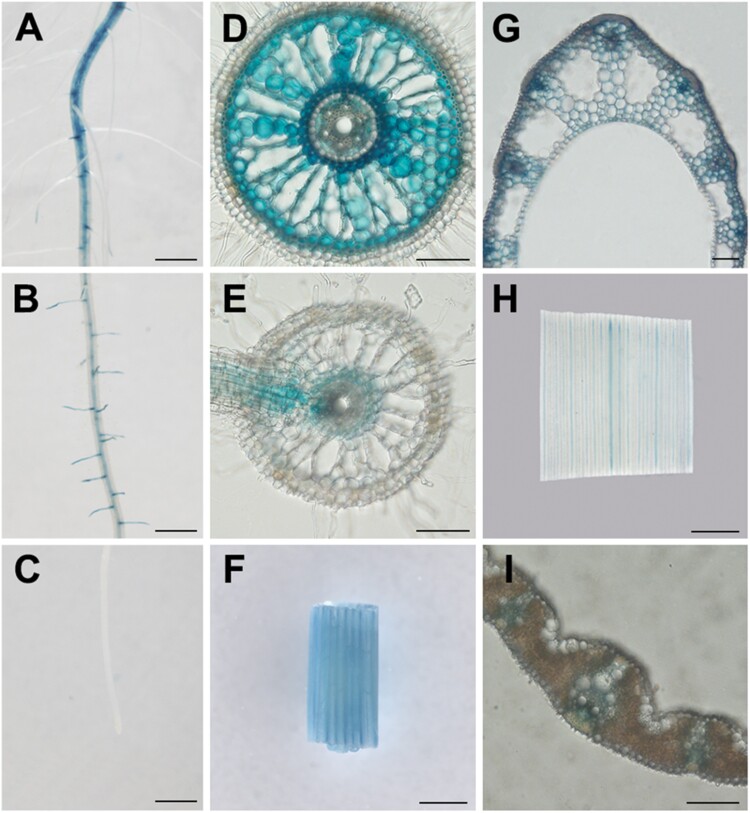
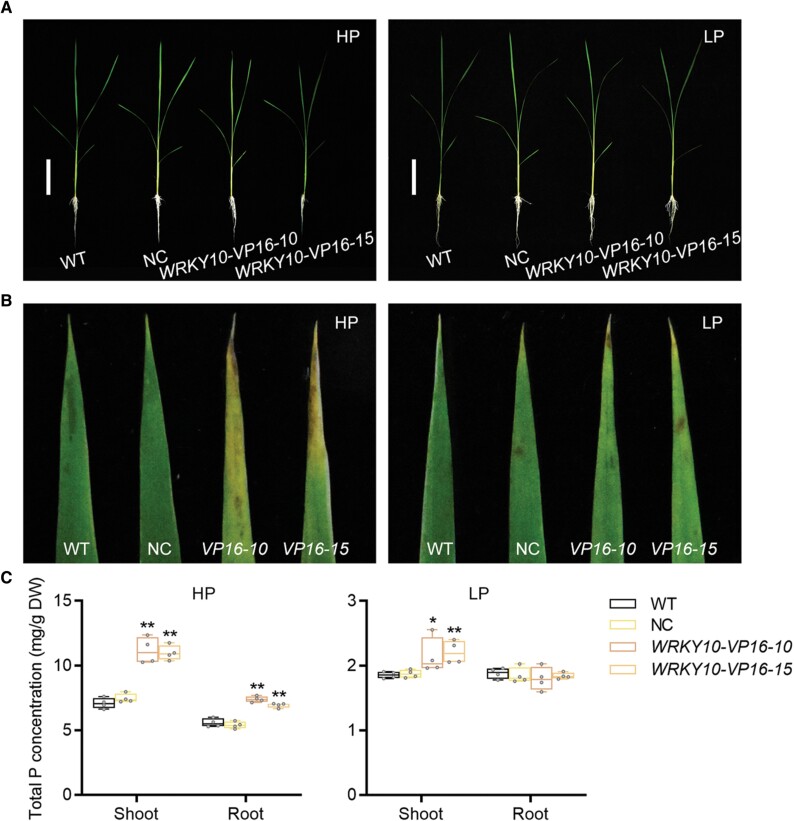
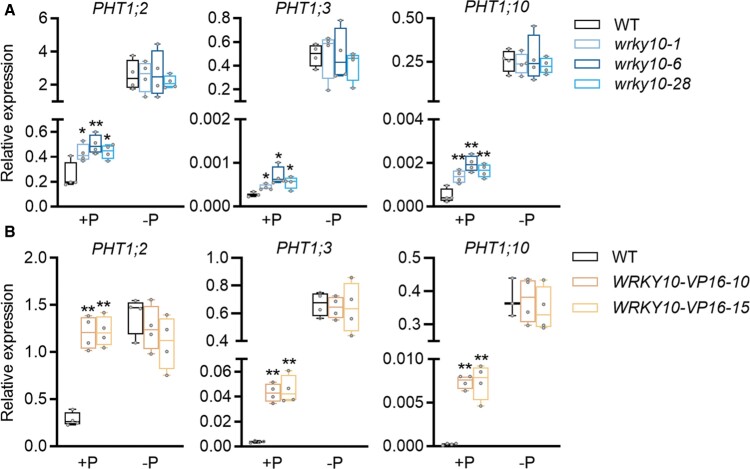
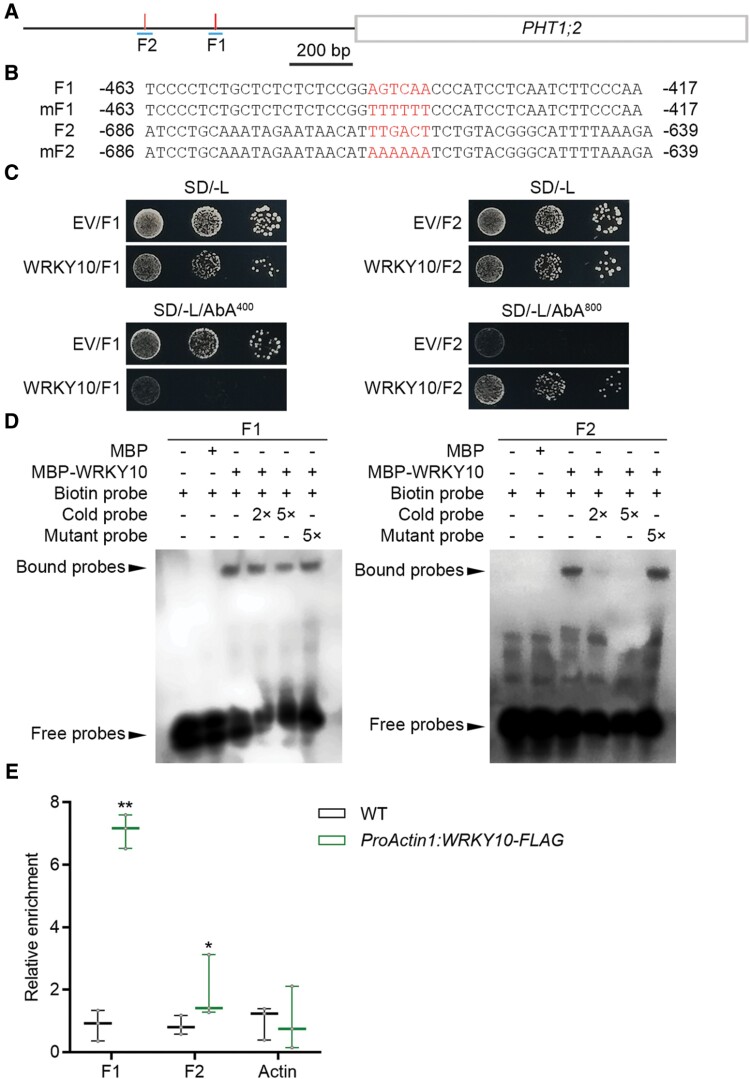
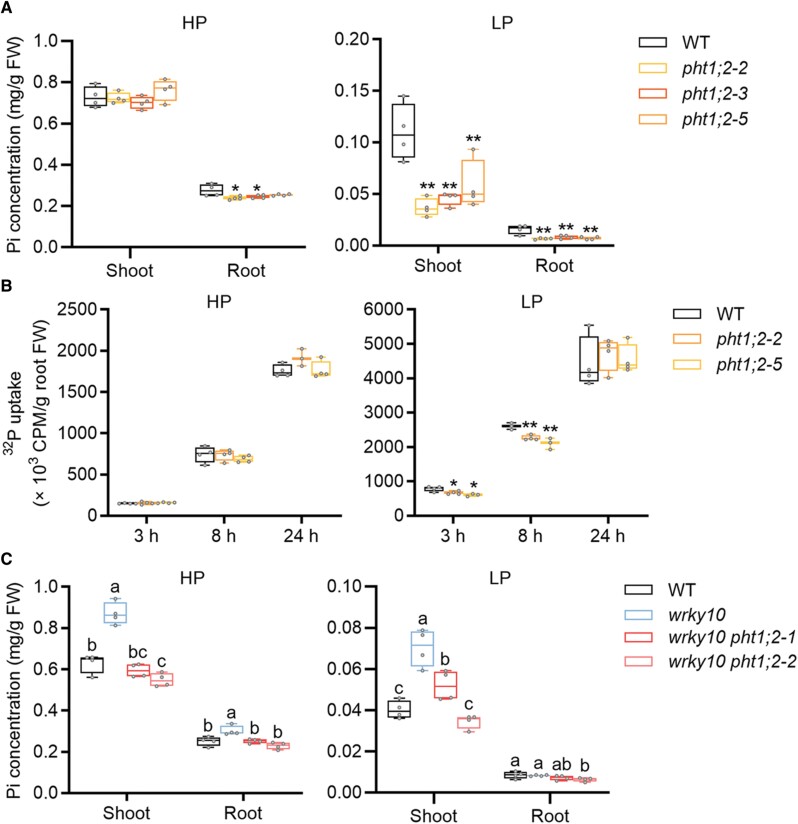
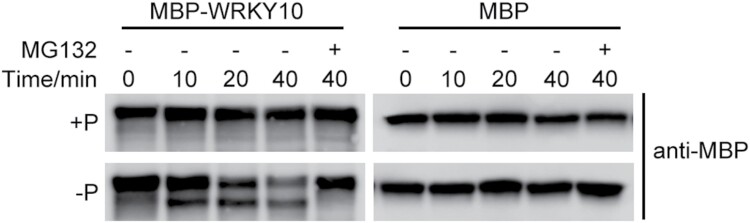
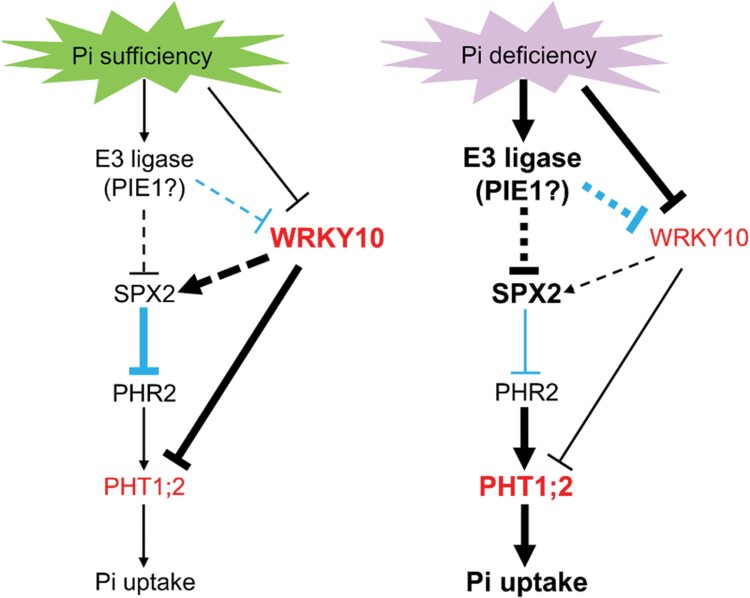
Plants have evolved delicate systems for stimulating or inhibiting inorganic phosphate (Pi) uptake in response to the fluctuating Pi availability in soil. However, the negative regulators inhibiting Pi uptake at the transcriptional level are largely unexplored. Here, we functionally characterized a transcription factor in rice (Oryza sativa), OsWRKY10. OsWRKY10 encodes a nucleus-localized protein and showed preferential tissue localization. Knockout of OsWRKY10 led to increased Pi uptake and accumulation under Pi-replete conditions. In accordance with this phenotype, OsWRKY10 was transcriptionally induced by Pi, and a subset of PHOSPHATE TRANSPORTER 1 (PHT1) genes were up-regulated upon its mutation, suggesting that OsWRKY10 is a transcriptional repressor of Pi uptake. Moreover, rice plants expressing the OsWRKY10-VP16 fusion protein (a dominant transcriptional activator) accumulated even more Pi than oswrky10. Several lines of biochemical evidence demonstrated that OsWRKY10 directly suppressed OsPHT1;2 expression. Genetic analysis showed that OsPHT1;2 was responsible for the increased Pi accumulation in oswrky10. Furthermore, during Pi starvation, OsWRKY10 protein was degraded through the 26S proteasome. Altogether, the OsWRKY10-OsPHT1;2 module represents a crucial loop in the Pi signaling network in rice, inhibiting Pi uptake when there is ample Pi in the environment.

Keywords: Negative regulation; WRKY transcription factor; phosphate signaling; phosphate transporter; phosphate uptake; phosphorus; rice.


Conflict of interest statement

No conflict of interest declared.

Figures

Fig. 1.
Fig. 1.
WRKY10 inhibits P accumulation and uptake in rice. Rice seeds were germinated in sterilized water and supplied with 1/2 strength Kimura B solution until the third leaf blades were fully expanded, and then treated with HP (90 μM) and LP (1 μM) until the sixth leaf blades were fully expanded. (A) Phenotype of wild-type (WT) and wrky10 mutant plants grown under HP (left) and LP (right) conditions. Scale bars=10 cm. (B) Total P concentration in shoot and root under HP (left) and LP (right) conditions. (C) Uptake of 32P-labeled Pi in WT and wrky10 mutant plants. Rice seeds were germinated in sterilized water and supplied with 1/2 strength Kimura B solution until the fourth leaf blades were fully expanded, treated under HP (left) and LP (right) nutrient solution for 10 d, and then transferred to a hydroponic solution containing 100 μM Pi labeled with 32P. The Pi uptake of the plants was monitored at 3, 8, and 24 h. All data are plotted with box–whisker plots: the whiskers represent maximum and minimum values, and boxes represent the upper quartile, median, and lower quartile. The results shown are from four biological replicates. Data significantly different from the corresponding controls are indicated (*P<0.05, **P<0.01; Student’s t-test).
Fig. 2.
Fig. 2.
Expression pattern of WRKY10 and subcellular localization of WRKY10. (A) and (B) Rice seeds were geminated in sterilized water and supplied with Yoshida solution until the third leaf blades were fully expanded, treated under +P (200 μM) and –P (0 μM) conditions for 10 d, and then supplied with Pi for 2 d. Shoot and root were sampled at 1, 5, 7, and 10 d after treatments, and at 1 d and 2 d after resupplying with Pi. IPS1 and WRKY10 were detected in root (A) and shoot (B). Values represent means ±SD of four biological replicates. (C) Subcellular localization of WRKY10. GFP alone or WRKY10 fused with GFP were transformed into rice protoplast. Green signals indicate GFP, magenta signals indicate nuclear localization signal (SV40 T-antigen NLS, Ji et al., 2016). Scale bars=20 μm.
Fig. 3.
Fig. 3.
Tissue localization of WRKY10. GUS activity in ProWRKY10:GUS. Transgenic plants grew at 1/2 strength Kimura B solution. (A–C) Different zones of rice root. (D) and (E) Cross-section of different zones in the root. (F) and (H) Leaf sheath and leaf blade, respectively. (G) and (I) Cross-section of leaf sheath and leaf blade, respectively. Scale bars in (A–C) and (F), (H) indicate 1000 μm; bars in (D), (E), (G), and (I) indicate 100 μm.
Fig. 4.
Fig. 4.
Expression of the fusion of WRKY10 and Virus Protein 16 (VP16) leads to increased P accumulation. Rice seeds were germinated in sterilized water and supplied with 1/2 strength Kimura B solution until the third leaf blades were fully expanded, and then treated with HP (90 μM) and LP (1 μM) until the sixth leaf blades were fully expanded; four biological repeats are set for each treatment. (A) Phenotype of wild-type (WT) and WRKY10-VP16 transgenic plants grown under HP (left) and LP (right) conditions. Scale bars=10 cm. (B) Phenotype of fourth leaf blades of WT and WRKY10-VP16 under HP (left) and LP (right) conditions. (C) Total P concentration in shoot and root under HP (left) and LP (right) conditions. All data are plotted with box–whisker plots: the whiskers represent maximum and minimum values, and boxes represent the upper quartile, median, and lower quartile. The results shown are from four biological replicates. Data significantly different from the corresponding controls are indicated (*P<0.05, **P<0.01; Student’s t-test). NC, negative control.
Fig. 5.
Fig. 5.
Alteration in the expression of three PHT1 genes in wrky10 mutants and WRKY10-VP16 plants. Rice seeds were geminated in sterilized water and supplied with 1/2 strength Kimura B solution until the third leaf blades were fully expanded, and then treated under +P (90 μM) and –P (0 μM) conditions until the sixth leaf blades were fully expanded; the root was harvested for RNA extraction and RT–qPCR. PHT1 gene expression was detected in wrky10 mutants (A) and WRKY10-VP16 plants (B). All data are plotted with box–whisker plots: the whiskers represent maximum and minimum values, and boxes represent the upper quartile, median, and lower quartile. The results shown are from four biological replicates. Data significantly different from the corresponding controls are indicated (*P<0.05, **P<0.01; Student’s t-test).
Fig. 6.
Fig. 6.
WRKY10 binds to the PHT1;2 promoter region in vitro and in vivo. (A) Schematic diagram of the 1000 bp promoter of PHT1;2. Two W-boxes are represented by short red vertical bars, and the relative positions of the two synthetic DNA probes, F1 and F2, are represented by the short blue lines under the W-boxes. (B) Sequence of probes. W-boxes of F1 and F2 or mutant bases of mF1 and mF2 are marked in red. (C) WRKY10 binds to the PHT1;2 promoter in yeast. F1 and F2 were each integrated into yeast genomic DNA as bait vectors, then WRKY10 or empty vector (EV) were transformed into yeast containing the bait vector. OD600 values of yeast cells grown in SD/-Leu medium were set as 10–1, 10–2, and 10–3. A 4 µl aliquot of diluted suspension was spotted on SD/-Leu medium with different concentrations of Aureobasidin A (AbA). (D) EMSA to detect the binding of WRKY10 to the PHT1;2 promoter in vitro. Each biotin-labeled probe was incubated with MBP or MBP–WRKY10 protein. Excess unlabeled probes (cold probe or mutant probe) were added to compete with biotin-labeled probes. The WRKY10–DNA complex (bound probes) and free DNA probes (free probes) are indicated by black arrows. (E) ChIP-qPCR assay to determine the binding of WRKY10 to the PHT1;2 promoter in vivo. Rice seeds of the wild type (WT) and ProActin1:WRKY10-FLAG were germinated in sterilized water and supplied with 1/2 strength Kimura B solution. The root was harvested for ChIP assay. Enrichment of each site was quantified using qPCR analysis. Data significantly different from the corresponding controls are indicated (*P<0.05, **P<0.01; Student’s t-test).
Fig. 7.
Fig. 7.
Genetic analysis of WRKY10 regulating PHT1;2 in rice. (A) Rice seeds were germinated in sterilized water and supplied with 1/2 strength Kimura B solution until the third leaf blades were fully expanded, and then treated with HP (90 μM) and LP (1 μM) until the sixth leaf blades were fully expanded. Shoot and root were harvested for Pi measurement. Pi concentration of wild-type (WT) and pht1;2 mutant plants in the shoot and root under HP (left) and LP (right) conditions. (B) Uptake of 32P-labeled Pi in WT and pht1;2 mutant plants. Rice seeds were germinated in sterilized water and supplied with 1/2 strength Kimura B solution until the fourth leaf blades were fully expanded, treated under high phosphate (HP; left panel) and low phosphate (LP; right panel) nutrient solution for 10 d, and then transferred to a hydroponic solution containing 100 μM Pi labeled with 32P. The Pi uptake of the plants was monitored at 3, 8, and 24 h. All data are plotted with box–whisker plots: the whiskers represent maximum and minimum values, and boxes represent the upper quartile, median, and lower quartile. The results shown are from four biological replicates. Data significantly different from the corresponding controls are indicated (*P<0.05, **P<0.01; Student’s t-test). (C) Pi concentration of wrky10 single mutant and wrky10 pht1;2 double mutant plants. Pi concentrations of shoot and root were measured and divided by HP (left) and LP (right). All data are plotted with box–whisker plots: the whiskers represent maximum and minimum values, and boxes represent the upper quartile, median, and lower quartile. The results shown are from four biological replicates. Different letters indicate significant differences in different tissues at P<0.05 (Duncan’s test).
Fig. 8.
Fig. 8.
WRKY10 is degraded at the post-translational level via the 26S proteasome pathway. Cell-free degradation assay of WRKY10. MBP fused with WRKY10 or MBP alone were expressed in E. coli and purified. A 100 ng aliquot of MBP–WRKY10 or MBP proteins was incubated with 20 μg of protein extracts from wild-type (WT) plants cultured under +P/–P conditions at 28 °C for different times without (–) or with (+) 40 μM MG132. MBP–WRKY10 or MBP proteins were detected by western blot using anti-MBP antibody.
Fig. 9.
Fig. 9.
Working hypothesis for the regulation of P homeostasis by WRKY10 and PHT1;2 in rice plants. Arrows indicate positive regulation, whereas lines ending with a short bar indicate negative regulation. The thickness of the lines is positively related to the strength of regulation. The dotted lines indicate regulations without direct experimental evidence. Black and blue lines indicate regulations at the transcriptional and post-translational levels, respectively. Larger and bold font size of the gene/protein names indicates a higher transcript/protein level. See text for a detailed description.

Similar articles

Cited by

References

    1. Ai PH, Sun SB, Zhao JN, et al. . 2009. Two rice phosphate transporters, OsPht1;2 and OsPht1;6, have different functions and kinetic properties in uptake and translocation. The Plant Journal 57, 798–809. - PubMed
    1. Ayadi A, David P, Arrighi JF, Chiarenza S, Thibaud MC, Nussaume L, Marin E.. 2015. Reducing the genetic redundancy of Arabidopsis PHOSPHATE TRANSPORTER1 transporters to study phosphate uptake and signaling. Plant Physiology 167, 1511–1526. - PMC - PubMed
    1. Bustos R, Castrillo G, Linhares F, Puga MI, Rubio V, Pérez-Pérez J, Solano R, Leyva A, Paz-Ares J.. 2010. A central regulatory system largely controls transcriptional activation and repression responses to phosphate starvation in Arabidopsis. PLoS Genetics 6, e1001102. - PMC - PubMed
    1. Campos-Soriano L, Bundó M, Bach-Pages M, Chiang SF, Chiou TJ, San Segundo B.. 2020. Phosphate excess increases susceptibility to pathogen infection in rice. Molecular Plant Pathology 21, 555–570. - PMC - PubMed
    1. Chang MX, Gu M, Xia YW, et al. . 2019. OsPHT1;3 mediates uptake, translocation, and remobilization of phosphate under extremely low phosphate regimes. Plant Physiology 179, 656–670. - PMC - PubMed

Publication types

MeSH terms