

Serum metabolomic characterization in pigs in relation to birth weight category and neonatal nutrition
- PMID: 36402552
- PMCID: PMC9976744
- DOI: 10.1093/jas/skac386
Serum metabolomic characterization in pigs in relation to birth weight category and neonatal nutrition
Abstract
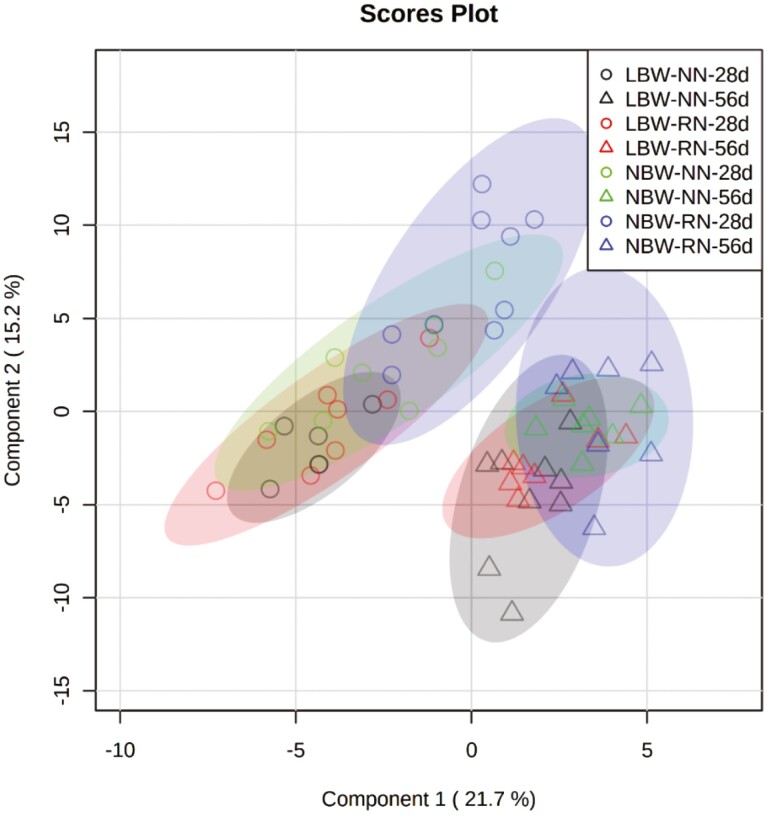
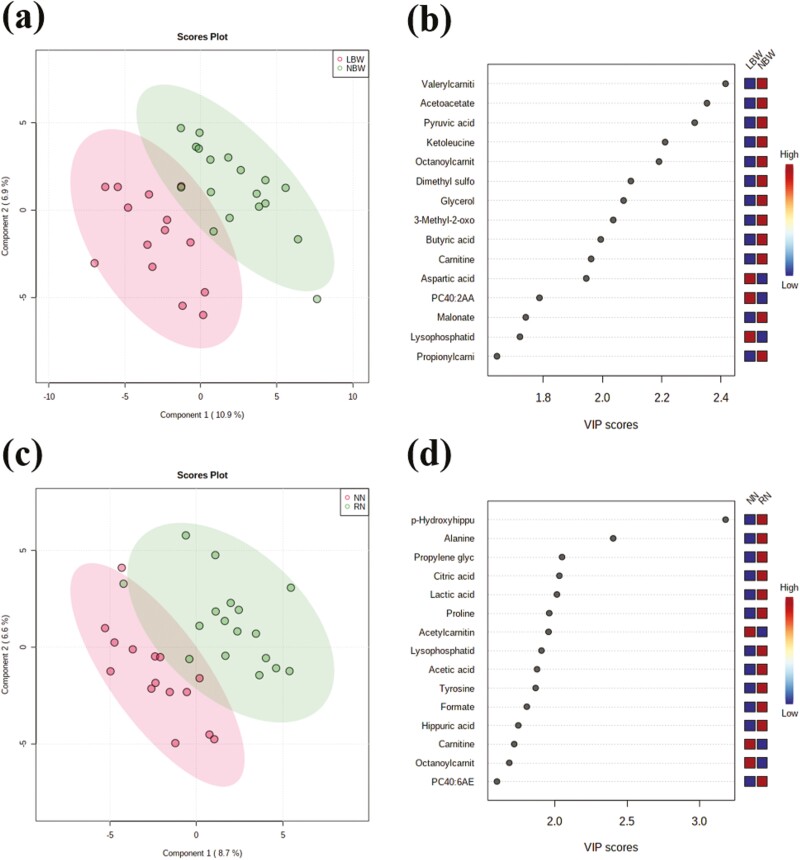
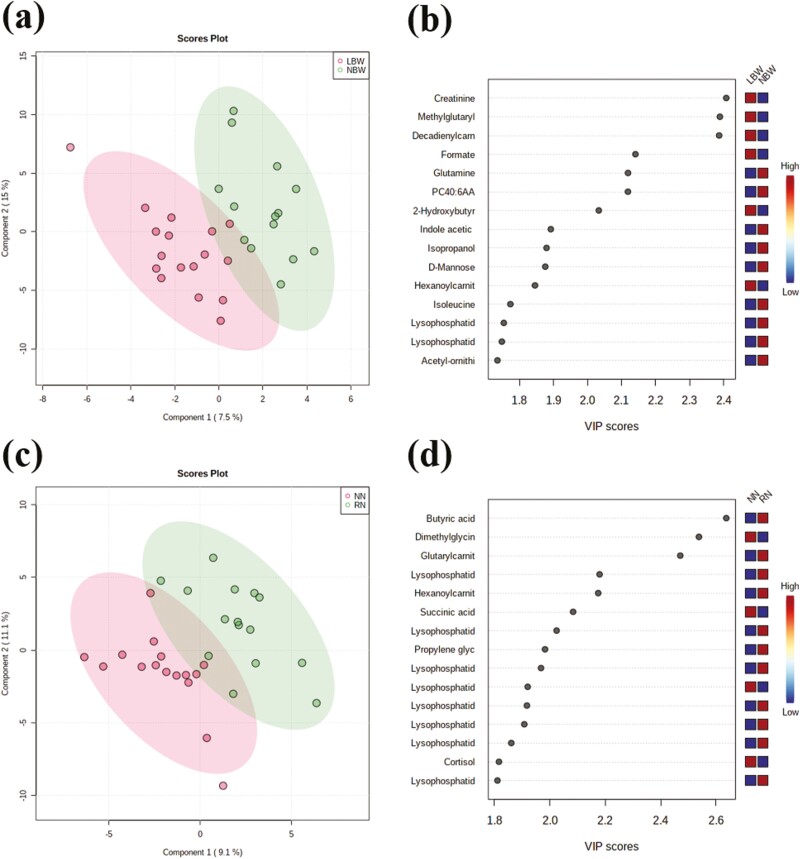
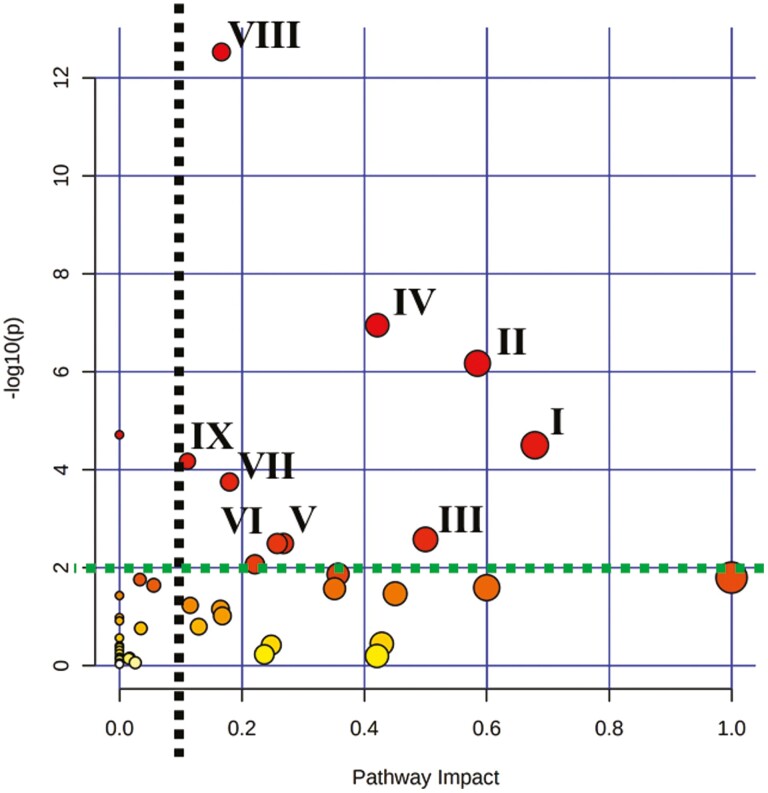
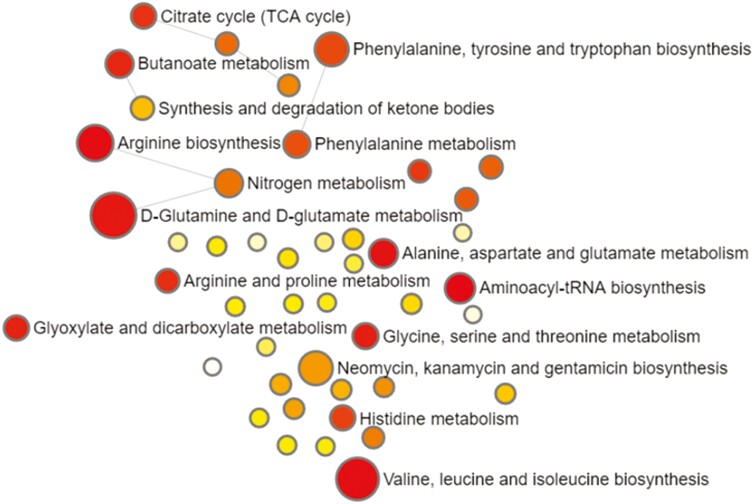
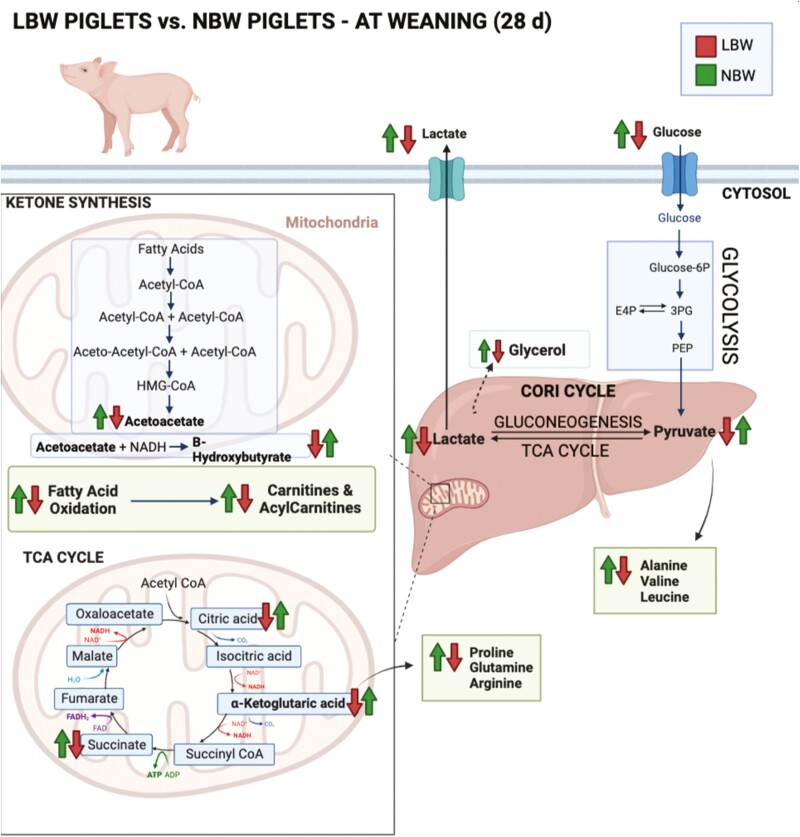
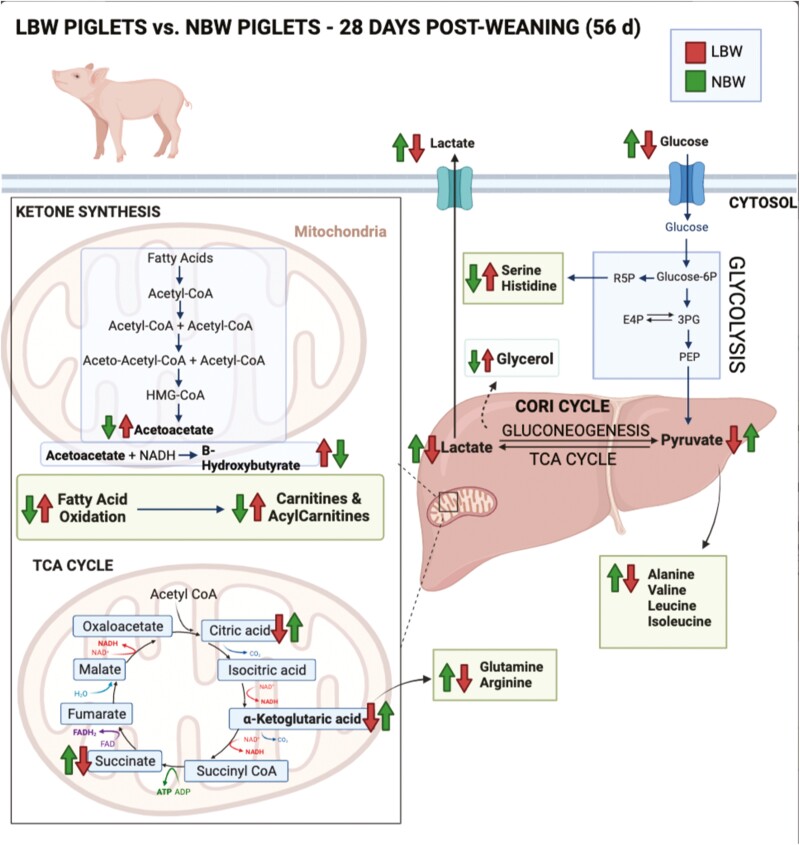
The objective of this study was to characterize developmental differences in low birth weight (LBW) and normal birth weight (NBW) piglets with or without pre-weaning nutrient restriction using serum metabolomic profile analysis. At farrowing, 112 piglets were identified as LBW (1.22 ± 0.28 kg) or NBW (1.70 ± 0.27 kg) and were randomly assigned to receive normal nutrition (NN) or restricted nutrition (RN) (6 h/day no suckling) from days 2 to 28 post farrow (n = 8 pigs/group). On day 28, piglets were weaned onto a common diet. Fasted blood samples were obtained on days 28 and 56 (n = 8 pigs/group) and were analyzed using quantitative metabolomics via a combination of direct injection mass spectrometry with a reverse-phase LC-MS/MS custom assay. Data were normalized using logarithmic transformation and auto-scaling. Partial least squares discriminant analysis (PLS-DA) was carried out to further explore the differential metabolites among the groups (metaboanalyst.ca) with an integrated enrichment and pathway topography analysis. On day 28, LBW piglets had lower levels of essential amino acids as well as reduced metabolites associated with fatty acid oxidation, glycolysis, and the tri-carboxylic acid (TCA) cycle compared to the NBW group. The overall reduction of metabolites associated with energy production and regulation suggests that LBW vs. NBW are in an energy-survival state. On day 56, LBW pigs had increased utilization of fatty acids and resultant ketone production, evident by increased carnitines, acetoacetate, β-hydroxybutyrate, and glycerol compared to NBW pigs. In addition, compared to the NBW pigs LBW pigs had a consistent decrease in serum glucose and lactate as well as reduced TCA cycle metabolites: pyruvate, succinate, citrate, and α-ketoglutaric acid similar to day 28. Low reliance on glycolysis and the TCA cycle and higher glycerol production in the LBW pigs may indicate impairments in glucose tolerance at 56 d. In summary, LBW piglets appear to have more metabolic alterations in early life, which is not resolved with adequate nutrition or refeeding and may elucidate physiological and metabolic mechanisms of poor growth and life performance compared to NBW pigs later in life.
Keywords: low birth weight; metabolomics; nutrition; piglets.
Plain language summary
The objective of this study was to characterize developmental differences in low birth weight (LBW) and normal birth weight (NBW) piglets with or without pre-weaning nutrient restriction using serum metabolomic profile analysis. Through the serum metabolite analysis, at weaning, we saw fewer metabolites associated with fatty acid oxidation, and glycolysis in the LBW pigs compared to the NBW, which suggests poor fatty acid and glucose metabolism in these piglets. After weaning, fatty acid metabolism is restored in both LBW and NBW piglets, but glucose and lactate levels remained lower in the LBW piglets, which may be indicative of impairment in glucose tolerance post-weaning. Therefore, in LBW piglets, poor metabolism of glucose at weaning could not be curtailed with nutrition intervention post-weaning.
© The Author(s) 2022. Published by Oxford University Press on behalf of the American Society of Animal Science. All rights reserved. For permissions, please e-mail: journals.permissions@oup.com.
Figures
Similar articles
-
Low birth weight and reduced postnatal nutrition lead to cardiac dysfunction in piglets.J Anim Sci. 2023 Jan 3;101:skad364. doi: 10.1093/jas/skad364. J Anim Sci. 2023. PMID: 37880833 Free PMC article.
-
Birth Weight and Nutrient Restriction Affect Jejunal Enzyme Activity and Gene Markers for Nutrient Transport and Intestinal Function in Piglets.Animals (Basel). 2021 Sep 11;11(9):2672. doi: 10.3390/ani11092672. Animals (Basel). 2021. PMID: 34573638 Free PMC article.
-
Glutamine supplementation moderately affects growth, plasma metabolite and free amino acid patterns in neonatal low birth weight piglets.Br J Nutr. 2022 Dec 28;128(12):2330-2340. doi: 10.1017/S0007114522000459. Epub 2022 Feb 11. Br J Nutr. 2022. PMID: 35144703 Free PMC article.
-
Association between low birth weight and impaired glucose tolerance in children: a systematic review and meta-analysis.Front Pediatr. 2024 May 9;12:1362076. doi: 10.3389/fped.2024.1362076. eCollection 2024. Front Pediatr. 2024. PMID: 38783917 Free PMC article.
-
Plasma metabolomics in male primary and functional hypogonadism.Front Endocrinol (Lausanne). 2023 May 26;14:1165741. doi: 10.3389/fendo.2023.1165741. eCollection 2023. Front Endocrinol (Lausanne). 2023. PMID: 37334300 Free PMC article. Review.
Cited by
-
Low birth weight and reduced postnatal nutrition lead to cardiac dysfunction in piglets.J Anim Sci. 2023 Jan 3;101:skad364. doi: 10.1093/jas/skad364. J Anim Sci. 2023. PMID: 37880833 Free PMC article.
-
Insight into the long-term impact of birth weight on intestinal development, microbial settlement, and the metabolism of weaned piglets.J Anim Sci. 2023 Jan 3;101:skad395. doi: 10.1093/jas/skad395. J Anim Sci. 2023. PMID: 38064718 Free PMC article.
-
A pre- and postnatal immune challenge influences muscle growth and metabolism in weaned pigs.J Anim Sci. 2024 Jan 3;102:skae350. doi: 10.1093/jas/skae350. J Anim Sci. 2024. PMID: 39529455
References
-
- Beaulieu, A. D., Aalhus J. L., Williams N. H., and Patience J. F.. . 2010. Impact of piglet birth weight, birth order, and litter size on subsequent growth performance, carcass quality, muscle composition, and eating quality of pork. J. Anim. Sci. 88:2767–2778. doi:10.2527/jas.2009-2222. - DOI - PubMed
-
- Canadian Council on Animal Care (CCAC). 2009. CCAC Guidelines on the care and use of farm animals in research, teaching and testing. The Care and Use of Farm Animals in Research, Teaching and Testing. Canadian Council on Animal Care, Ottawa, ON, Canada.
-
- Dąbek, A., Wojtala M., Pirola L., and Balcerczyk A.. . 2020. Modulation of cellular biochemistry, epigenetics and metabolomics by ketone bodies. Implications of the ketogenic diet in the physiology of the organism and pathological states. Nutrients 12:788. doi:10.3390/nu12030788. - DOI - PMC - PubMed
Publication types
MeSH terms
Substances
LinkOut - more resources
Full Text Sources
