. 2022 Nov 19;13(1):7090.
doi: 10.1038/s41467-022-34766-9.

PPARγ lipodystrophy mutants reveal intermolecular interactions required for enhancer activation

Affiliations

PPARγ lipodystrophy mutants reveal intermolecular interactions required for enhancer activation

Maria Stahl Madsen et al. Nat Commun. .

Abstract

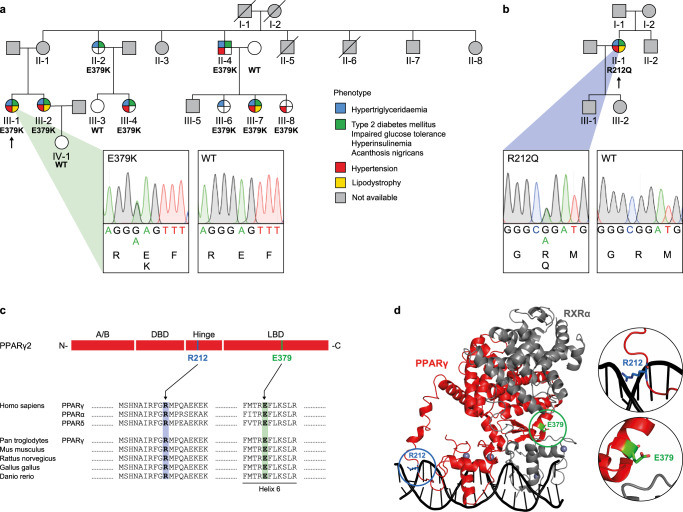
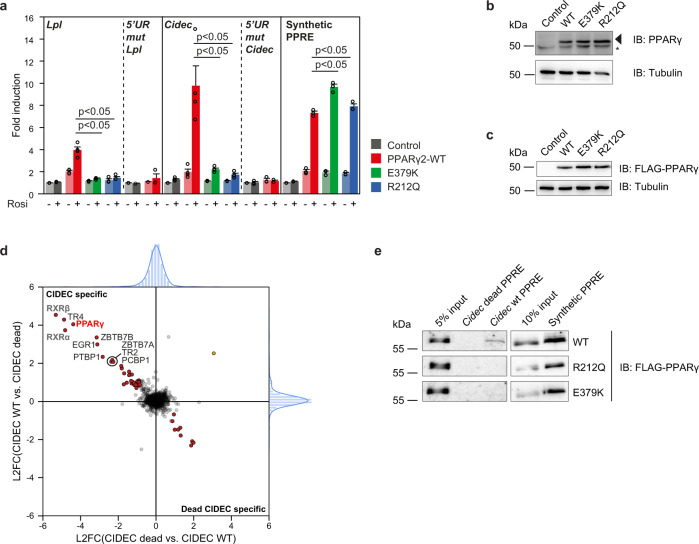
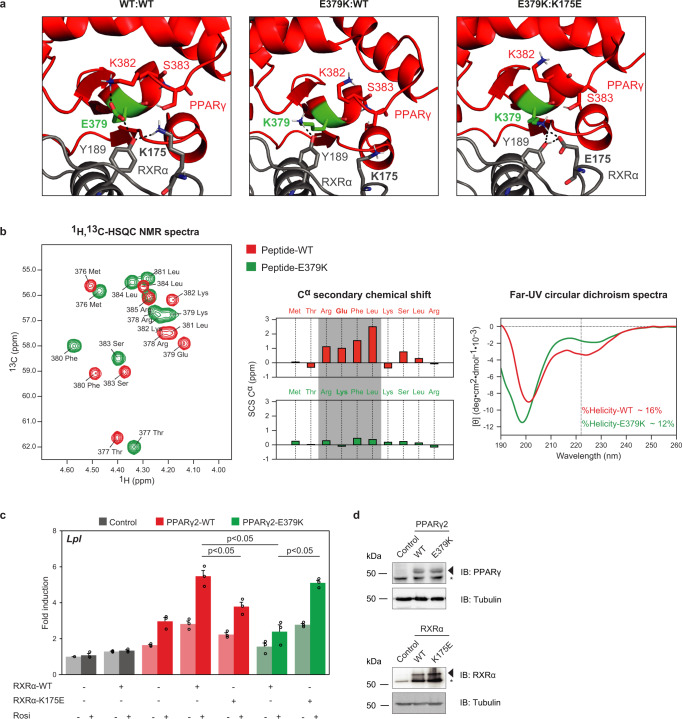
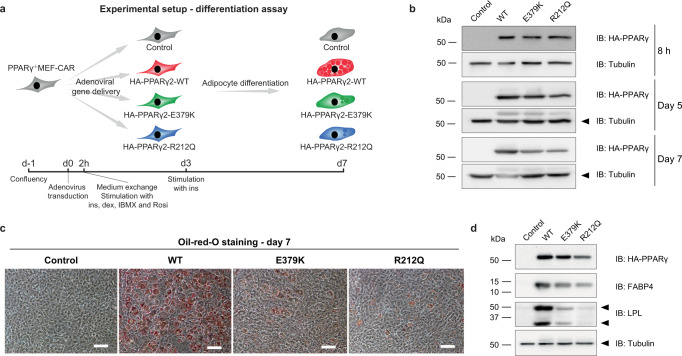
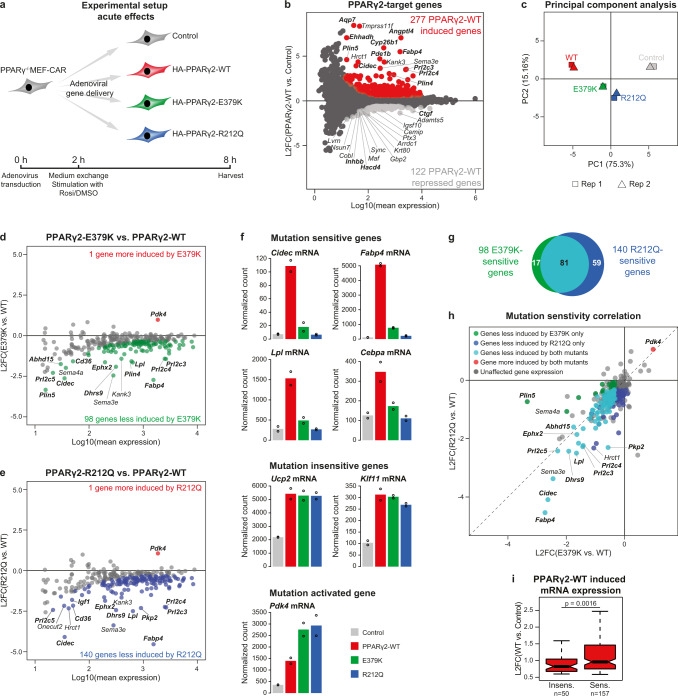
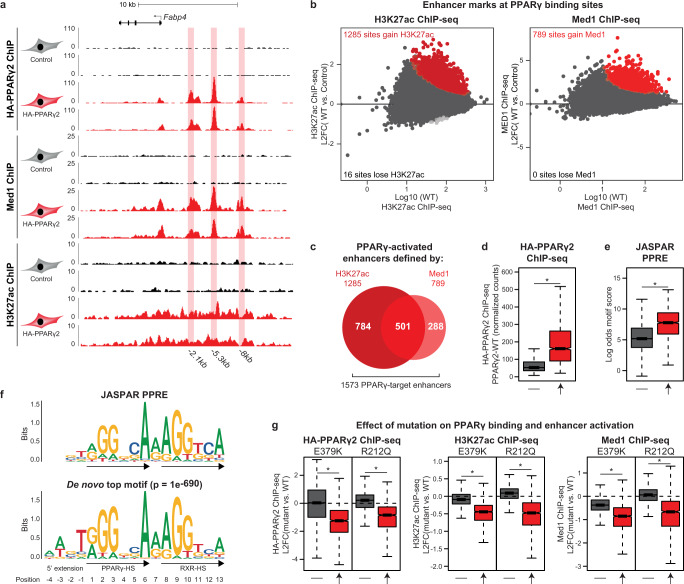
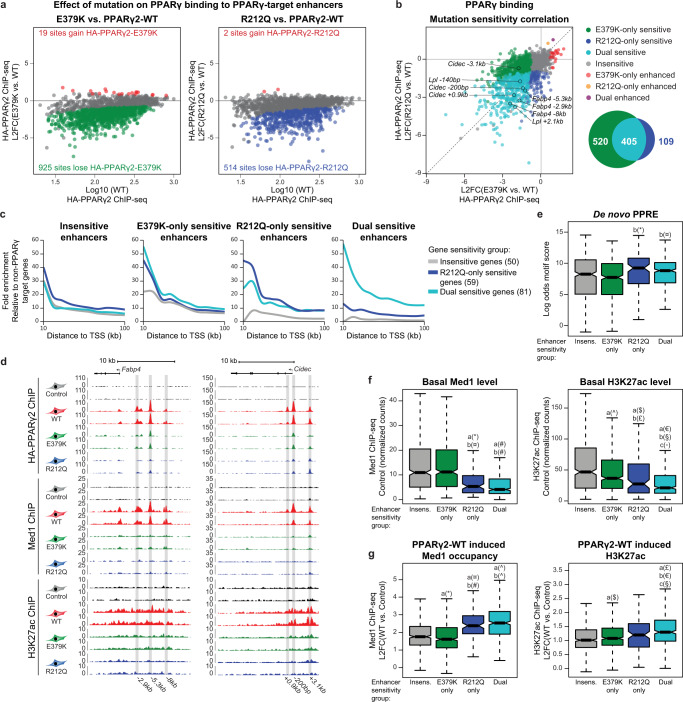
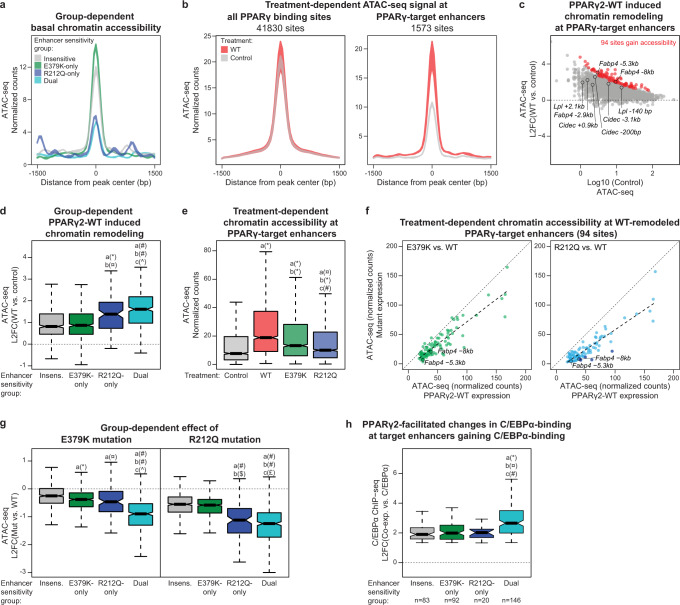
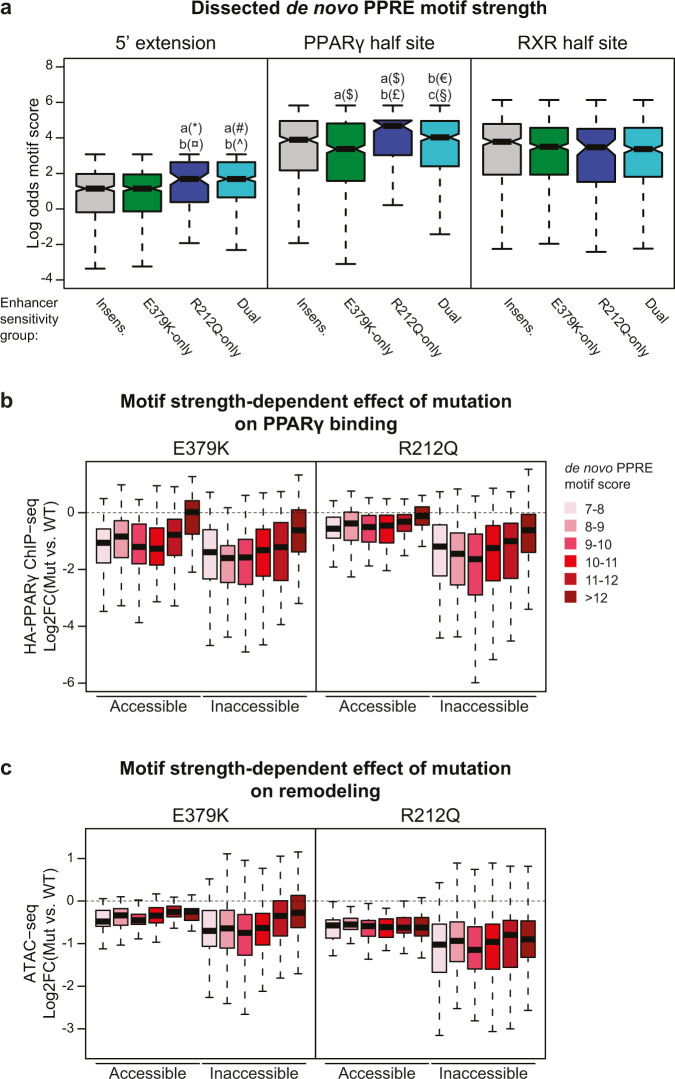
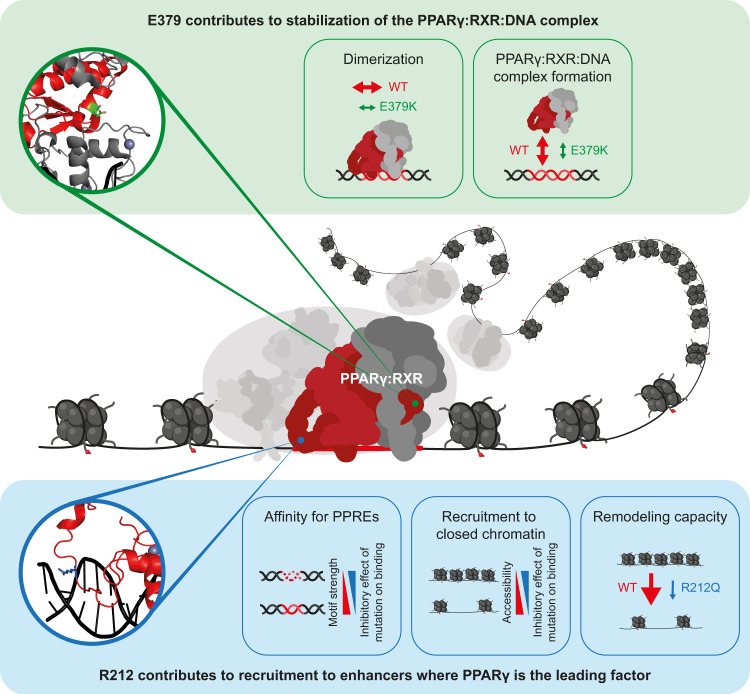
Peroxisome proliferator-activated receptor γ (PPARγ) is the master regulator of adipocyte differentiation, and mutations that interfere with its function cause lipodystrophy. PPARγ is a highly modular protein, and structural studies indicate that PPARγ domains engage in several intra- and inter-molecular interactions. How these interactions modulate PPARγ's ability to activate target genes in a cellular context is currently poorly understood. Here we take advantage of two previously uncharacterized lipodystrophy mutations, R212Q and E379K, that are predicted to interfere with the interaction of the hinge of PPARγ with DNA and with the interaction of PPARγ ligand binding domain (LBD) with the DNA-binding domain (DBD) of the retinoid X receptor, respectively. Using biochemical and genome-wide approaches we show that these mutations impair PPARγ function on an overlapping subset of target enhancers. The hinge region-DNA interaction appears mostly important for binding and remodelling of target enhancers in inaccessible chromatin, whereas the PPARγ-LBD:RXR-DBD interface stabilizes the PPARγ:RXR:DNA ternary complex. Our data demonstrate how in-depth analyses of lipodystrophy mutants can unravel molecular mechanisms of PPARγ function.


Conflict of interest statement

The authors declare no competing interests.

Figures

Fig. 1
Fig. 1. Identification of PPARγ2 E379K and R212Q.
a Family pedigree of index patient 1. Each family member is numbered for identification. The proband is indicated by an arrow. Squares and circles indicate males and females, respectively. Phenotypes are elaborated by color segments showing the presence of specific features. Gray symbols denote individuals that were not available for DNA analysis. Deceased individuals are indicated by a diagonal line through the symbol. DNA sequence analysis showing the heterozygous E379K mutation. The chromatogram shows both alleles from the patient (left panel) in comparison with corresponding genomic DNA from a non-affected individual (right panel). For tracing, the nucleotide and amino acid sequences are shown. b Family pedigree of index patient 2, harboring a heterozygous R212Q mutation. See description of panel a for details on representation. c Top: Schematic representation of domains in PPARγ2; N-terminal A/B-domain, DNA-binding domain (DBD), hinge region, and ligand-binding domain (LBD) and indicated positions of the two mutations. Bottom: Alignment of the amino acid sequence surrounding PPARγ2 E379K and R212Q between human PPAR subtypes and PPARγ between different species. Residue positions of E379 and R212 are highlighted in green and blue, respectively. d Crystal structure of PPARγ:RXRα heterodimer bound to DNA (PPARγ in red; RXRα in gray; PDB entry 3DZY). E379 (in green) at the end of helix 6 in PPARγ at the heterodimerization interface with RXRα DBD and R212 (in blue) in the hinge region of PPARγ are encircled. Both amino acid residues are indicated in stick format. Protein Database entry 3DZY. The figure is generated by open-source software PyMOL2 (www.pymol.org). A similar DNA-bound conformation based on SAXS was proposed by Bernardes et al..
Fig. 2
Fig. 2. E379K and R212Q mutants destabilize PPARγ:RXR binding to DNA in vitro.
a U2OS cells were transiently cotransfected with expression vectors encoding PPARγ-WT or mutants and different reporter constructs as indicated, in the absence or presence of 1 µM rosiglitazone. Activation of the reporter is expressed as fold induction over that with empty vector (control). Data are presented as mean values + SEM, with individual data points indicated with circles, n = 3–4 biologically independent experiments. One-way ANOVA with Tukey’s multiple comparisons were used to compare cells transfected with mutant vs. WT; *p < 0.05 cells transfected with mutant vs. WT. b Expression of the different PPARγ proteins transiently overexpressed in U2OS cells, as assessed by western blot. The arrow indicates PPARγ, and the asterisk indicates a non-specific band. Control, empty vector control; WT, PPARγ wild-type. Three independent experiments were performed and similar results were obtained. c Expression of the different FLAG-tagged PPARγ proteins stably overexpressed in U2OS cells, as assessed by western blot using a FLAG-tag antibody. Control, empty vector control; WT, wild-type. Three independent experiments were performed and similar results were obtained. d DNA affinity purification-mass spectrometry analysis of Cidec PPRE interactors. Forward and reverse experiments were performed using oligonucleotides containing the Cidec PPRE motif or a mutant version (Cidec dead), followed by dimethyl labeling and mass spectrometry analysis. Log2 ratios (L2FC) of all identified and quantified proteins (from nuclear extracts) in both experiments were plotted against each other. Proteins binding equally well to both oligonucleotides center around log2(ratio) = 0 and are marked in light gray. Proteins binding significantly better to the Cidec PPRE motif or the Cidec dead motif were determined by outlier statistics. These proteins are marked in red. e DNA affinity purification followed by western blot analysis were performed using oligonucleotides containing the Cidec PPRE motif, the Cidec dead motif and the synthetic PPRE motif. Pulldowns were performed using nuclear extracts containing the different FLAG-tagged PPARγ proteins. Three independent experiments were performed, and similar results were obtained. Source data for panel ac and e are provided in the Source Data file.
Fig. 3
Fig. 3. The PPARγ-E379K mutation alters interaction with RXRα.
a Structure analysis and computational modeling the crystal structure of an PPARγ:RXRα complex (PPARγ in red; RXRα in gray) bound to DNA using the HADDOCK2.2 web server shows a complex interaction network involving PPARγ-E379 and -K382 (LBD) and RXRα-Y189 and -K175 (DBD) in the WT complex (left panel). PPARγ-E379K alters the configuration of this interface (middle panel). Double charge reversal mutations in PPARγ (E379K) and RXRα (K175E) can restore the PPARγ LBD-RXRα DBD interface through a novel electrostatic interaction (right panel) (PDB entry 3DZY). Amino acid residues involved in the PPARγ LBD-RXRα DBD interface are indicated in the stick format. The figures were generated by PyMOL Molecular Graphics System Version 1.8 (2015) provided by SBGrid. b Spectroscopic analyses of helix 6 peptides. Left panel: 1H,13C-HSQC spectra of PPARγ-WT376–385 (red) and -PPARγ-E379K376–385 (green) recorded in 20 mM Na2HPO4 /NaH2PO4 (pH 7.4) at 25 °C and overlaid. Signals originate from Cα. Middle panel: The Cα secondary chemical shifts (SCSs) for both the WT peptide (red) and the E379K variant (green). In the WT peptide, Arg378–Leu381 showed consecutive positive Cα SCSs, indicating transient helical structure (gray box). Right panel: Far-UV CD spectra of PPARγ-WT376–385 (red) and PPARγ-E379K376–385 (green) recorded at 25 °C in 20 mM Na2HPO4/NaH2PO4 (pH 7.4). Dashed vertical line indicated the minimum at 222 nm for α-helix structure. c HEK293T cells were transiently cotransfected with expression vectors encoding WT or mutant PPARγ, WT or mutant RXRα, and the Lpl PPRE-minimal promoter-reporter, in the absence or presence of 1 µM rosiglitazone. Activation of the reporter is expressed as fold induction over empty vector (control). Data are presented as mean values + SEM, with individual data points indicated with circles, n = 3 biologically independent experiments. One-way ANOVA with Tukey’s multiple comparisons were used to compare cells transfected with mutant vs. WT; *p < 0.05. d Overexpression of the different PPARγ and RXRα proteins in HEK293T cells, as assessed by western blot analyses using a PPARγ- or RXRα- specific antibody. The arrows indicate PPARγ or RXRα, and the asterisk indicates an unknown non-specific band. Control, empty vector control; WT, wild-type. Three independent experiments were performed, and similar results were obtained. Source data for panel bd are provided in the Source Data file.
Fig. 4
Fig. 4. E379K and R212Q impair the adipogenic capacity of PPARγ2.
a Experimental outline showing the timing of the transduction of PPARγ−/− MEF-CAR cells with adenovirus containing HA-tagged PPARγ2-WT or mutants, and treatment of the transduced cells with the differentiation cocktails (2h-day 3: insulin, dexamethasone, isobutylmethylxanthine, and rosiglitazone, day 3–7: insulin). b Western blot assessing the expression of WT and mutant PPARγ2 at the timepoints 8 h, day 5 and day 7 after adenoviral transduction. The membrane was probed with antibodies against HA-tagged PPARγ and Tubulin (internal control). Three independent experiments were performed, and similar results were obtained. c Oil-red-O staining of lipid droplets at day 7 of differentiation. Three independent experiments were performed and similar results were obtained. Scale bar, 50 µm. d Western blot 7 days after adenoviral transduction. The membrane was probed with antibodies against HA-tagged PPARγ, FABP4, LPL, and Tubulin (internal control). After correction for tubulin and PPARγ levels, relative protein levels for FABP4 were 77% (E379K) and 79% (R212Q) of WT levels, and for LPL 33% (E379K) and 28% (R212Q). Three independent experiments were performed and similar results were obtained. Source data for panel b and d are provided in the Source Data file.
Fig. 5
Fig. 5. The E379K and R212Q mutants display partial deregulation of PPARγ-target genes.
a Experimental outline showing the timing of virus transduction, ligand stimulation (1 µM Rosiglitazone) and harvest of PPARγ−/− MEF-CAR cells to investigate acute transcriptional changes upon introduction of WT and mutant PPARγ2s. b Identification of PPARγ2-target genes from RNA-seq data. PPARγ2-WT induced (red dots) and repressed (light gray dots) genes are defined using DESeq2 with Benjamini–Hochberg correction (padj. <0.05, two-sided) and increasing or decreasing by a fold change >1.5 compared to control cells, respectively. Black dots represent unaffected genes. L2FC, log2 fold change. Top-15 most induced and repressed genes are indicated, with genes known to be involved in adipocyte biology marked in bold. c Variance in RNA-seq data (n = 2 independent biological experiments). Identification of d E379K-sensitive and e R212Q-sensitive PPARγ2-target genes. Red dots represent genes more induced by mutant compared to WT PPARγ2 (padj.(mut vs. WT) < 0.05, FC (mut vs. WT) > 1.25). Green and blue dots represent genes less induced by E379K and R212Q compared to WT, respectively (padj.(mut vs. WT) < 0.05, FC (mut vs. WT) < −1.25). Statistical significance was determined by DESeq2 using Benjamini–Hochberg correction, two-sided test. L2FC, log2 fold change. Top-15 less induced genes are indicated. Genes known to be involved in adipocyte biology are marked in bold. f Bar plots indicating RNA-seq based expression of selected PPARγ2-target genes. Bars represents mean of independent biological replicates (n = 2), dots indicate individual replicates. g Venn diagram representing overlap of genes that are significantly downregulated by PPARγ2-E379K and -R212Q. h Correlation of sensitivity to the E379K and R212Q mutations relative to WT (L2FC, log2 fold change). Top-10 most affected genes for each mutant vs. WT is indicated. i Boxplot displaying induction levels for genes affected by one or both mutations (sens., n = 157) or genes changing less than 25% (mutant vs. WT) (insens., n = 50). L2FC, log2 fold change. Data are presented as notch, median; box, first and third quartiles; whiskers, 1.5 times the interquartile range. Statistical significance was determined by two-sided unpaired two-samples Wilcoxon–Mann–Whitney test. Source data for panel bi are provided in the Source Data file.
Fig. 6
Fig. 6. A subset of PPARγ-bound sites are functional PPARγ-target enhancers.
a UCSC Genome Browser screenshot showing HA-PPARγ, Med1, and H3K27ac ChIP-seq in control and PPARγ2-WT expressing cells at the Fabp4-locus. PPARγ-binding sites (identified using Homer findPeaks and extended to 500 bp and passing a cutoff of <35 tags) are highlighted. Annotation of PPARγ-binding sites are relative to the transcriptional start site (TSS) of Fabp4. b Identification of enhancers activated by PPARγ2-WT. H3K27ac and Med1 ChIP-seq signal was counted within 41830 PPARγ binding sites extended ±1500 bp (H3K27ac) or ±250 bp (Med1) from peak center. Red and light gray points indicate enhancers that gain or lose ChIP-seq signal, respectively, upon PPARγ2-WT expression. Significance was determined by DESeq2 with Benjamini–Hochberg correction, two-sided test(FDR < 0.1). L2FC, log2 fold change. c Venn diagram showing the number of activated enhancers defined by gain in H3K27ac and/or Med1 ChIP-seq signal, in total identifying 1573 PPARγ-target enhancers. d Boxplot of PPARγ ChIP-seq signal in enhancers that does not gain or lose enhancer activity upon PPARγ2-WT expression (−, n = 40241), or at PPARγ-target enhancers as defined in panel b, c (↑, n = 1573). e JASPAR PPRE-motif score of the highest scoring motif within ±100bp from peak center. −: Non-activated enhancers, ↑: PPARγ-target enhancers. f Position weight matrix (PWM) for the JASPAR PPRE (top) and the de novo top motif (bottom). De novo motif search was made using Homer findMotifsGenome and searched within ±100 bp of peak center of PPARγ-target enhancers with motif length of 15–17 bases. PPAR-HS PPAR-half site, RXR-HS RXR-half site. g Mutations affect primarily PPARγ-target enhancers. Boxplots showing the log2 fold change (L2FC) (mutant vs. WT) for HA-PPARγ, H3K27ac, and Med1 ChIP-seq signal in non-activated (−) and activated (↑) enhancers. For all boxplots, data are presented as notch, median; box, first and third quartiles; whiskers, 1.5 times the interquartile range. *p < 2e-16 using two-sided unpaired two-samples Wilcoxon–Mann–Whitney test. Source data for panel b, and dg are provided in the Source Data file.
Fig. 7
Fig. 7. PPARγ target enhancers display different sensitivity to mutations dependent on basal enhancer activity.
a MA-plots of PPARγ2-E379K (left) and PPARγ2-R212Q (right) binding relative to PPARγ2-WT binding (L2FC, log2 fold change). Gained and lost binding is defined by padj. (mut vs. WT) < 0.05 (DESeq2 with Benjamini–Hochberg correction, two-sided) and the binding intensity (mut vs. WT) increasing or decreasing by at least 25%, respectively. b Correlation of sensitivity to E379K mutation and R212Q mutation (left) (L2FC, log2 fold change). Selected enhancers are indicated. Venn-diagram of enhancers with mutation-facilitated reduced PPARγ-binding (right). c Enrichment of enhancers in the vicinity of PPARγ-target genes relative to the number of enhancers in the vicinity of 200 randomly selected genes not regulated by PPARγ. R212Q-only and dual-sensitive genes are defined as in Fig. 5h. Insensitive target genes are changing less than 25% comparing mutant vs. WT PPARγ. E379K-only sensitive genes are excluded from the analysis as the gene group is very small (17 genes). (TSS, transcriptional start site). d UCSC Genome Browser track showing HA-PPARγ, Med1, and H3K27ac ChIP-seq at the Fabp4-locus (left) and Cidec- locus (right). PPARγ-target enhancers are highlighted. e Boxplot of log odds motif score for the de novo PPRE within groups of enhancers. Significance was assessed by two-sided pairwise Wilcoxon rank sum tests with Benjamini–Hochberg correction, a, versus insensitive enhancer group (insens., n = 519); b, versus E379K-only sensitive enhancer group (n = 520); c, versus R212Q-only sensitive enhancer group (n = 109); dual-sensitive group (n = 405), *p = 0.0005, ¤p = 5.7e-5. f Boxplot of basal Med1 (left) and H3K27ac (right) ChIP-seq signal within enhancer groups. Significance was assessed as in panel e. *p = 4.8e-10, ¤p = 3.3e-10, #p < 2e-16, ^p = 0.0030, $p = 0.00062, £p = 0.024, p < 2e-16, §p = 2.4e-14, p = 0.046. g Boxplot of PPARγ2-WT induced changes in Med1 and H3K27ac ChIP-seq signal within enhancer groups (L2FC, log2 fold change). Significance was assessed as in panel e. *p = 0.0037, ¤p = 1.4e-11, #p = 4.3e-16, ^p < 2e-16, $p = 0.024, £p = 9.4e-12, p = 1.1e-7, §p = 0.049. Data in boxplots are presented as notch, median; box, first and third quartiles; whiskers, 1.5 times the interquartile range. Source data for panel ac and ef are provided as a Source Data file.
Fig. 8
Fig. 8. R212Q-sensitive enhancers are found in less accessible regions of the chromatin.
a Enhancer group-dependent ATAC-seq signal in control cells. Colored area represents the difference between the two replicates. b Treatment-dependent ATAC-seq signal from control and PPARγ2-WT expressing PPARγ−/− MEF-CAR cells on all PPARγ binding sites (left) or PPARγ-target enhancers (right). Colored area represents the difference between the two replicates. c MA-plot of PPARγ2-WT induced chromatin accessibility at PPARγ-target enhancers (L2FC, log2 fold change). Gained accessibility is defined using DESeq2 with Benjamini–Hochberg correction, two-sided test, padj <0.05, L2FC(WT vs. control) > 0. Selected enhancers are indicated. d Enhancer group-dependent PPARγ2-WT induced chromatin remodeling. Significance was assessed by two-sided pairwise Wilcoxon rank sum tests with Benjamini–Hochberg correction, a, versus insensitive enhancer group (n = 519); b, versus E379K-only sensitive enhancer group (n = 520); c, versus R212Q-only sensitive enhancer group (n = 109), dual-sensitive enhancer group (n = 405), *p = 1.7e-7, ¤p = 4.7e-7, #p < 2e-16, ^p = 0.01. e Treatment-dependent ATAC-seq signal at PPARγ-target enhancers (n = 1573). Significance was assessed by two-sided pairwise Wilcoxon rank sum tests with Benjamini–Hochberg correction, a, versus control; b, versus WT expression; c, versus E379K-expression, *p < 2e-16, ¤p = 2.3e-9, #p = 6.8e-9. f ATAC-seq signal of E379K (left) and R212Q (right) treated cells relative to the WT ATAC-seq signal at enhancers where PPARγ2-WT significantly induces remodeling (94 sites defined in panel c). Linear models fitting the data are indicated with dashed lines. Enhancers that significantly lose ATAC-seq signal upon R212Q mutation are marked with dark blue (DESeq2 with Benjamini–Hochberg correction, two-sided test, padj <0.05, L2FC(R212Q vs. WT) < 0). Selected enhancers are indicated. g Mutation-induced changes in remodeling capacity within enhancer groups. Significance was assessed as in panel d. *p = 1.2e-6, ¤p = 0.00027, #p < 2e-16, ^p = 1.9e-11, $p = 8e-16, £p = 0.043. h Enhancer group-dependend PPARγ-induced gain in C/EBPα ChIP-seq signal upon PPARγ2 and C/EBPα co-expression in PPARγ−/− MEF-CAR cells. Data from Madsen et al.. Significance was assessed as in panel d. *p = 2.2e-6, ¤p = 1.7e-6, #p = 0.0014. Data in boxplots are presented as notch, median; box, first and third quartiles; whiskers, 1.5 times the interquartile range. Source data are provided in the Source Data file.
Fig. 9
Fig. 9. R212Q-sensitive enhancers are characterized by a stronger 5’-extension and PPARγ-half site.
a The de novo PPRE (Fig. 6f) was dissected into the 5’ extension, PPARγ-half site, and RXR-half site and the motif strength was assessed within these sections for each group of enhancers. Significance was assessed by two-sided pairwise Wilcoxon rank sum tests with Benjamini–Hochberg correction, a, versus insensitive enhancer group (n = 519); b, versus E379K-only sensitive enhancer group (n = 520); c, versus R212Q-only sensitive enhancer group (n = 109), dual-sensitive enhancer group (n = 405), *p = 0.00022, ¤p = 5.8e-5, #p = 5.7e-10, ^p = 8.1e-12, $p = 0.0052, £p = 2e-5, p = 0.0037, §p = 0.011. Boxplots are presented as notch, median; box, first and third quartiles; whiskers, 1.5 times the interquartile range. b, c PPARγ-target enhancers were divided into accessible (normalized counts > 15 tags) and inaccessible (normalized counts <15 tags) enhancers based on the ATAC-seq data. The effect of mutation on b PPARγ binding and c ATAC-seq signal was assayed dependent on the PPRE-motif strength within the PPARγ-target enhancer. Accessible enhancers: nMotif score 7–8 = 53; nMotif score 8–9 = 53; nMotif score 9–10 = 63; nMotif score 10–11 = 55; nMotif score 11–12 = 26; nMotif score >12 = 27. Inaccessible enhancers: nMotif score 7–8 = 92; nMotif score 8–9 = 129; nMotif score 9–10 = 142; nMotif score 10–11 = 176; nMotif score 11–12 = 92; nMotif score >12 = 95. Boxplots are presented as bold line, median; box, first and third quartiles; whiskers, 1.5 times the interquartile range. Source data are provided in the Source Data file.
Fig. 10
Fig. 10. Model illustrating how E379K and R212Q lipodystrophy mutants reveal important interaction interfaces in the PPARγ:RXR:DNA complex.
Central panel: PPARγ:RXR:DNA ternary complex with the respective positions of E379 and R212 residues based on the crystal structure. Top panel: the molecular effect of the E379K mutation. Lower panel; the molecular effect of the R212Q mutant. See text for further explanation.

References

    1. Lefterova MI, Haakonsson AK, Lazar MA, Mandrup S. PPARγ and the global map of adipogenesis and beyond. Trends Endocrinol. Metab. 2014;25:293–302. doi: 10.1016/j.tem.2014.04.001. - DOI - PMC - PubMed
    1. Broekema MF, Savage DB, Monajemi H, Kalkhoven E. Gene-gene and gene-environment interactions in lipodystrophy: lessons learned from natural PPARγ mutants. Biochim. Biophys. Acta Mol. Cell Biol. Lipids. 2019;1864:715–732. doi: 10.1016/j.bbalip.2019.02.002. - DOI - PubMed
    1. Nielsen R, et al. Genome-wide profiling of PPARgamma:RXR and RNA polymerase II occupancy reveals temporal activation of distinct metabolic pathways and changes in RXR dimer composition during adipogenesis. Genes Dev. 2008;22:2953–2967. doi: 10.1101/gad.501108. - DOI - PMC - PubMed
    1. Soccio RE, et al. Genetic variation determines PPARγ function and anti-diabetic drug response in vivo. Cell. 2015;162:33–44. doi: 10.1016/j.cell.2015.06.025. - DOI - PMC - PubMed
    1. IJpenberg A, Jeannin E, Wahli W, Desvergne B. Polarity and specific sequence requirements of peroxisome proliferator-activated receptor (PPAR)/retinoid X receptor heterodimer binding to DNA. A functional analysis of the malic enzyme gene PPAR response element. J. Biol. Chem. 1997;272:20108–20117. doi: 10.1074/jbc.272.32.20108. - DOI - PubMed

Publication types