. 2022 Nov 19;13(1):7113.
doi: 10.1038/s41467-022-34907-0.

BRAF activation by metabolic stress promotes glycolysis sensitizing NRASQ61-mutated melanomas to targeted therapy

Affiliations

BRAF activation by metabolic stress promotes glycolysis sensitizing NRASQ61-mutated melanomas to targeted therapy

Kimberley McGrail et al. Nat Commun. .

Abstract

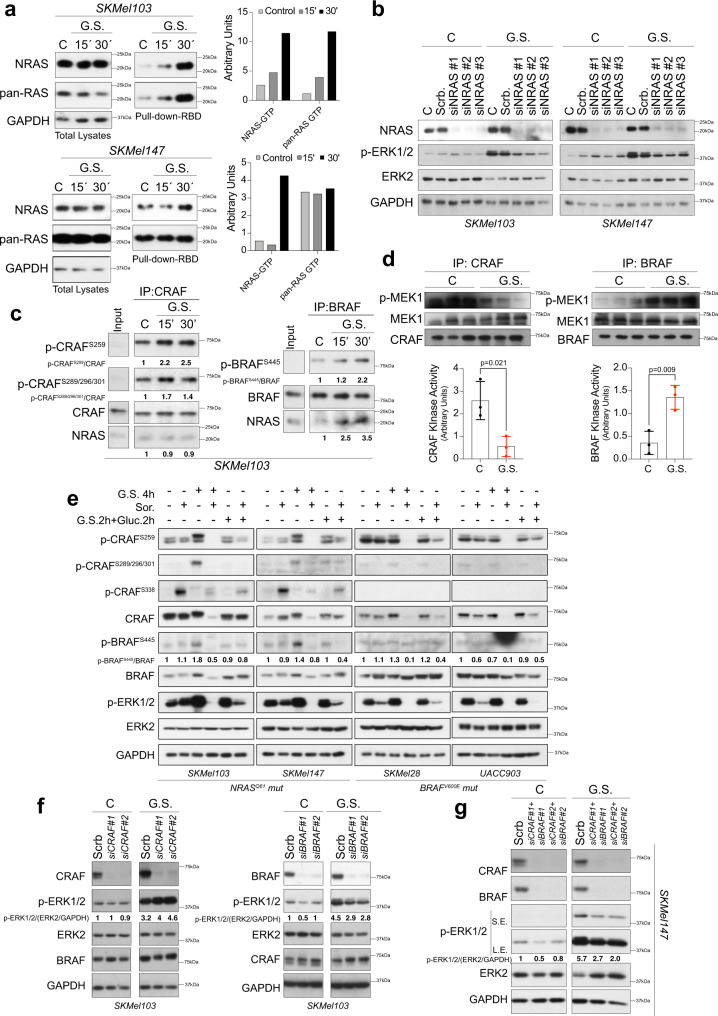
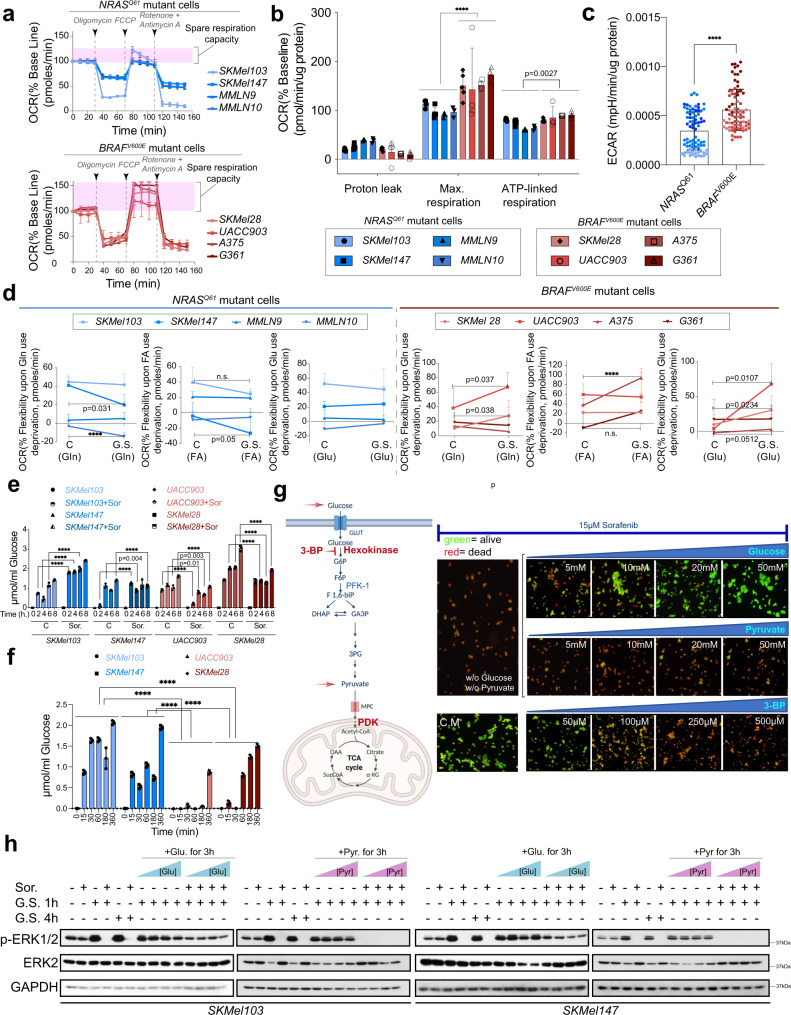
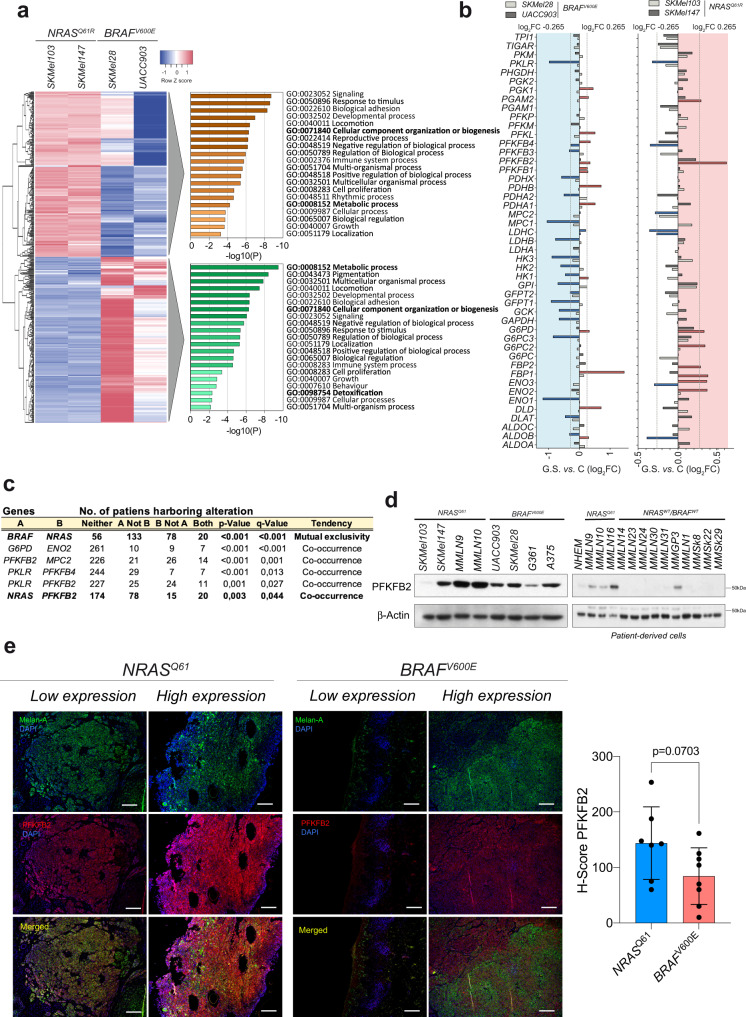
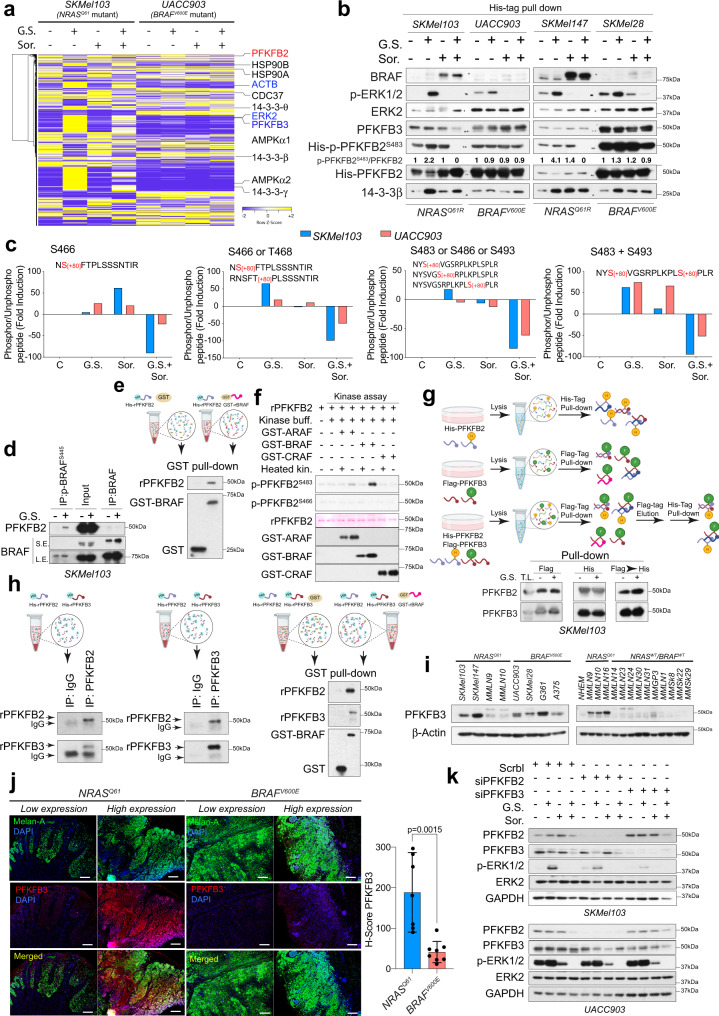
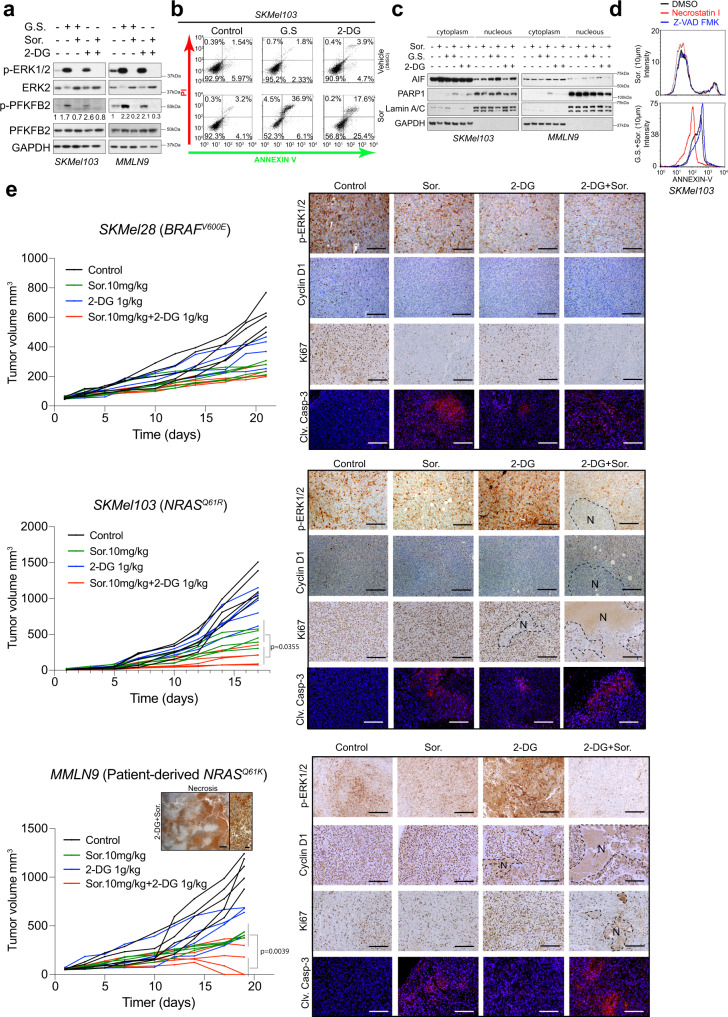
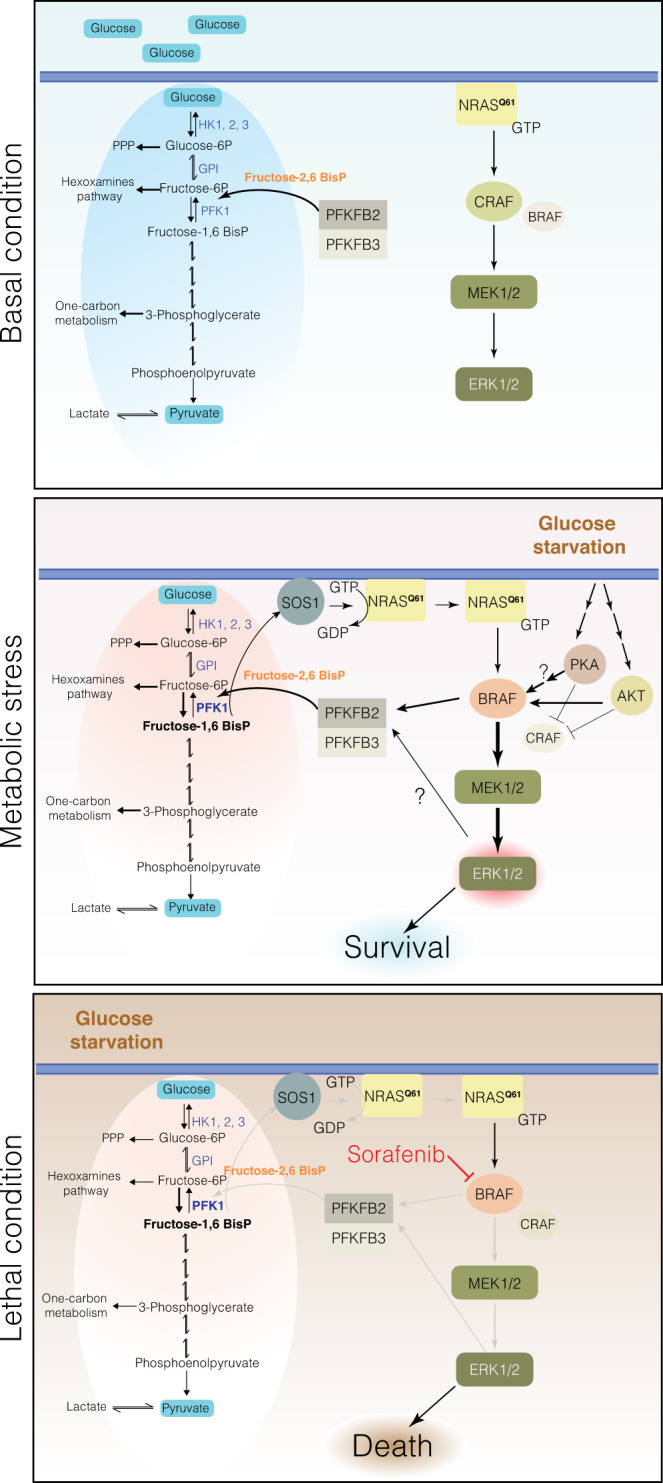
NRAS-mutated melanoma lacks a specific line of treatment. Metabolic reprogramming is considered a novel target to control cancer; however, NRAS-oncogene contribution to this cancer hallmark is mostly unknown. Here, we show that NRASQ61-mutated melanomas specific metabolic settings mediate cell sensitivity to sorafenib upon metabolic stress. Mechanistically, these cells are dependent on glucose metabolism, in which glucose deprivation promotes a switch from CRAF to BRAF signaling. This scenario contributes to cell survival and sustains glucose metabolism through BRAF-mediated phosphorylation of 6-phosphofructo-2-kinase/fructose-2,6-bisphosphatase-2/3 (PFKFB2/PFKFB3). In turn, this favors the allosteric activation of phosphofructokinase-1 (PFK1), generating a feedback loop that couples glycolytic flux and the RAS signaling pathway. An in vivo treatment of NRASQ61 mutant melanomas, including patient-derived xenografts, with 2-deoxy-D-glucose (2-DG) and sorafenib effectively inhibits tumor growth. Thus, we provide evidence for NRAS-oncogene contributions to metabolic rewiring and a proof-of-principle for the treatment of NRASQ61-mutated melanoma combining metabolic stress (glycolysis inhibitors) and previously approved drugs, such as sorafenib.


Conflict of interest statement

The authors declare no competing interests.

Figures

Fig. 1
Fig. 1. Glucose starvation (GS) induces ERK1/2 hyperactivation and sensitizes NRASQ61 mutant melanomas to sorafenib-mediated cell death.
a BRAFV600E and NRASQ61 mutant melanoma cells were subjected to GS for the indicated time points. Representative images of immunoblotting analysis using the indicated antibodies are shown. The graphs show the quantification of p-ERK1/2 (mean ± SD, n=3 biologically independent samples; ****p < 0.0001, unpaired two-sided t test). b Representative immunoblots showing the response of BRAFV600E and NRASQ61 mutant melanoma cells to GS for 4 h in the absence or presence of sorafenib. n = 3 biologically independent samples. c Heatmap representing the quantification of ERK1/2 inhibition induced by the indicated inhibitors under normal conditions and in response to 4 h of GS in NRASQ61 and BRAFV600E mutant melanoma cells (data source Supplementary Fig. 1d). d Cell death detection by flow cytometry analysis of BRAFV600E- and NRASQ61-mutant melanoma cells stained with propidium iodide (PI) and Annexin-V-GFP. Cells were treated for 4 h with sorafenib, vemurafenib, U0126, Axitinib and Avastin in the presence or absence of glucose (GS) (n = 2 biologically independent experiments). C Control, GS glucose starvation; Sor. Sorafenib, Ve. Vemurafenib, U U0126, Ax. Axitinib, Av. Avastin.
Fig. 2
Fig. 2. ERK1/2 activation upon metabolic stress is NRAS oncogene-dependent and promotes a switch to use BRAF instead of CRAF.
a Immunoblots showing the amount of activated RAS (RAS-GTP) after GS for 15 and 30 min in NRASQ61 mutant melanoma cells. The total lysates from the input samples used for the pull-downs with the CRAF binding domain (RBD) are shown. The graphs show the quantification of the indicated pulled down proteins. n = 2 independent biological experiments in 2 different cell lines. b Immunoblot showing the activation of ERK1/2 upon 4 h of GS in NRAS knockdown cells (NRASQ61 mutant melanoma cells). n = 2 independent biological experiments in 2 different cell lines. c Representative immunoblots (n = 3 independent biological experiments) showing the immunoprecipitated RAF protein isoforms from SKMel103 cells in a time-course manner upon GS The phosphorylation status of the indicated residues and the amount of NRAS present in the immunocomplexes are shown. The numbers indicate the fold change with respect to the control. d CRAF and BRAF kinase assays obtained from SKMel103 cells grown in normal conditions and upon 1 h GS The graphs show the quantification of the assay (mean ± SD, n = 3 independent biological experiments, unpaired two-sided t test). e Representative immunoblots showing the phosphorylation status of CRAF and BRAF in NRASQ61 and BRAFV600E mutant melanoma cells upon 4 h GS For recovery, the cells were starved for 2 h. Then, glucose was added for another 2 h. (n = 3 independent biological experiments). Numbers indicate fold induction. f Representative immunoblots showing ERK1/2 phosphorylation in response to GS in CRAF or BRAF knockdown SKMel103 cells (n = 2 independent biological experiments). The numbers indicate the fold change with respect to the control (scrb.). g Representative immunoblots showing ERK1/2 phosphorylation in response to GS in CRAF and BRAF knockdown SKMel147 cells (n = 2 independent biological experiments). The numbers indicate the fold change with respect to the control (scrb.). C Control, GS glucose starvation, Sor. Sorafenib, scrb scrambled siRNA.
Fig. 3
Fig. 3. BRAFV600E and NRASQ61 mutant melanoma cells show different metabolic profiles, in which glucose but not pyruvate or glutamine rescues sorafenib-induced cell death under metabolic stress conditions.
a Metabolic profiling of BRAFV600E and NRASQ61 mutant melanoma cells. Five different experiments per condition and per cell line were used to determine the oxygen consumption rate (OCR) (mean ± SD). Arrows in the graph indicate the time points where the drugs were added. b Indicated parameters associated with mitochondrial respiration (mean ± SD; n = 5 (SKMel103, SKMel147, SKMel28), n = 4 (UACC903, A375, G361), n = 3 (MMLN9, MMLN10) biologically independent samples; unpaired two-sided t test, ****p < 0.0001). c Extracellular acidification rate (ECAR). (mean ± SD; n = 5  biologically independent samples measured 4 times = 20 measurements per cell line (4 NRASQ61-mutated and 4 BRAFV600E-mutated); one-way ANOVA for max respiration; ****p < 0.0001, unpaired two-sided t test. d Metabolic flexibility of BRAFV600E and NRASQ61 mutant melanoma cells when subjected to GS and mitochondrial use deprivation of fatty acids (FA), glutamine (Gln) or glucose (Glu)) (source data Supplementary Fig. 2b; mean ± SD; n = 5 biologically independent samples; ****p < 0.0001, unpaired two-sided t test). e Graph showing glucose consumption of BRAFV600E and NRASQ61 mutant melanoma cells in the presence and absence of sorafenib (mean ± SD; n = 3 independent biological experiments; ****p < 0.0001, unpaired two-sided t test). f Graph showing glucose consumption of BRAFV600E and NRASQ61 mutant melanoma cells after 1 h of GS (mean ± SD; n = 3 independent biological experiments; ****p < 0.0001, unpaired two-sided t test). g Cell viability assay showing the effects of the addition of glucose or pyruvate under GS conditions or 3-bromopyruvate (3-BP) in complete medium (CM) in the presence of sorafenib in NRASQ61 mutant melanoma cells (n = 3 independent biological samples). A schematic cartoon of glycolysis and the involved molecules is shown on the left. h Representative immunoblot showing the effects on ERK1/2 activation and sorafenib sensitivity induced by the addition of glucose (Glu.) or pyruvate (Pyr.) for 3 h. after 1 h. of GS in NRASQ61 mutant melanoma cells. The colored triangles (blue and purple) represent increasing concentrations of the indicated compounds (5 mM, 10 mM, 20 mM and 50 mM) (n = 4 independent biological experiments). C Control, GS glucose starvation, Sor. Sorafenib.
Fig. 4
Fig. 4. NRASQ61 mutant melanoma cells remodel glucose into macromolecules and exhibit a higher glycolytic flux than that of the BRAFV600E mutant cells resistant to sorafenib treatment.
a Scheme showing the labeling of cells with [U-13C6 glucose and the posterior identification of the possible intermediate isotopologues by mass spectrometry. b Glycolytic pathway and tricarboxylic acid cycle (TCA) diagram showing the distribution of the labeled carbons from [U-13C6] glucose into the possible intermediate isotopologues. c Graph showing the amount of the indicated glycolytic intermediate M + 3 isotopologs in BRAFV600E- and NRASQ61-mutant melanoma cells under normal growth conditions. Bars represent the mean ± SD (n = 4 biologically independent samples; unpaired two-sided t test, ns = not significant). d Graph showing the amount of the indicated M + 3 isotopologues glycolytic intermediates in sorafenib-treated and nontreated BRAFV600E and NRASQ61 mutant melanoma cells. Bars represent the mean ± SD (n = 4 biologically independent samples; unpaired two-sided t test). e Graphs showing the relative intensity of the indicated molecules under basal conditions and after 1 h of GS in BRAFV600E- and NRASQ61-mutant melanoma cells. Bars represent the mean ± SD (n = 4 biologically independent samples; unpaired two-sided t test, ns not significant). C Control; GS glucose starvation; Sor. Sorafenib.
Fig. 5
Fig. 5. PFKFB2 upregulation preferentially co-occurs with NRASQ61-mutated melanomas.
a Heatmap showing the unbiased hierarchical clustering of the top 400 genes differentially expressed (log2FC > 0.265) under basal conditions in BRAFV600E- and NRASQ61-mutant melanoma cells. On the right, the graphs show the enriched terms across the input gene lists, colored by p-value (hypergeometric test; https://metascape.org/). n = 3 independent biological experiments per cell line. b Graph showing the log2FC variations of glucose metabolism-related genes when subjected to GS for 1 h. in BRAFV600E- and NRASQ61- mutant melanoma cells. The red bars indicate upregulated genes (log2FC > 0.265), the blue bars indicate downregulated genes (log2FC < −0.265). c Table showing the tendency of regulated genes in (b) (log2FC > 0.265) to either co-occur or be mutually exclusive. Data obtained from TCGA database (Firehorse Legacy study, 287 human samples; for p value Fisher exact test, for the q-value it’s a Benjamini–Hochberg FDR correction procedure, http://www.cbioportal.org). d Immunoblot showing the amount of PFKFB2 expressed in melanoma cell lines, including patient-derived cells (n = 2 independent biological experiments). e Immunofluorescence showing the expression of PFKFB2 in human melanoma samples. Bars represent 400 µm. (n = 7 NRASQ61-mutated and n = 8 BRAFV600E-mutated). The graph shows the H-score of the evaluated samples (mean ± SD; p value, unpaired two-sided t test). C Control; GS glucose starvation.
Fig. 6
Fig. 6. Metabolic stress promotes the regulation and sensitization of glycolytic enzymes to sorafenib, leading to RAS-ERK1/2 pathway activation.
a Representative immunoblot showing the time-dependent regulation of PFKFB2 phosphorylation (S483) upon GS in NRASQ61- and BRAFV600E-mutant melanoma cells (n = 3 independent biological experiments). b Representative immunoblot showing the sensitization of PFKFB2 phosphorylation to sorafenib and not trametinib upon 4 h GS in BRAFV600E- and NRASQ61- mutant melanoma cells (n = 3 biologically independent samples). c Representative immunoblot showing PFKFB2 phosphorylation regulation (S483) over time in response to GS and sorafenib treatment in NRASQ61- and BRAFV600E-mutant melanoma cells (n = 2 biologically independent samples). d Representative immunoblot showing PFKFB2 phosphorylation regulation (S483) in response to GS and RAS/ERK1/2 pathway inhibition conditions (Ras inhibitor: Salirasib; RAF inhibitors: sorafenib, regorafenib, and CCT196969; MEK inhibitors: trametinib and U0126) in NRASQ61 and BRAFV600E mutant melanoma cells (n = 3 biologically independent experiments). Numbers show the fold induction of the indicated ratio. e Representative immunoblots showing PFKFB2 phosphorylation regulation (S483) in response to 4 h. GS in NRAS, CRAF, BRAF and MEK1/2 SKMel103 knockdown cells (n = 3 biologically independent experiments). Numbers show the fold induction of the indicated ratio. f PFK1 enzymatic activity assay in BRAFV600E- and NRASQ61- mutant melanoma cells after GS for 15 and 30 min (mean ± SD, n=5 biologically independent samples; unpaired two-sided t test, ****p < 0.0001). g Immunofluorescence of PFK1 (PFKM) and F-actin (Alexa Fluor-488-phalloidin) in BRAFV600E- and NRASQ61- mutant melanoma cells under 1 h GS Bars represent 500 µm (yellow) and 25 µm and 5 µm (white). h Immunoblot showing the activation of the RAS-ERK1/2 pathway in SKMel103 cells by the addition of fructose 1,6 bisphosphate (F1,6BisP) to complete medium (CM), under low glucose conditions (5 mM) and GS (n = 3 biologically independent samples). The numbers indicate the fold change with respect to the control. i Immunoblot showing the activation of the RAS-ERK1/2 pathway by the addition of fructose 1,6 bisphosphate (F1,6BisP) under GS in SOS1/2 knockdown NRASQ61-mutant melanoma cells (n = 3 biologically independent samples). The numbers indicate the fold change with respect to the control. C Control, GS glucose starvation, Sor. Sorafenib, Tra. Trametinib, Sal. Salirasib, Reg. Regorafenib, CCT. CCt196969, S.E. short exposure, L.E. long exposure.
Fig. 7
Fig. 7. Protein interaction network analysis links PFKFB2/3 to the RAS-ERK1/2 pathway.
a Spectral counts) of the identified proteins in the PFKFB2 protein complexes upon the indicated treatments in NRASQ61- and BRAFV600E-mutant melanoma cells (n = 3 biologically independent experiments). Proteins already described to interact with PFKFB2 (black); new proteins described in this work (blue). b Representative immunoblot showing the amounts of the indicated proteins after isolation of His-tagged PFKFB2 complexes in NRASQ61 and BRAFV600E mutant melanoma cells. Numbers show the fold induction of the indicated ratio (n = 3 biologically independent experiments). c Graphs showing the fold change differences with respect to the control (spectral peak areas) of the indicated phosphorylated/unphosphorylated ratio peptides in NRASQ61 and BRAFV600E mutant melanoma cells upon the indicated treatments. Each condition represents three biologically independent experiments (n = 3) that were pooled before the mass spectrometry analysis. d Immunoblot showing the binding of PFKFB2 to BRAF and p-BRAFS445 in NRASQ61 mutant melanoma cells under 1 h GS; n = 3 independent experiments per treatment). e Representative in vitro interaction assay of GST-BRAF and recombinant PFKFB2 (rPFKFB2). Immunoblots show the amounts of the identified proteins after GST pull-down (n = 3 independent samples). GST protein was used as a control. f Representative in vitro kinase assay (n = 3 independent samples) using rPFKFB2, GST-ARAF, GST-BRAF, and GST-CRAF. Ponceau S staining shows rPFKFB2. g Immunoblot showing the amount of the identified proteins after isolation of the protein complexes as indicated in the scheme. Total lysate 5% (T.L.), 4 h GS, and pull-down (P.D.) (n = 2 independent biological experiments). h Representative in vitro interaction assay of rPFKFB2, rPFKFB3 and GST-BRAF. The immunoblots show the amount of the identified proteins after the PFKFB2/PFKFB3 immunoprecipitation or GST pull-down (n = 3). Isotype IgG and GST were used as controls. i Immunoblot showing the amount of PFKFB3 expressed in melanoma cell lines, including patient-derived cell lines. (n = 2 independent biological experiments). j Immunofluorescence showing the expression of PFKFB3 in human melanoma samples. Bars represent 400 µm. (n = 7 NRASQ61-mutated and n = 8 BRAFV600E-mutated). The graph shows the H-score of the evaluated samples (mean ± SD; p value, unpaired two-sided t test). k Immunoblot showing the activation of ERK1/2 upon 4 h GS and/or sorafenib treatment in PFKFB2 or PFKFB3 knockdown NRASQ61 and BRAFV600E mutant melanoma cells (n = 2 biologically independent experiments). C Control, GS glucose starvation; Sor. Sorafenib; Scrbl. scrambled siRNA.
Fig. 8
Fig. 8. The combination of 2-DG and sorafenib is effective against NRASQ61-mutated melanomas.
a Immunoblot showing the effects of 2-DG on RAS pathway activation and PFKFB2 phosphorylation compared to GS in NRASQ61 mutant melanoma cells. Numbers show the fold induction of the indicated ratio (n = 3 independent biological experiments). b Cell death detection by flow cytometry analysis in NRASQ61 mutant melanoma cells stained with propidium iodide (PI) and Annexin-V-GFP. The cells were treated for 4 h with sorafenib in the presence or absence of glucose (GS) and upon the addition of 2-DG (30 mM) and 10 mM glucose. A representative experiment is shown (n = 3 independent biological experiments). c Western blot showing the expression and localization of the indicated cell death-related proteins in NRASQ61-mutated cell lines after GS in the presence of sorafenib and/or 2-deoxy-glucose (2-DG). Lamin A/C and GAPDH are shown as loading and subcellular localization markers (n = 3). d Histograms showing cell death detection by flow cytometry analysis in NRASQ61 mutant melanoma cells stained with Annexin-V-GFP after the indicated treatments: Pan-caspase inhibitor zVAD-FMK and necrostatin 1 (n = 2 biologically independent experiments). e In vivo tumor growth assays showing the effect of the combination of sorafenib and 2-DG in NRASQ61- and BRAFV600E-mutant melanoma cells. n = 5 mice per group of treatment in three different cells lines, including patient-derived cells (MMLN9); p value, one-way ANOVA. Representative immunohistochemistry and immunofluorescence images against the indicated antibodies are shown. Bars represent 400 µm and 100 µm for the magnification of the graph inset. GS glucose starvation, Sor. Sorafenib, N necrosis.
Fig. 9
Fig. 9. Schematic representation of the proposed mechanism: under basal conditions, NRASQ61 mutant melanoma cells are dependent on glucose metabolism and preferentially use CRAF to signal through ERK1/2.
Schematic representation of the proposed mechanism: Under basal conditions, NRASQ61 mutant melanoma cells are dependent on glucose metabolism and preferentially use CRAF to signal through ERK1/2. Upon GS PKA and AKT are activated, promoting concomitant CRAF inactivation and BRAF activation and generating a feedback loop to sustain glycolysis. This involves the activation of the kinase activity of PFKFB2/3 that results in the production of fructose-2,6BisP, which in turn allosterically activates PFK1, inducing the generation of fructose-1,6BisP. This metabolite, under metabolic stress, activates SOS1, promoting the activation of NRASQ61 by exchanging GDP for GTP, leading again to the activation of BRAF and resulting in cell survival. Treating cells under this condition with sorafenib abolishes BRAF downstream signals, leading to cell death.

Similar articles

Cited by

References

    1. Krauthammer M, et al. Exome sequencing identifies recurrent mutations in NF1 and RASopathy genes in sun-exposed melanomas. Nat. Genet. 2015;47:996–1002. doi: 10.1038/ng.3361. - DOI - PMC - PubMed
    1. Pollock PM, et al. High frequency of BRAF mutations in nevi. Nat. Genet. 2003;33:19–20. doi: 10.1038/ng1054. - DOI - PubMed
    1. Fedorenko IV, Gibney GT, Smalley KS. NRAS mutant melanoma: biological behavior and future strategies for therapeutic management. Oncogene. 2013;32:3009–3018. doi: 10.1038/onc.2012.453. - DOI - PMC - PubMed
    1. Dumaz N, et al. In melanoma, RAS mutations are accompanied by switching signaling from BRAF to CRAF and disrupted cyclic AMP signaling. Cancer Res. 2006;66:9483–9491. doi: 10.1158/0008-5472.CAN-05-4227. - DOI - PubMed
    1. Tsao H, Goel V, Wu H, Yang G, Haluska FG. Genetic interaction between NRAS and BRAF mutations and PTEN/MMAC1 inactivation in melanoma. J. Investig. Dermatol. 2004;122:337–341. doi: 10.1046/j.0022-202X.2004.22243.x. - DOI - PMC - PubMed

Publication types