. 2022 Nov 19;13(1):7108.
doi: 10.1038/s41467-022-34831-3.

Pharmacological inhibition of HDAC6 improves muscle phenotypes in dystrophin-deficient mice by downregulating TGF-β via Smad3 acetylation

Affiliations

Pharmacological inhibition of HDAC6 improves muscle phenotypes in dystrophin-deficient mice by downregulating TGF-β via Smad3 acetylation

Alexis Osseni et al. Nat Commun. .

Abstract

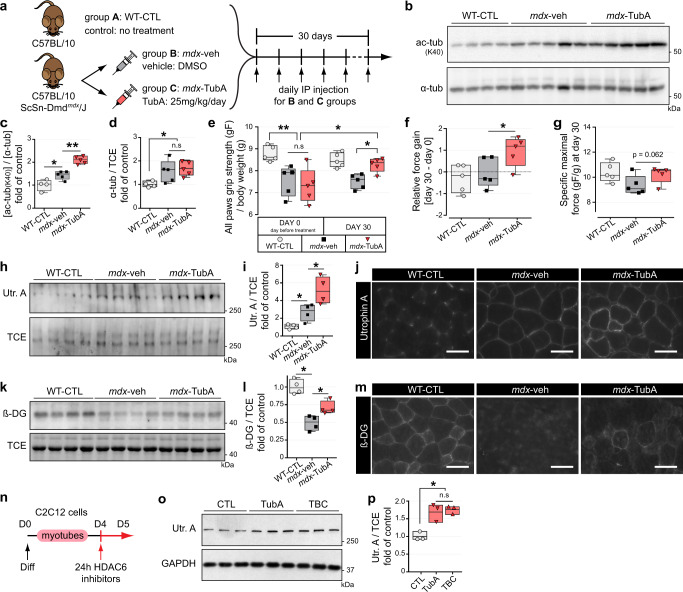
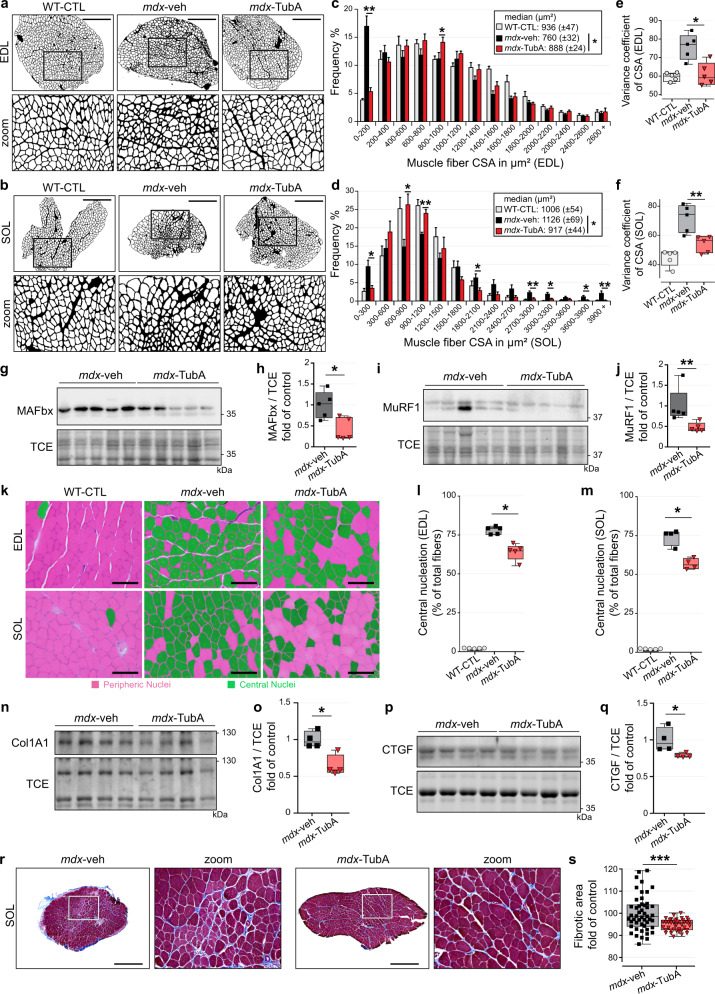
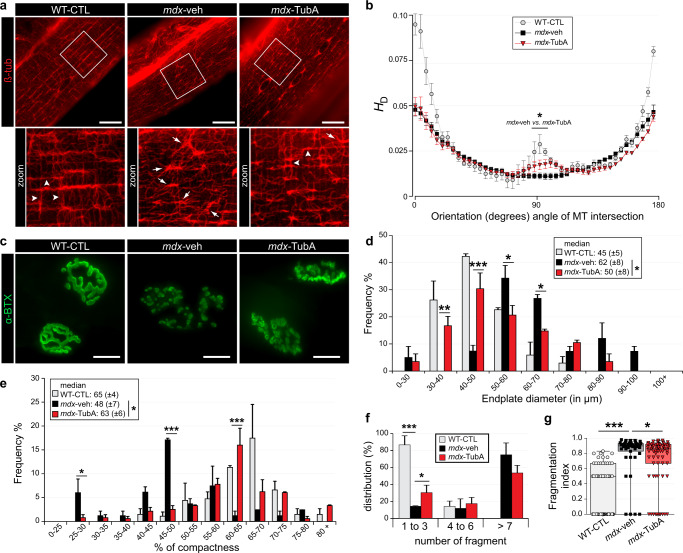
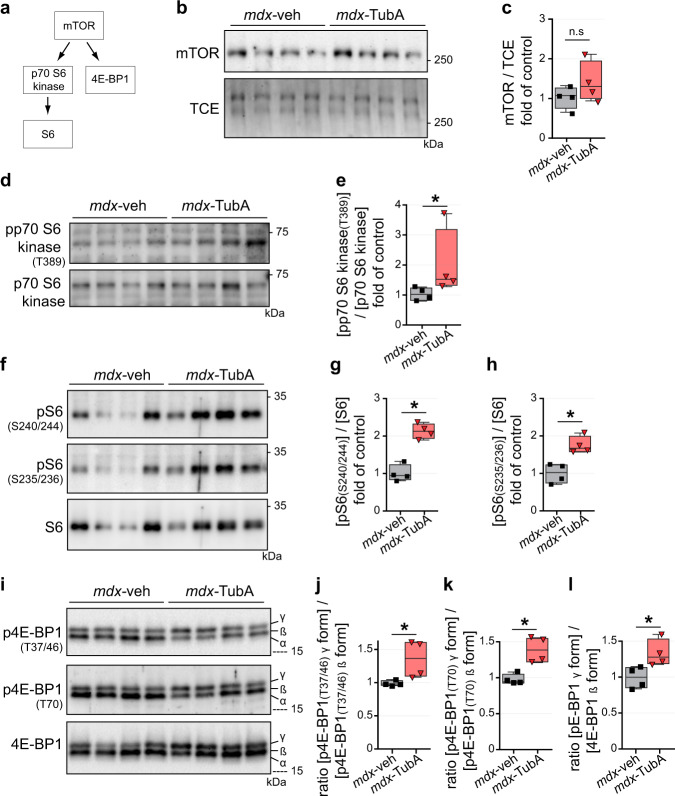
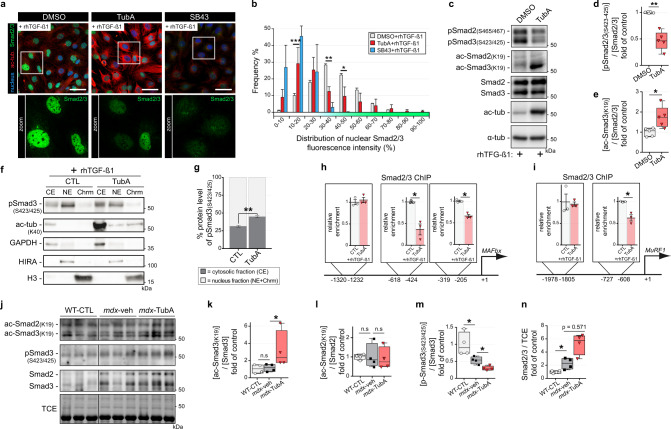
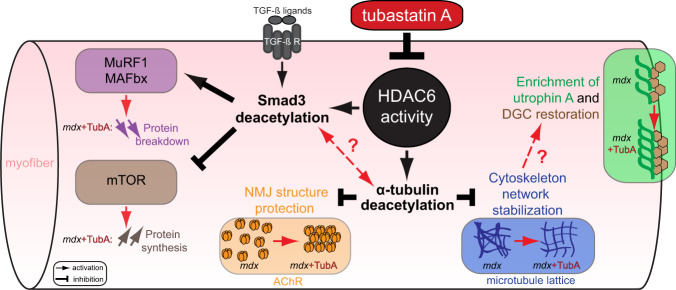
The absence of dystrophin in Duchenne muscular dystrophy disrupts the dystrophin-associated glycoprotein complex resulting in skeletal muscle fiber fragility and atrophy, associated with fibrosis as well as microtubule and neuromuscular junction disorganization. The specific, non-conventional cytoplasmic histone deacetylase 6 (HDAC6) was recently shown to regulate acetylcholine receptor distribution and muscle atrophy. Here, we report that administration of the HDAC6 selective inhibitor tubastatin A to the Duchenne muscular dystrophy, mdx mouse model increases muscle strength, improves microtubule, neuromuscular junction, and dystrophin-associated glycoprotein complex organization, and reduces muscle atrophy and fibrosis. Interestingly, we found that the beneficial effects of HDAC6 inhibition involve the downregulation of transforming growth factor beta signaling. By increasing Smad3 acetylation in the cytoplasm, HDAC6 inhibition reduces Smad2/3 phosphorylation, nuclear translocation, and transcriptional activity. These findings provide in vivo evidence that Smad3 is a new target of HDAC6 and implicate HDAC6 as a potential therapeutic target in Duchenne muscular dystrophy.


Conflict of interest statement

The authors declare no competing interests.

Figures

Fig. 1
Fig. 1. HDAC6 inhibition via TubA treatment increases grip strength, sarcolemmal localization of utrophin A and promotes reassembly of the DGC in mdx mice.
a Protocol of TubA treatment. Three groups of 7-wk-old mice have been evaluated for 4 weeks either without treatment (group A, C57BL/10 mice: WT-CTL), or treated with daily injection for 30 consecutive days with DMSO (group B, C57BL/10ScSn-Dmdmdx/J mice; mdx-veh) or with TubA at 25 mg/kg/day (group C, C57BL/10ScSn-Dmdmdx/J mice; mdx-TubA). b To evaluate the level of tubulin acetylation (ac-tubK40) in TA muscles, Western blot analysis were performed. Quantifications of acetylated α-tubulin (c) and α-tubulin (α-tub, d) protein levels (n = 4–5 mice per group) were respectively normalized to α-tubulin and 2,2,2-Trichloroethanol (TCE). e Grip strength was measured on a grid measuring maximal hindlimb grip strength normalized on body weight (n = 5 mice per group). f Relative force gain was calculated by the difference between grip strength measured at the last day (day 30) and the day before starting treatment (day 0) and measured with a paired t-test (n = 5 mice per group). g Specific maximal force was evaluated by the best score of grip strength obtain in each animals at day 30 (n = 5 mice per group). To evaluate levels of utrophin A (Utr. A) and β-dystroglycan (β-DG) in TA muscles, Western blot analysis (h, k) and quantification (i, l) were performed (n = 4 mice per group). TCE was used as a loading control. Cross sections of EDL muscle were stained with an antibody against utrophin A (j, in gray) or against β-dystroglycan (m, in gray). Scale bars: 50 μm. n 4-d-old C2C12 myotubes pretreated for 24 h with different HDAC6 inhibitors TubA (5 μM) and tubacin (TBC, 5 μM) or with DMSO (CTL). o Representative Western blots showing utrophin A. GAPDH was used as a loading control. p Quantification of Utrophin A protein levels normalized with GAPDH (n = 3 independent experiments quantified). (c, d, e, f, g, i, l, p) Whiskers min to max; the line in the middle of the box is plotted at the median. *P < 0.05; **P < 0.01; n.s, not significant, P > 0.05; Mann–Whitney U test. kDa, relative molecular weight in kiloDalton.
Fig. 2
Fig. 2. TubA treatment improves and restores DMD phenotype in mdx muscle and protects from atrophy.
Cross-section areas (CSA) of entire EDL (a) and SOL (b) muscles from 11-wk-old C57BL/10 mice (WT-CTL) and C57BL/10ScSn-Dmdmdx/J mice treated with vehicle-DMSO (mdx-veh) or with TubA (mdx-TubA) for 30 consecutive days were stained using laminin staining and then binarized on ImageJ (n = 5 mice per group). Scale bars: 500 μm. Graphical summary of CSA in EDL (c) and SOL (d) muscle (n = 5 mice per group; entire EDL and SOL muscles were counted per mouse). c, d Data are presented as mean values ± SEM. *P < 0.05; **P < 0.01; two-way ANOVA (mdx-TubA versus mdx-veh). Median CSAs of each muscle are displayed above the frequency histograms. Measurements of variance coefficient in EDL (e) and SOL (f) muscle fibers (n = 5 mice per group). To evaluate levels of MAFbx (g, h) and MuRF1 (i, j) in TA muscles, Western blot analysis (g, i) and quantifications (h, j) were performed (n = 5 mice per group). k Representative examples of cross-sections of EDL and SOL muscles were stained using hematoxylin and eosin. Scale bars: 100 µm. Centrally nucleated fibers are colored in green. Percentage of central nucleation in EDL (l) and SOL (m) muscle fibers (n = 4 or 5 mice per group). To evaluate levels of collagen type I alpha 1 (n, o, Col1A1) and connective tissue growth factor (p, q, CTGF) in TA muscles, Western blot analysis (n, p) and quantifications (o, q) were performed (n=4 mice per group). TCE was used as a loading control for all Western blots. To evaluate level of collagen content infiltration, Masson’s trichrome staining (r) and quantification (s) were performed in SOL muscle. Scale bars: 500 µm. Fibrotic area are colored in blue (n = 28–50 fields counted per mouse, 3 mice per group). (e, f, h, j, l, m, o, q, s) Whiskers min to max; the line in the middle of the box is plotted at the median. *P < 0.05; **P < 0.01; ***P < 0.001; n.s, not significant, P > 0.05; Mann–Whitney U test. kDa, relative molecular weight in kiloDalton.
Fig. 3
Fig. 3. TubA treatment stabilizes MT network and protects NMJ morphological characteristics from dystrophic mice.
a, c Isolated fibers of TA from 11-wk-old C57BL/10 mice (WT-CTL) and C57BL/10ScSn-Dmdmdx/J mice treated with vehicle-DMSO (mdx-veh) or with TubA (mdx-TubA) for 30 consecutive days were stained with an antibody against β-tubulin (ß-tub) to label MT network (a, in red) or stained with α-bungarotoxin-A488 (c, in green, α-BTX–A488) to label NMJs. Scale bars: 25 μm. b MT network organization analysis using TeDT software (n = 4 to 6 fibers from 3 mice). The final generated graph presents a global score for each given degree of MT orientation, with 0 and 180 degrees corresponding to the longitudinal MT and 90 degrees corresponding to the transverse MT; directional histograms (HD). Arrowheads represent regular organization of MT network whereas arrows show disorganization of the MT network, with a loss of the grid-like organization. Graphical summary of NMJ endplate diameter (d) and NMJ compactness (e) were performed. d, e, *, ** and *** comparison between mdx-veh vs. mdx-TubA mice. Median of each group of mice are displayed above the frequency histograms (n = 40–75 NMJs counted). Distribution of number of fragments (f) and fragmentation index (g) have been quantified (n = 43-73 of NMJs counted). g Whiskers min to max; the line in the middle of the box is plotted at the median. *P < 0.05; **P < 0.01; ***P < 0.001; (mdx-TubA versus mdx-veh), Mann–Whitney U test.
Fig. 4
Fig. 4. HDAC6 inhibition actives mTOR pathway in mdx mice.
a Schematic summary of downstream targets of mTOR. 11-wk-old C57BL/10ScSn-Dmdmdx/J mice treated with TubA (mdx-TubA) or with vehicle-DMSO (mdx-veh) for 30 consecutive days have been analyzed in TA muscle by Western blot analysis (b, d, f, i). Quantifications of mTOR (c), pp70 S6 kinase (e, T389), pS6 (g, S240/244), pS6 (h, S235/236), p4E-BP1 (j, T37/46), p4E-BP1 (k, T70), and 4E-BP1 (l) were performed (n = 4 mice per group). TCE was used as a loading control. (c, e, g, h, j, k, l) Whiskers min to max; the line in the middle of the box is plotted at the median. *P < 0.05; n.s, not significant, P > 0.05; Mann–Whitney U test. kDa, relative molecular weight in kiloDalton.
Fig. 5
Fig. 5. TGF-β signaling is regulated by TubA via acetylation of Smad3.
a–e 4-d-old C2C12 myoblasts pretreated for 24 h with either HDAC6 inhibitor (TubA, 5 μM), or selective inhibitor of TGF-β1 (SB43, 5 μM) or with DMSO (CTL). Myoblasts were then treated for 30 min with recombinant human TGF-β1 (rhTGF-β1; 10 ng/mL). a Myoblasts were double-stained with antibodies against Smad2/3 (in green) and acetylated tubulin (ac-tub, in red). Nuclei were labeled with DAPI (in blue). Scale bars: 50 µm. b Graphical summary of nuclear distribution of Smad2/3 fluorescence intensity from 3 independent experiments; two-way ANOVA (TubA+rhTGF-β1 versus DMSO + rhTGF-β1). c Levels of Smad2/3 phosphorylation (pSmad), Smad2/3 acetylation (ac-Smad), Smad2/3, acetylated α- tubulin (ac-tub), and α-tubulin (α-tub) were visualized by Western blot analysis. To evaluate levels of Smad2/3 phosphorylations (d) and Smad3 acetylation (e) in C2C12 cells quantifications have been performed (n = 5 independent experiments quantified); Mann–Whitney U test. f, g Cellular fractionation into 3 fractions was performed: cytosolic fraction (CE), nuclear extract (NE), and chromatin extract (Chrm). f Levels of Smad3 phosphorylation (S423-425), Smad2/3, acetylated α-tubulin (ac-tub-K40), GAPDH, HIRA and histone H3 (H3) were visualized by Western blot from 3 independent experiments. g Quantifications of distribution of Smad3 phosphorylation (S423-425); two-way ANOVA. Chromatin immunoprecipitations (ChIP) was performed using antibodies against Smad2/3. qPCR ampifications of immunoprecipitated promoter regions of the MAFbx (h) or MuRF1 (i) gene were used to detect the presence of these DNA fragments in immunoprecipitates (h, i, n = 3 independent experiments); Mann–Whitney U test. *, P < 0.05. (j, k, l, m, n) 11-wk-old C57BL/10ScSn-Dmdmdx/J mice treated with vehicle-DMSO (mdx-veh) or with TubA (mdx-TubA) for 30 consecutive days have been analyzed in TA muscle by Western blot analysis (j) and quantified (k, l, m, n). To evaluate levels of Smad3 acetylation (k), Smad2 acetylation (l), Smad3 phosphorylation (m) and Smad2/3 (n) in TA muscles, quantifications have been performed (n = 4 mice per group); Mann–Whitney U test. TCE was used as a loading control for all Western blots. (d, e, k, l, m, n) Whiskers min to max; the line in the middle of the box is plotted at the median. (b, g, h, i) Data are presented as mean values ± SEM. *P < 0.05; **P < 0.01; ***P < 0.001; n.s, not significant, P > 0.05. kDa, relative molecular weight in kiloDalton.
Fig. 6
Fig. 6. Consequences of HDAC6 activity inhibition regulation through TubA treatment in DMD mice model.
HDAC6 inhibitor such as TubA induces a decrease in HDAC6 activity that leads to an acetylation of α-tubulin and of Smad3. HDAC6 pharmacological inhibition allows an increase of α-tubulin acetylation to restore DGC and stabilize MT network/NMJ organization. Additionally, specific inhibition of HDAC6 increases acetylation of Smad3 which can interfere with TGF-β signaling to both reduce muscle atrophy by reducing the expression of key actors such as MAFbx/MuRF1 and to stimulate protein synthesis via mTOR pathway. Our results identify HDAC6 as a pharmacological target of interest for DMD.

References

    1. Mendell JR, et al. Eteplirsen for the treatment of Duchenne muscular dystrophy. Ann. Neurol. 2013;74:637–647. doi: 10.1002/ana.23982. - DOI - PubMed
    1. Moat SJ, Bradley DM, Salmon R, Clarke A, Hartley L. Newborn bloodspot screening for Duchenne muscular dystrophy: 21 years experience in Wales (UK) Eur. J. Hum. Genet. 2013;21:1049–1053. doi: 10.1038/ejhg.2012.301. - DOI - PMC - PubMed
    1. Straub V, et al. Stakeholder cooperation to overcome challenges in orphan medicine development: the example of Duchenne muscular dystrophy. Lancet Neurol. 2016;15:882–890. doi: 10.1016/S1474-4422(16)30035-7. - DOI - PubMed
    1. Ricotti V, et al. The NorthStar Ambulatory Assessment in Duchenne muscular dystrophy: considerations for the design of clinical trials. J. Neurol. Neurosurg. Psychiatry. 2016;87:149–155. - PMC - PubMed
    1. Emery AEH. The muscular dystrophies. Lancet. 2002;359:687–695. doi: 10.1016/S0140-6736(02)07815-7. - DOI - PubMed

Publication types

MeSH terms

LinkOut - more resources