. 2022 Nov 19;12(1):19906.
doi: 10.1038/s41598-022-23775-9.

Network location and clustering of genetic mutations determine chronicity in a stylized model of genetic diseases

Affiliations

Network location and clustering of genetic mutations determine chronicity in a stylized model of genetic diseases

Piotr Nyczka et al. Sci Rep. .

Abstract

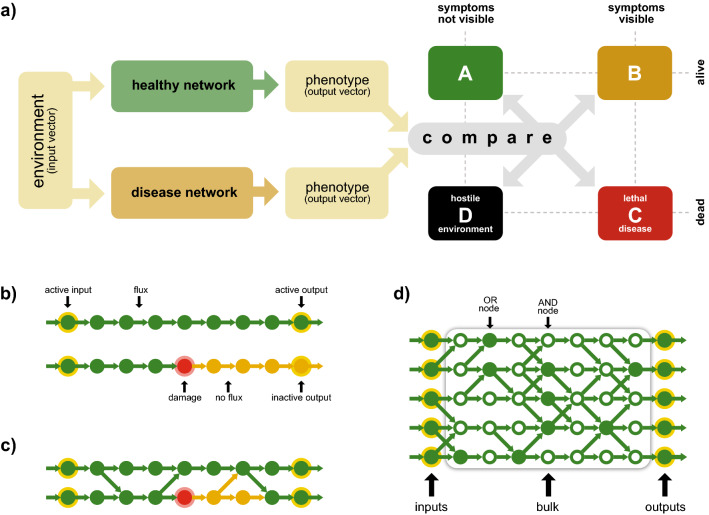
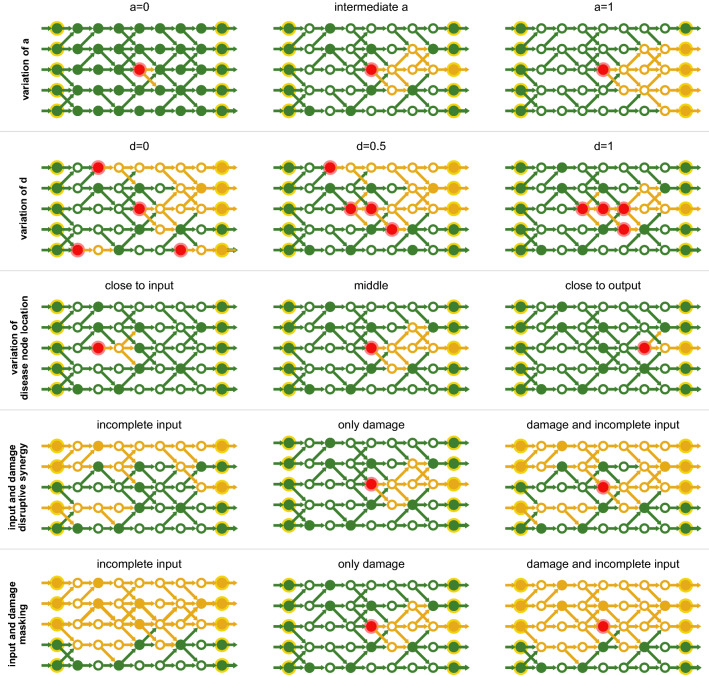
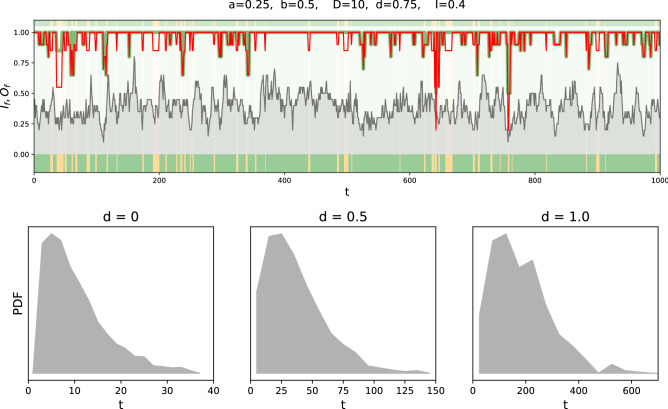
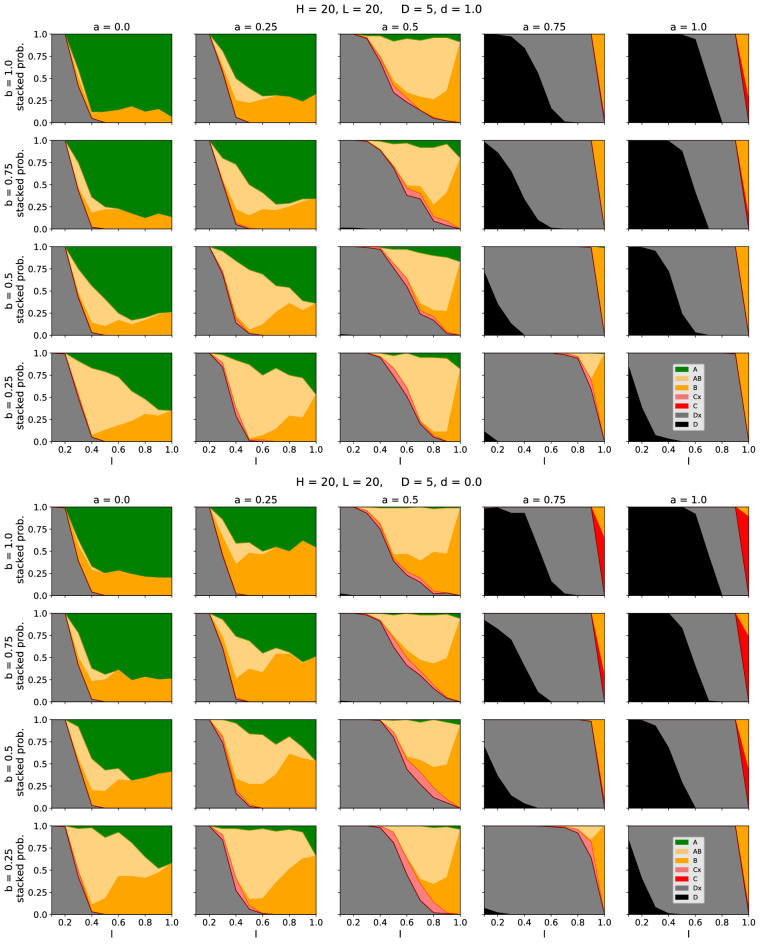
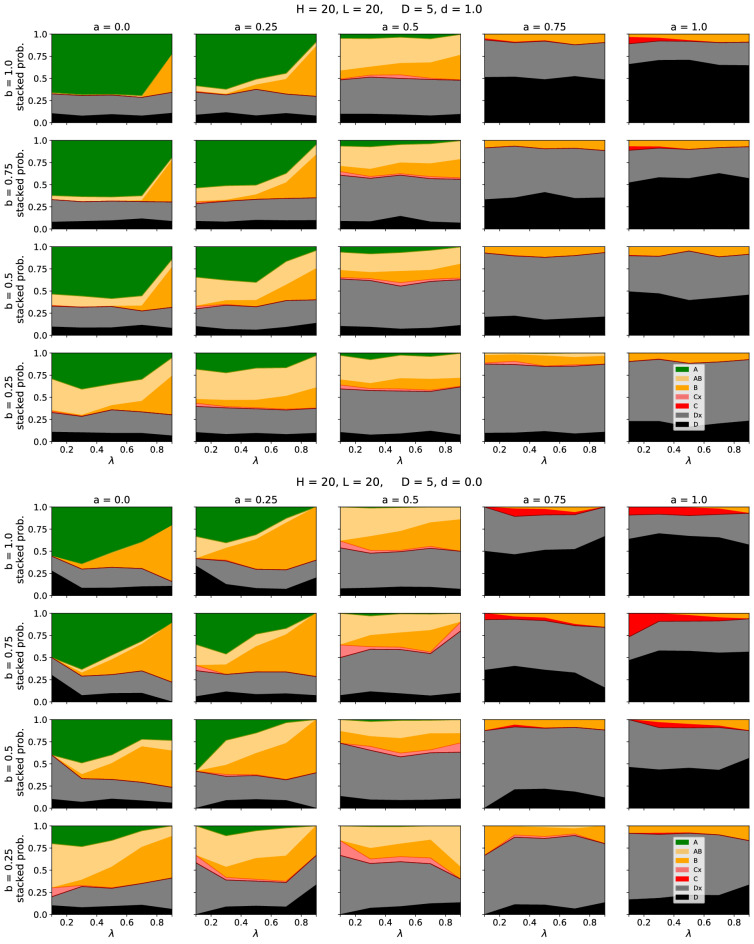
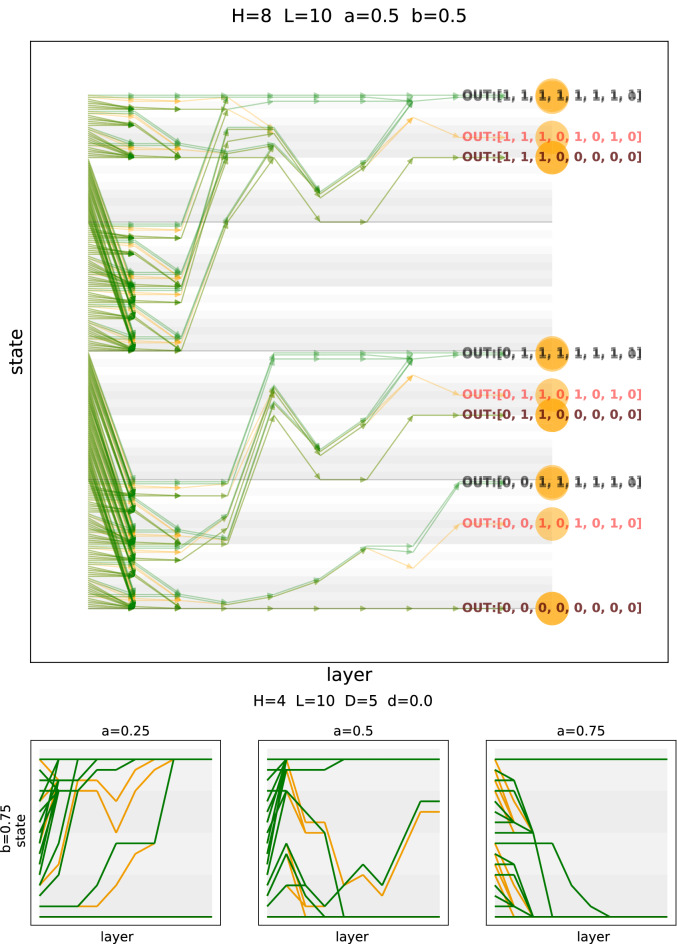
In a highly simplified view, a disease can be seen as the phenotype emerging from the interplay of genetic predisposition and fluctuating environmental stimuli. We formalize this situation in a minimal model, where a network (representing cellular regulation) serves as an interface between an input layer (representing environment) and an output layer (representing functional phenotype). Genetic predisposition for a disease is represented as a loss of function of some network nodes. Reduced, but non-zero, output indicates disease. The simplicity of this genetic disease model and its deep relationship to percolation theory allows us to understand the interplay between disease, network topology and the location and clusters of affected network nodes. We find that our model generates two different characteristics of diseases, which can be interpreted as chronic and acute diseases. In its stylized form, our model provides a new view on the relationship between genetic mutations and the type and severity of a disease.


Conflict of interest statement

The authors declare no competing interests.

Figures

Figure 1
Figure 1
(a) Flow chart of our investigation: The outputs of a healthy and a defect (disease) network (receiving the same input vector) are compared. Depending on their difference they are assigned to a specific class: Class A, if both outputs are equal (no disease), class B, if the disease network has a lower but non-zero output (symptomatic disease), class C, if the disease network has zero output, while the healthy network has a non-zero output (lethal disease), class D, if both the healthy and the disease network have zero output. (b) Definition of node states and visual representation of the effect of a non-functional node. (c) Illustration of branching and visual representation of compensating a defect via interacting pathways. (d) Schematic representation of the full model and illustration of the layer structure.
Figure 2
Figure 2
Schematic summaries of various aspects of the model. Red indicates non-functional nodes (i.e. the genetic predisposition for a disease, ‘disease nodes’). Green nodes and links indicate activity (‘flux’). Inactive components are indicated in yellow. All rows (except for the first one) use the same (intermediate) value of a. The first row shows how a affects the impact of non-functional nodes. The second row illustrates the effect of different clustering d for the same number of non-functional nodes D. The third row shows how the position of the non-functional nodes can affect the phenotype. The fourth row is an example of synergistic effects between network and environment. The fifth row shows an example of a genetic disease being masked by environmental factors.
Figure 3
Figure 3
Top panel: time series of the number of active inputs (grey background) and the output strength for the healthy (green) and the disease (red) network. A difference between the red and the green curve (red below green) indicates visible symptoms. The type of the observed disease is indicated by the colour bar (colour code as defined in Fig. 1a). Further time series for different sets of parameters can be found in the supplement. Bottom panel: histograms of disease incidences for different values of d.
Figure 4
Figure 4
Dependence of the observed cases on the fraction of active inputs I. For the upper figure, the clustering parameter was set to d=1 which means that all defective nodes form one cluster. Contrarily, in the lower figure, the parameter was set to d=0, leading to a broad distribution of the defective nodes. For each parameter combination, the system was simulated 100 times for 1000 time steps. The colour code (as defined in Fig. 1a) indicates, which cases occurred in the time line. Here, Cx and Dx denote that the time line also contained the cases (A, B) or (A, B, C), respectively. Curves for other sets of parameters are provided in the supplement.
Figure 5
Figure 5
Dependence of the observed cases on the average position λ of inactive nodes. The colour code (as defined in Fig. 1a) indicates, which cases occurred in the time line. For the upper figure, the clustering parameter was set to d=1 which means that all defective nodes form one cluster. Contrarily, in the lower figure, the parameter was set to d=0, leading to a random distribution of the defective nodes. Results for other sets of parameters are provided in the supplement.
Figure 6
Figure 6
(Top) Detailed view of the state space evolution. Input states (left; sorted according to the binary number they represent) are converted into output states (phenotypes; right) by the network. The number of phenotypes is usually much smaller than the number of possible input states. Green indicates a trajectory in the healthy network, while orange indicates a trajectory in the disease network. (Bottom) Stylized views of the state space evolution for different values of a.

Similar articles

References

    1. Merskey H. Variable meanings for the definition of disease. J. Med. Philos. 1986;11:215–232. doi: 10.1093/jmp/11.3.215. - DOI - PubMed
    1. Margolis J. Thoughts on definitions of disease. J. Med. Philos. 1986;11:233–236. doi: 10.1093/jmp/11.3.233. - DOI - PubMed
    1. Cooper R. Disease. Stud. Hist. Philos. Sci. C. 2002;33:263–282.
    1. Ereshefsky M. Defining ‘health’ and ‘disease’. Stud. Hist. Philos. Sci. C. 2009;40:221–227. - PubMed
    1. Pearce J. Disease, diagnosis or syndrome? Pract. Neurol. 2011;11:91–97. doi: 10.1136/jnnp.2011.241802. - DOI - PubMed

Publication types