. 2022 Nov 19;13(1):7099.
doi: 10.1038/s41467-022-34911-4.

The non-catalytic role of DNA polymerase epsilon in replication initiation in human cells

Affiliations

The non-catalytic role of DNA polymerase epsilon in replication initiation in human cells

Sameera Vipat et al. Nat Commun. .

Abstract

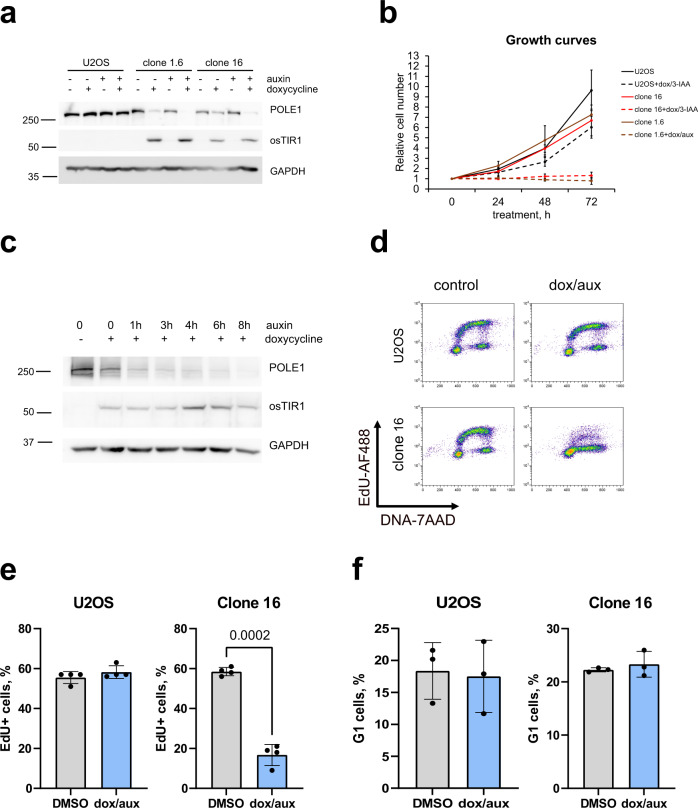
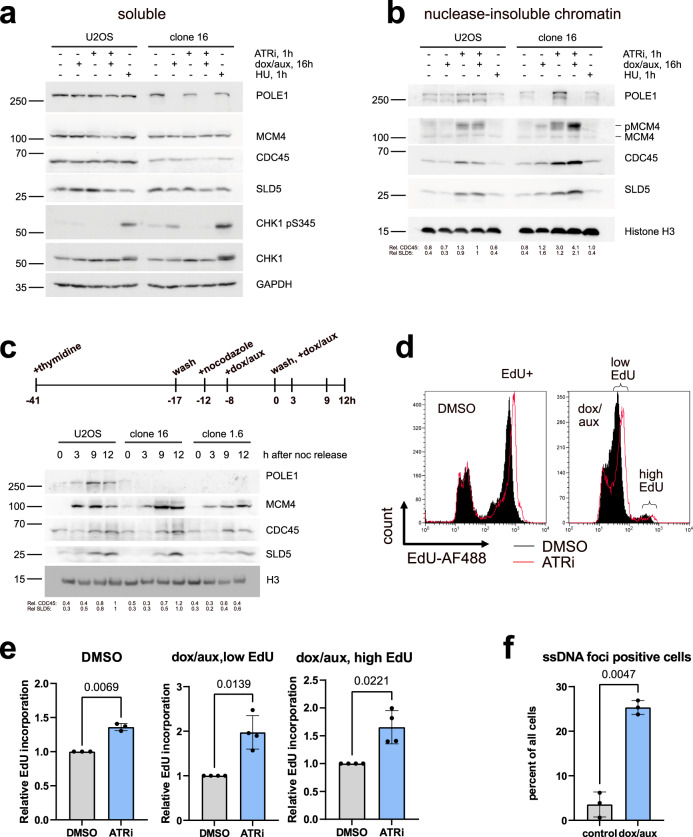
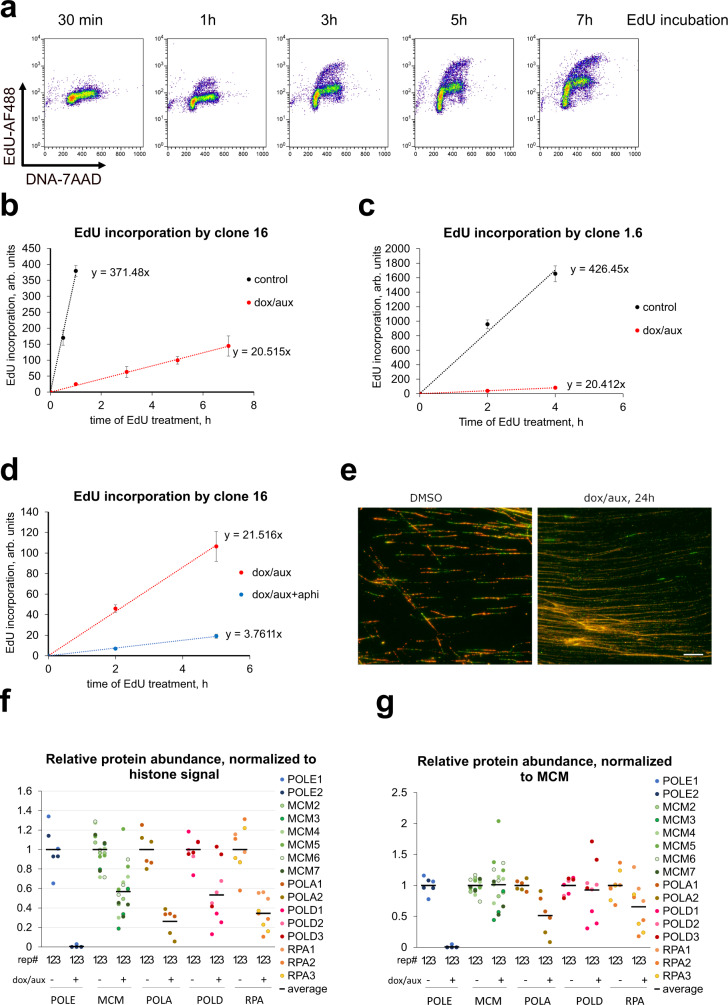
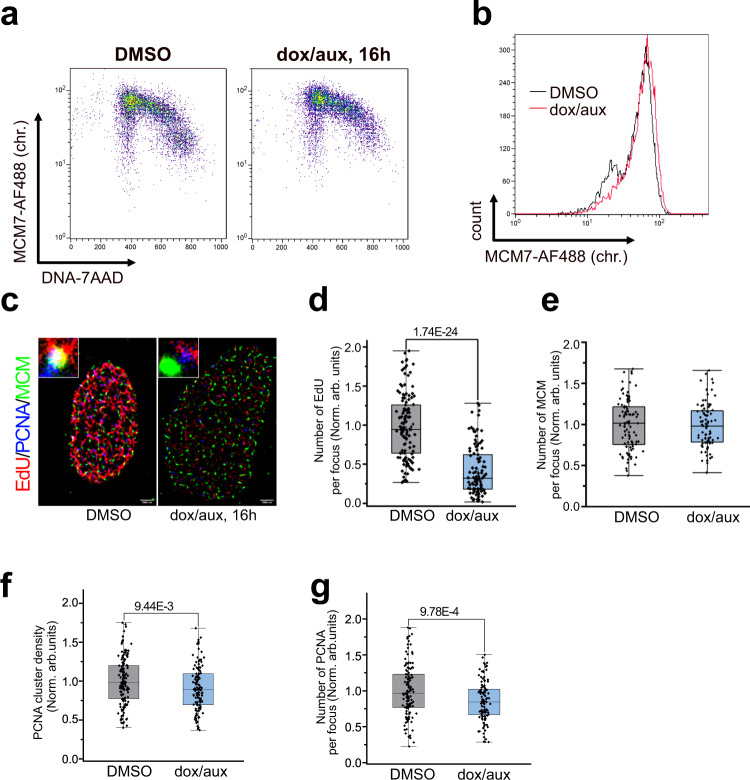
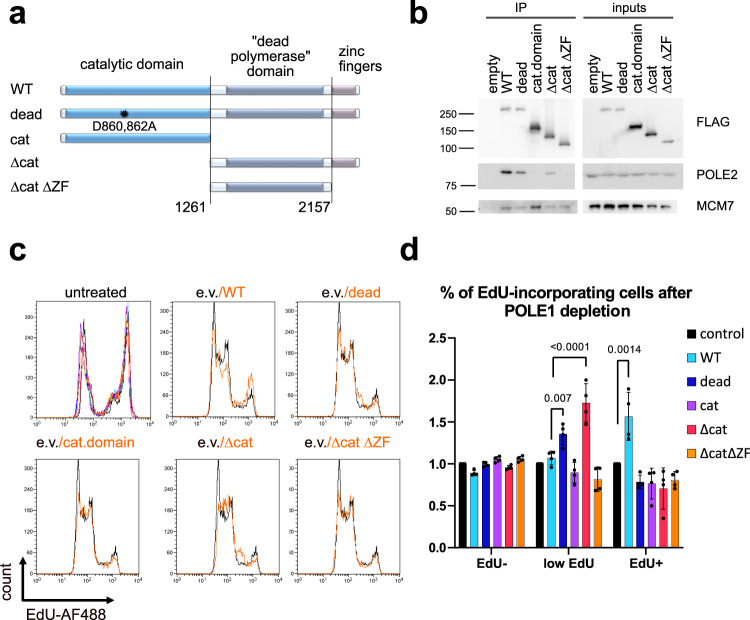
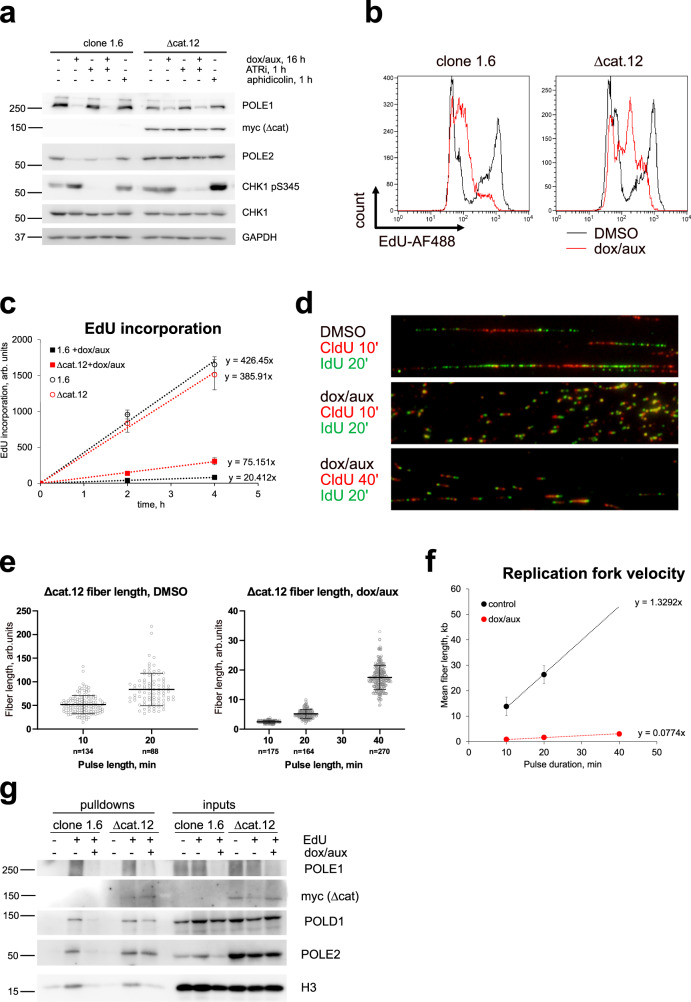
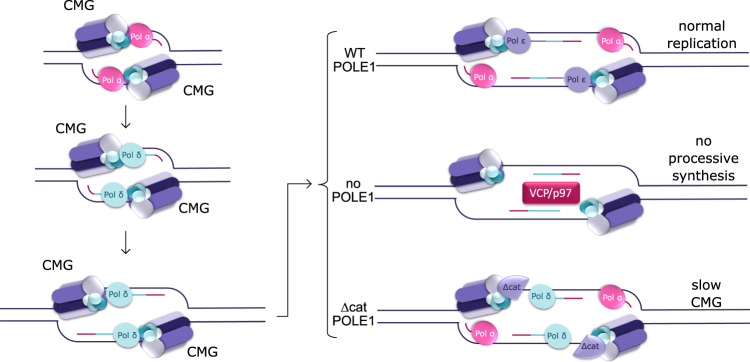
DNA polymerase epsilon (PolE) in an enzyme essential for DNA replication. Deficiencies and mutations in PolE cause severe developmental abnormalities and cancers. Paradoxically, the catalytic domain of yeast PolE catalytic subunit is dispensable for survival, and its non-catalytic essential function is linked with replicative helicase (CMG) assembly. Less is known about the PolE role in replication initiation in human cells. Here we use an auxin-inducible degron system to study the effect of POLE1 depletion on replication initiation in U2OS cells. POLE1-depleted cells were able to assemble CMG helicase and initiate DNA synthesis that failed shortly after. Expression of POLE1 non-catalytic domain rescued this defect resulting in slow, but continuous DNA synthesis. We propose a model where in human U2OS cells POLE1/POLE2 are dispensable for CMG assembly, but essential during later steps of replication initiation. Our study provides some insights into the role of PolE in replication initiation in human cells.


Conflict of interest statement

The authors declare no competing interests.

Figures

Fig. 1
Fig. 1. Creating and characterizing a cell line expressing mAID-tagged polE1.
a Wild-type U2OS, homozygous mAID-KI clones 16 and 1.6 were treated for 24 h with doxycycline, auxin, or both, as indicated, western blots of total cell lysates are shown. b Equal numbers or wild-type U2OS, or homozygous mAID-KI clones 16 or 1.6, were seeded on 60 mm dishes and treated with DMSO or dox/aux for 72 h. The data are depicted as mean + SD from n = 3 independent experiments. c Clone 16 was treated with doxycycline overnight (16 h), auxin was added for the indicated times; western blots of total cell lysates are shown. df Wild-type U2OS, homozygous mAID-KI clone 16 were treated for 24 h with DMSO or dox/aux, 10 µM EdU was added for the last 30 min of treatment. d Flow cytometry plots showing EdU incorporation and DNA content (7-AAD staining) are shown. e, f Quantification of the flow cytometry data is shown—mean + SD from n = 3 independent experiments. Paired t-test was used for statistical analyses, p values are shown where they are statistically significant. e EdU+ cells were quantified based on EdU signal being above G1 and G2 levels. f Cells were assigned to G1 based on DNA content of 2n and being EdU negative. Source data are provided as a Source data file.
Fig. 2
Fig. 2. Origin firing in POLE1-depleted cells.
a, b Wild-type U2OS or homozygous mAID-KI clone 16 were treated for 16 h with DMSO or dox/aux, 5 µM ATRi was added to the indicated samples for 1 h, followed by cell lysis and the isolation of the insoluble chromatin fraction. Equal amounts of protein were loaded. Western blot of the soluble lysates (a) and insoluble chromatin fraction (b) is shown. 1 h hydroxyurea (HU, 2 mM) treatment was used as a positive control for replication stress. The second band on POLE1 blot (b) likely represents partially degraded protein. Specific signals of SLD5 and CDC45 were quantified by Fiji/ImageJ. c Indicated cell lines were synchronized by thymidine/nocodazole blocks and treated with dox/aux as indicated. Western blot analysis of chromatin from the cells collected at the indicated timepoints is shown. Equal amounts of protein were loaded. Specific signals of SLD5 and CDC45 were quantified by Fiji/ImageJ. d, e Clone 16 cells were treated for 16 h with DMSO or dox/aux as indicated, DMSO or 5 µM ATRi was added to the indicated samples for 60 min before harvest, 10 µM EdU was added for the last 30 min of treatment. Flow cytometry plots showing EdU incorporation histograms (c) and relative EdU incorporation, normalized to the samples without ATRi, are shown (d)—mean + SD from n = 3 (DMSO) or n = 4 (dox/aux) independent experiments. Paired t-test was used for statistical analyses, p values are shown. f Clone 16 cells were incubated with 10 µM CldU for 48 h, DMSO or dox/aux were added for the last 16 h of treatment. After CSK extraction, cells were fixed and stained with anti-CldU antibodies under native conditions. Quantification of ssDNA-positive cells is shown—mean + SD from n = 3 independent experiments. Paired t-test was used for statistical analyses, p value is shown. Source data are provided as a Source data file.
Fig. 3
Fig. 3. The effect of POLE1 depletion on DNA synthesis.
ad Clone 16 (a, b, d) or clone 1.6 (c) cells were treated for 16 h with dox/aux, followed by 10 µM EdU additional for the indicated times. For (d) 2 µM aphidicolin was added 1 h before the start of the EdU pulses. Flow cytometry plots showing EdU incorporation and DNA content (a) or EdU incorporation quantifications (bd) are shown. Quantification is based on four (b) or three (c, d) independent experiments, means and standard deviations are shown, dox-resistant population was disregarded for the quantification. e Clone 16 cells were treated for 24 h with DMSO or dox/aux. Ongoing replication was labeled with 10 min pulse of CldU (red) followed by 20 min pulse of IdU (green) and visualized using DNA fiber analysis, as described in “Methods”. Scale bar is 10 μm. f, g Clone 16 cells were treated for 16 h with DMSO or dox/aux, followed by 10 min EdU pulse and iPOND isolation of protein, associated with nascent DNA, and mass-spectrometry. The signal was normalized to average signal of histones (f) or MCM subunits (g) in each sample, and to respective DMSO-treated samples. The means from n = 3 experimental replicates for each group are shown as horizontal black lines. Source data are provided as a Source data file.
Fig. 4
Fig. 4. MCM on chromatin after POLE1 depletion.
a, b Clone 16 cells were treated for 16 h with DMSO or dox/aux, followed chromatin extraction and MCM7 immunostaining. Flow cytometry plots of DNA/MCM7 staining (a) or MCM7 histograms (b) are shown. cg Clone 16 cells treated for 16 h with DMSO or dox/aux were pulse labeled with thymidine analog EdU for 15 min prior to processing for super-resolution imaging. Representative multicolor super-resolution images (c) of PCNA (blue), MCM (green), and extent of EdU (red) incorporation in S-phase nuclei. Scale bar, 1500 nm. Quantitation of EdU (d) and MCM (e) detected per focus normalized to DMSO-treated clone 16 control, based on at least 3 independent experiments (For EdU per focus, n = 131, 109, and for MCM per focus n = 95, 83 for DMSO and dox/aux treated clone 16 cells. Student’s t-test was used for analyses, mean + SD and the p values are shown. Quantitation of PCNA detected per focus (f) and PCNA clusters (g), normalized to DMSO-treated clone 16 cells based on at least 2 independent experiments. (PCNA per focus, n = 126, 106; PCNA cluster density, n = 139, 120; student’s t-test was used for analyses, mean + SD and p values are shown). Source data are provided as a Source data file.
Fig. 5
Fig. 5. C-terminal non-catalytic part of POLE1 is critical for replication initiation.
a Schematic representation of POLE1 constructs used in the study: wild-type protein, catalytically dead protein with mutations D860A, D862A, catalytic domain of POLE1 (aa1–1261), C-terminal half of POLE1 (without the catalytic domain, aa 1262–2305), C-terminal part of POLE1 without the zinc-finger domain (aa 1261–2151). b 293FT cells were transfected with an empty vector or the constructs described in panel a, fused to FLAG tags at their N termini. 48 h later cells were lysed and FLAG-tagged proteins were immunoprecipitated using M2 agarose beads, followed by elution with FLAG peptide. Western blots of the eluted protein and input samples are shown. c, d Clone 16 cells were transfected with indicated constructs. 32 h later dox/aux or DMSO was added to the cells for 16 h. 10 µM EdU was added for the last 30 min. Flow cytometry histograms of the EdU incorporation are shown (c). The first panel shows the transfected untreated samples, colors match the legend on 2D, the other panels represent samples treated with dox/aux for 16 h. Comparisons of samples transfected with indicated constructs (orange) to the sample transfected with an empty vector (black) are shown (c). d Quantification of the percent of cells in the dox/aux treated cells, corresponding to the indicated fractions, normalized to the empty vector control, are shown. Fractions were gated as indicated in Fig. S2. The quantification is based on n = 4 independent experimental repeats (means + SD and p values are shown where they are significant. One-way ANOVA was used for statistical analyses). Source data are provided as a Source Data file.
Fig. 6
Fig. 6. DNA replication-dependent on the C-terminal non-catalytic domain of POLE1.
ac Clone 1.6 homozygous mAID-KI cells (1.6) or clone 1.6 stably expressing myc-FLAG-Δcat - clone 12 (Δcat.12) were treated for 16 h with DMSO or dox/aux. a 5 µM ATRi was added to the indicated samples for 1 h. Western blot of the whole cell lysates is shown. 1 h aphidicolin (2 µM) treatment was used as a positive control for replication stress. b, c EdU was added for the last 30 min (b) or 2–4 h (c) of treatment, flow cytometry histograms of EdU incorporation (b) or EdU incorporation quantifications (c) are shown. Quantification is based on n = 3 independent experiments, means + SD are shown, dox-resistant population was disregarded for quantification. df Δcat.12 cells were treated for 16 h with DMSO or dox/aux. Ongoing replication was labeled with 10- or 40-min pulse of CldU followed by 20 min pulse of IdU and visualized using DNA fiber analysis, as described in “Methods”. Representative images (d), individual fiber lengths from a representative experiment (mean and SD) (e), and mean fiber lengths (based on n = 3 experimental repeats) and SD of the means (f), are shown. g Clone 1.6 and Δcat.12 cells were treated for 16 h with DMSO or dox/aux, followed by 10 min EdU pulse (where indicated) and iPOND isolation of proteins, associated with nascent DNA. Western blot analyses of the inputs and pulldown samples are shown. Source data are provided as a Source data file.
Fig. 7
Fig. 7. Proposed model of DNA replication initiation in human cells with and without POLE1, as well as in presence of Δcat.
POLE may be present at the early stages of origin firing, but according to our data it is not necessary. Under normal conditions, POLE replaces POLD as a leading strand polymerase. In the absence of POLE, DNA synthesis fails at the polymerase switch step. Non-catalytic C-terminal domain of POLE1 is sufficient to proceed to replication elongation, in this case, POLD assumes the role of the leading strand polymerase, but the speed of DNA synthesis is much slower.

References

    1. Moiseeva TN, Bakkenist CJ. Regulation of the initiation of DNA replication in human cells. DNA Repair. 2018;72:99–106. doi: 10.1016/j.dnarep.2018.09.003. - DOI - PMC - PubMed
    1. Zhou Z-X, Lujan SA, Burkholder AB, Garbacz MA, Kunkel TA. Roles for DNA polymerase δ in initiating and terminating leading strand DNA replication. Nat. Commun. 2019;10:3992. doi: 10.1038/s41467-019-11995-z. - DOI - PMC - PubMed
    1. Aria, V. & Yeeles, J. T. P. Mechanism of bidirectional leading-strand synthesis establishment at eukaryotic DNA replication origins. Mol. Cell10.1016/j.molcel.2018.10.019 (2018). - PMC - PubMed
    1. Garbacz MA, et al. Evidence that DNA polymerase δ contributes to initiating leading strand DNA replication in Saccharomyces cerevisiae. Nat. Commun. 2018;9:858. doi: 10.1038/s41467-018-03270-4. - DOI - PMC - PubMed
    1. Zhou JC, et al. CMG-Pol epsilon dynamics suggests a mechanism for the establishment of leading-strand synthesis in the eukaryotic replisome. Proc. Natl Acad. Sci. USA. 2017;114:4141–4146. doi: 10.1073/pnas.1700530114. - DOI - PMC - PubMed

Publication types