. 2022 Nov 19;5(1):1271.
doi: 10.1038/s42003-022-04237-4.

The link between liver fat and cardiometabolic diseases is highlighted by genome-wide association study of MRI-derived measures of body composition

Affiliations

The link between liver fat and cardiometabolic diseases is highlighted by genome-wide association study of MRI-derived measures of body composition

Dennis van der Meer et al. Commun Biol. .

Abstract

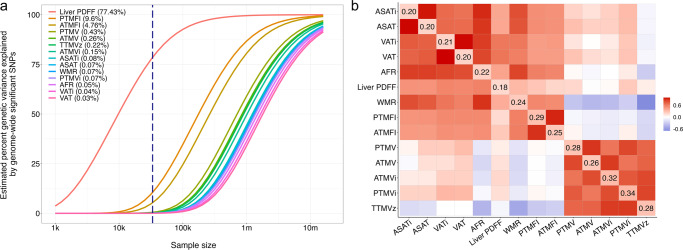
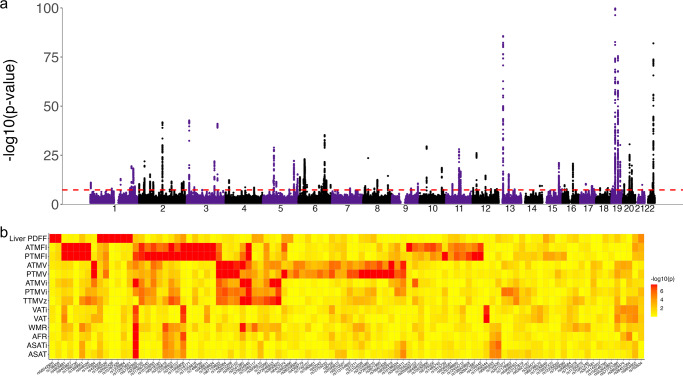
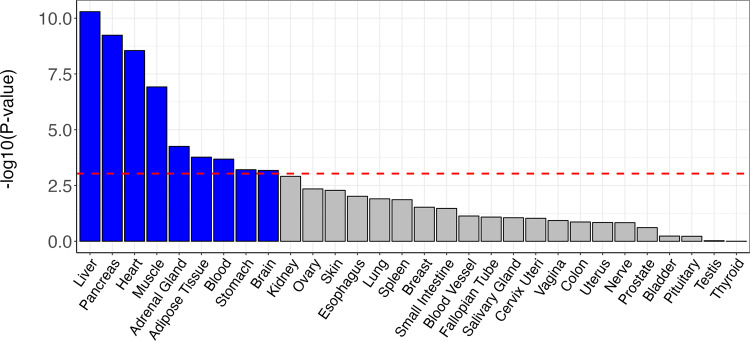
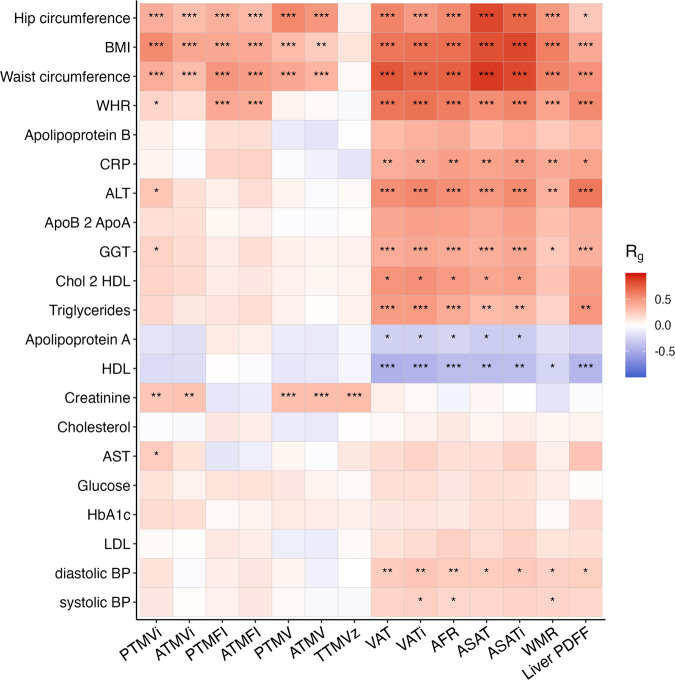
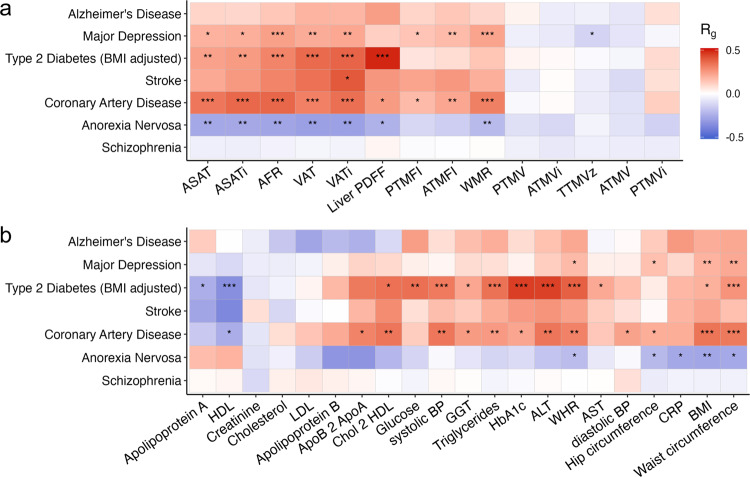
Obesity and associated morbidities, metabolic associated fatty liver disease (MAFLD) included, constitute some of the largest public health threats worldwide. Body composition and related risk factors are known to be heritable and identification of their genetic determinants may aid in the development of better prevention and treatment strategies. Recently, large-scale whole-body MRI data has become available, providing more specific measures of body composition than anthropometrics such as body mass index. Here, we aimed to elucidate the genetic architecture of body composition, by conducting genome-wide association studies (GWAS) of these MRI-derived measures. We ran both univariate and multivariate GWAS on fourteen MRI-derived measurements of adipose and muscle tissue distribution, derived from scans from 33,588 White European UK Biobank participants (mean age of 64.5 years, 51.4% female). Through multivariate analysis, we discovered 100 loci with distributed effects across the body composition measures and 241 significant genes primarily involved in immune system functioning. Liver fat stood out, with a highly discoverable and oligogenic architecture and the strongest genetic associations. Comparison with 21 common cardiometabolic traits revealed both shared and specific genetic influences, with higher mean heritability for the MRI measures (h2 = .25 vs. .13, p = 1.8x10⁻⁷). We found substantial genetic correlations between the body composition measures and a range of cardiometabolic diseases, with the strongest correlation between liver fat and type 2 diabetes (rg = .49, p = 2.7x10⁻²²). These findings show that MRI-derived body composition measures complement conventional body anthropometrics and other biomarkers of cardiometabolic health, highlighting the central role of liver fat, and improving our knowledge of the genetic architecture of body composition and related diseases.


Conflict of interest statement

The authors declare the following competing interests: O.A.A. has received speaker’s honorarium from Lundbeck and is a consultant to HealthLytix. J.L. and O.D.L. are employed by and stockholders in AMRA Medical, and R.S. was previously employed by AMRA medical. T.H.K. received consultancy fees from Intercept and Engitix and speaker fees from Novartis, Gilead and AlfaSigma. A.M.D. is a Founder of and holds equity in CorTechs Labs, Inc., and serves on its Scientific Advisory Board. He is a member of the Scientific Advisory Board of Human Longevity, Inc. and receives funding through research agreements with General Electric Healthcare and Medtronic, Inc. The terms of these arrangements have been reviewed and approved by UCSD in accordance with its conflict of interest policies. The remaining authors declare no competing interests.

Figures

Fig. 1
Fig. 1. Comparison of the genetic architecture of individual body composition measures.
a The relation between genetic variance explained by genome-wide significant hits (y-axis) and sample size (x-axis) for each measure (solid-colored lines). The vertical dashed blue line marks the current sample size, with the corresponding percent genetic variance explained indicated between brackets in the legend. b Correlation between the measures, with phenotypic correlation shown in lower-left section and genetic correlation in the upper-right section, and heritability on the diagonal. Abbreviations: ASAT abdominal subcutaneous adipose tissue, VAT visceral adipose tissue, AFR abdominal fat ratio, WMR weight-muscle-ratio, ATMV anterior thigh muscle volume, PTMV posterior thigh muscle volume, ATMFI anterior thigh muscle fat infiltration, PTMFI posterior thigh muscle fat infiltration, Liver PDFF liver proton density fat fraction, TTMVz total thigh muscle volume z-score, i index, referring to a measure divided by standing height.
Fig. 2
Fig. 2. Multivariate locus discovery.
a Manhattan plot of the multivariate GWAS on all MRI-derived body composition measures, with the observed −log10(p) of each SNP shown on the y-axis. The x-axis shows the relative genomic location, grouped by chromosome, and the red dashed line indicates the whole-genome significance threshold of 5 × 108. The y-axis is clipped at −log10(p) = 75. b Heatmap showing −log10(p) of the association between the lead variants of MOSTest-identified independent loci (x-axis) and each of the individual MRI measures (y-axis). The values are capped at 7.5 (p = 5 × 10−8).
Fig. 3
Fig. 3. Tissue-specific differential expression of the set of significant genes identified through the multivariate GWAS on MRI-derived measures of body composition.
The red-dotted line indicates the multiple comparisons-corrected significance threshold.
Fig. 4
Fig. 4. Genetic correlations of the MRI-derived body composition measures with standard anthropometrics and cardiometabolic measures.
Abbreviations: BMI body mass index, WHR waist-hip ratio, CRP C-reactive protein, ALT alanine aminotransferase, GGT gamma-glutamyl transferase, HDL high-density lipoproteins, AST aspartate aminotransferase, HbA1c glycated hemoglobin, LDL low-density lipoproteins, BP blood pressure. ***p = 5 × 10−9, **p = 5 × 10−6, *p = 5 × 10−4.
Fig. 5
Fig. 5. Genetic correlations with conditions linked to poor cardiometabolic health.
a Correlations for MRI-derived body composition measures on the x-axis. b These correlations for anthropometric and metabolic measure (x-axis) with conditions linked to poor cardiometabolic health (y-axis). ***p = 5 × 10−9, **p = 5 × 10−6, *p = 5 × 10−4.

Similar articles

Cited by

References

    1. Heymsfield SB, Wadden TA. Mechanisms, pathophysiology, and management of obesity. N. Engl. J. Med. 2017;376:254–266. doi: 10.1056/NEJMra1514009. - DOI - PubMed
    1. Ralston J, Nugent R. Toward a broader response to cardiometabolic disease. Nat. Med. 2019;25:1644–1646. doi: 10.1038/s41591-019-0642-9. - DOI - PubMed
    1. Aguilar M, Bhuket T, Torres S, Liu B, Wong RJ. Prevalence of the metabolic syndrome in the United States, 2003-2012. J. Am. Med. Assoc. 2015;313:1973–1974. doi: 10.1001/jama.2015.4260. - DOI - PubMed
    1. Mendrick DL, et al. Metabolic syndrome and associated diseases: from the bench to the clinic. Toxicol. Sci. 2018;162:36–42. doi: 10.1093/toxsci/kfx233. - DOI - PMC - PubMed
    1. Eckel RH, Alberti KGMM, Grundy SM, Zimmet PZ. The metabolic syndrome. Lancet. 2010;375:181–183. doi: 10.1016/S0140-6736(09)61794-3. - DOI - PubMed

Publication types