

In situ monitoring of Lentilactobacillus parabuchneri biofilm formation via real-time infrared spectroscopy
- PMID: 36402858
- PMCID: PMC9675856
- DOI: 10.1038/s41522-022-00353-5
In situ monitoring of Lentilactobacillus parabuchneri biofilm formation via real-time infrared spectroscopy
Abstract
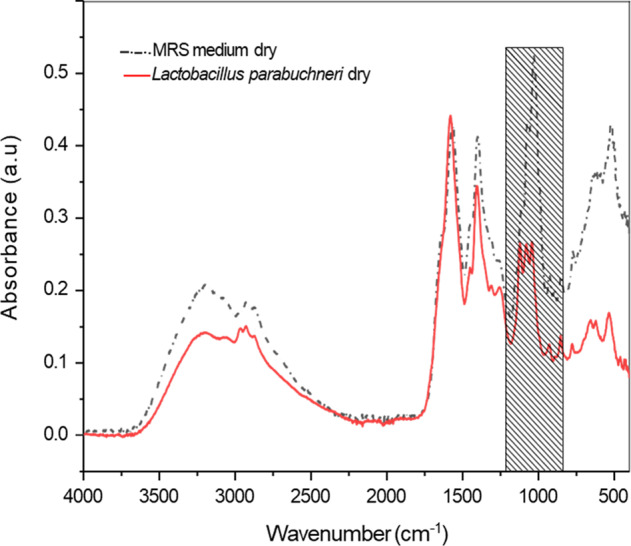
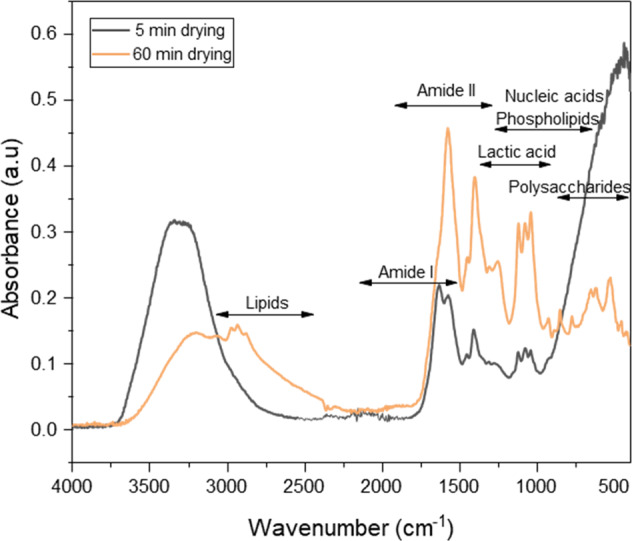
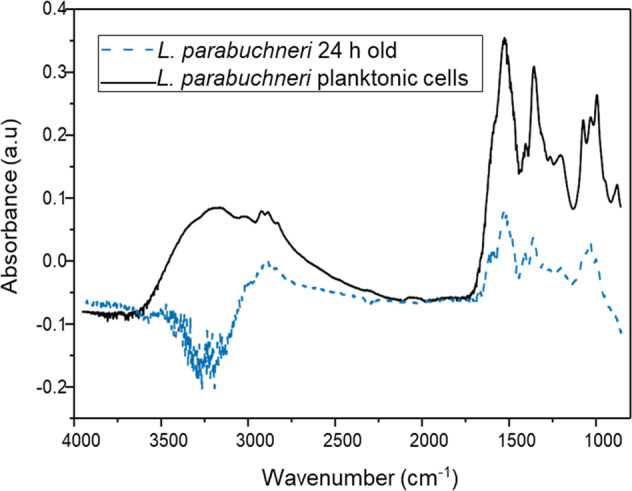
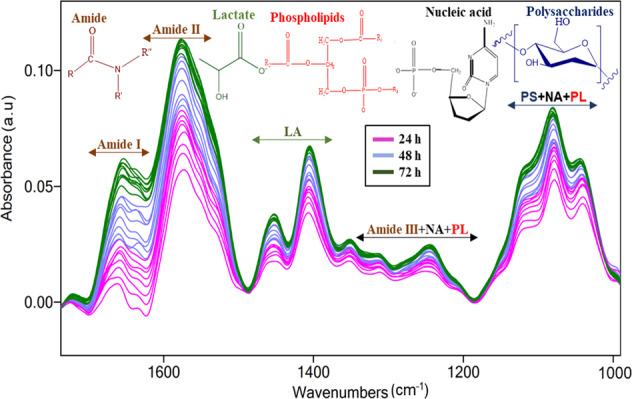
Foodborne pathogenic microorganisms form biofilms at abiotic surfaces, which is a particular challenge in food processing industries. The complexity of biofilm formation requires a fundamental understanding on the involved molecular mechanisms, which may then lead to efficient prevention strategies. In the present study, biogenic amine producing bacteria, i.e., Lentilactobacillus parabuchneri DSM 5987 strain isolated from cheese were studied in respect with biofilm formation, which is of substantial relevance given their contribution to the presence of histamine in dairy products. While scanning electron microscopy was used to investigate biofilm adhesion at stainless steel surfaces, in situ infrared attenuated total reflection spectroscopy (IR-ATR) using a custom flow-through assembly was used for real-time and non-destructive observations of biofilm formation during a period of several days. The spectral window of 1700-600 cm-1 provides access to vibrational signatures characteristic for identifying and tracking L. parabuchneri biofilm formation and maturation. Especially, the amide I and II bands, lactic acid produced as the biofilm matures, and a pronounced increase of bands characteristic for extracellular polymeric substances (EPS) provide molecular insight into biofilm formation, maturation, and changes in biofilm architecture. Finally, multivariate data evaluation strategies were applied facilitating the unambiguous classification of the observed biofilm changes via IR spectroscopic data.
© 2022. The Author(s).
Conflict of interest statement
The authors declare no competing interests.
Figures


Similar articles
-
Antimicrobial Efficiency of Chitosan and Its Methylated Derivative against Lentilactobacillus parabuchneri Biofilms.Molecules. 2022 Dec 7;27(24):8647. doi: 10.3390/molecules27248647. Molecules. 2022. PMID: 36557784 Free PMC article.
-
Rapid discrimination of Lentilactobacillus parabuchneri biofilms via in situ infrared spectroscopy.Spectrochim Acta A Mol Biomol Spectrosc. 2024 Jan 5;304:123391. doi: 10.1016/j.saa.2023.123391. Epub 2023 Sep 9. Spectrochim Acta A Mol Biomol Spectrosc. 2024. PMID: 37714102
-
Cyclic Changes in the Amide Bands Within Escherichia coli Biofilms Monitored Using Real-Time Infrared Attenuated Total Reflection Spectroscopy (IR-ATR).Appl Spectrosc. 2019 Apr;73(4):424-432. doi: 10.1177/0003702819829081. Epub 2019 Feb 20. Appl Spectrosc. 2019. PMID: 30654633
-
A novel MIR imaging approach for precise detection of S. epidermidis biofilms in seconds.Biofilm. 2025 Mar 6;9:100270. doi: 10.1016/j.bioflm.2025.100270. eCollection 2025 Jun. Biofilm. 2025. PMID: 40130066 Free PMC article. Review.
-
Polymicrobial biofilms related to dental implant diseases: unravelling the critical role of extracellular biofilm matrix.Crit Rev Microbiol. 2023 May;49(3):370-390. doi: 10.1080/1040841X.2022.2062219. Epub 2022 May 18. Crit Rev Microbiol. 2023. PMID: 35584310 Review.
Cited by
-
Global biochemical profiling of fast-growing Antarctic bacteria isolated from meltwater ponds by high-throughput FTIR spectroscopy.PLoS One. 2024 Jun 17;19(6):e0303298. doi: 10.1371/journal.pone.0303298. eCollection 2024. PLoS One. 2024. PMID: 38885224 Free PMC article.
-
Antimicrobial Efficiency of Chitosan and Its Methylated Derivative against Lentilactobacillus parabuchneri Biofilms.Molecules. 2022 Dec 7;27(24):8647. doi: 10.3390/molecules27248647. Molecules. 2022. PMID: 36557784 Free PMC article.
-
Characterization of the Biofilms Formed by Histamine-Producing Lentilactobacillus parabuchneri Strains in the Dairy Environment.Foods. 2023 Apr 3;12(7):1503. doi: 10.3390/foods12071503. Foods. 2023. PMID: 37048324 Free PMC article.
-
Development of super nanoantimicrobials combining AgCl, tetracycline and benzalkonium chloride.Discov Nano. 2024 Jun 11;19(1):100. doi: 10.1186/s11671-024-04043-3. Discov Nano. 2024. PMID: 38861141 Free PMC article.
-
Label-free analysis of biofilm phenotypes by infrared micro- and correlation spectroscopy.Anal Bioanal Chem. 2023 Jul;415(17):3515-3523. doi: 10.1007/s00216-023-04741-4. Epub 2023 May 16. Anal Bioanal Chem. 2023. PMID: 37193875
References
-
- Sánchze ÓJ, Barragán PJ, Serna L. Review of Lactobacillus in the food industry and their culture media. Rev. Colomb. Biotecnol. 2019;21:63–76. doi: 10.15446/rev.colomb.biote.v21n2.81576. - DOI
-
- Halász A, Baráth Á, Simon-Sarkadi L, Holzapfel W. Biogenic amines and their production by microorganisms in food. Trends Food Sci. Technol. 1994;5:42–49. doi: 10.1016/0924-2244(94)90070-1. - DOI
-
- Ladero V, Calles-Enriquez M, Fernandez M, Alvarez AM. Toxicological effects of dietary biogenic amines. Curr. Nutr. Food Sci. 2010;6:145–156. doi: 10.2174/157340110791233256. - DOI
-
- Ladero V, Fernández M, Alvarez MA. Effect of post-ripening processing on the histamine and histamine-producing bacteria contents of different cheeses. Int. Dairy J. 2009;19:759–762. doi: 10.1016/j.idairyj.2009.05.010. - DOI
Publication types
MeSH terms
Substances
Supplementary concepts
LinkOut - more resources
Full Text Sources
Molecular Biology Databases
Miscellaneous
