. 2022 Nov 19;12(1):19933.
doi: 10.1038/s41598-022-24267-6.

Increased biventricular hemodynamic forces in precapillary pulmonary hypertension

Affiliations

Increased biventricular hemodynamic forces in precapillary pulmonary hypertension

Karin Pola et al. Sci Rep. .

Abstract

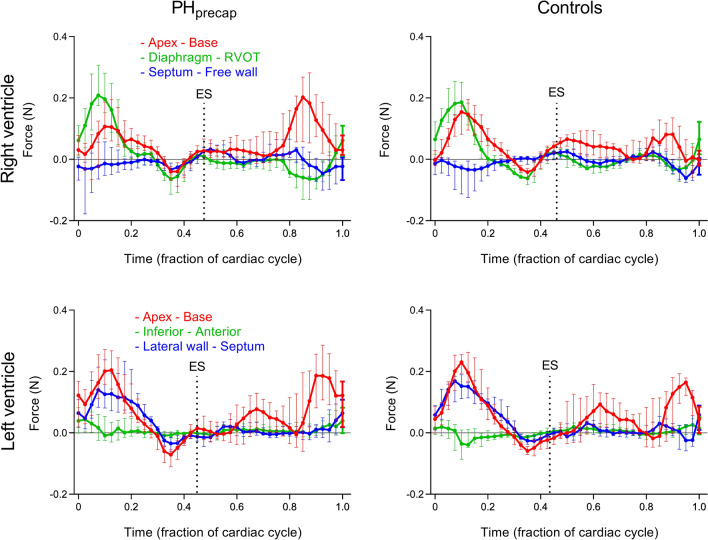
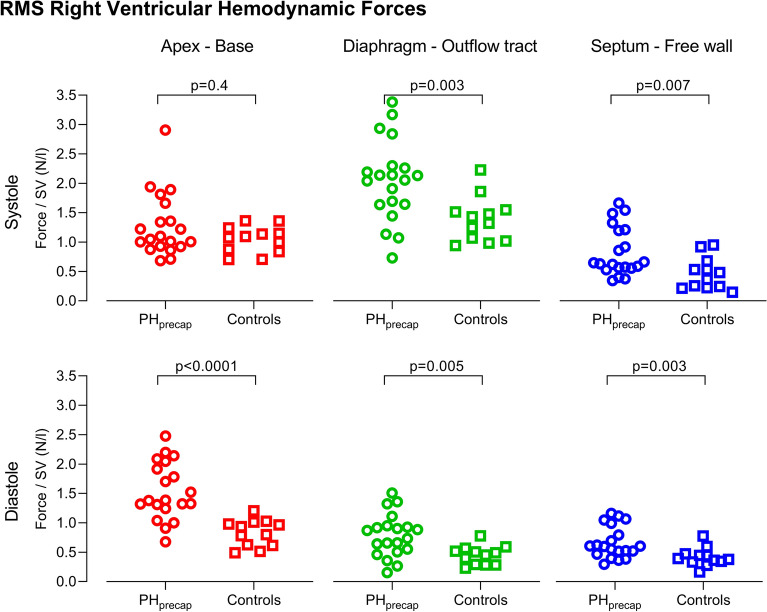
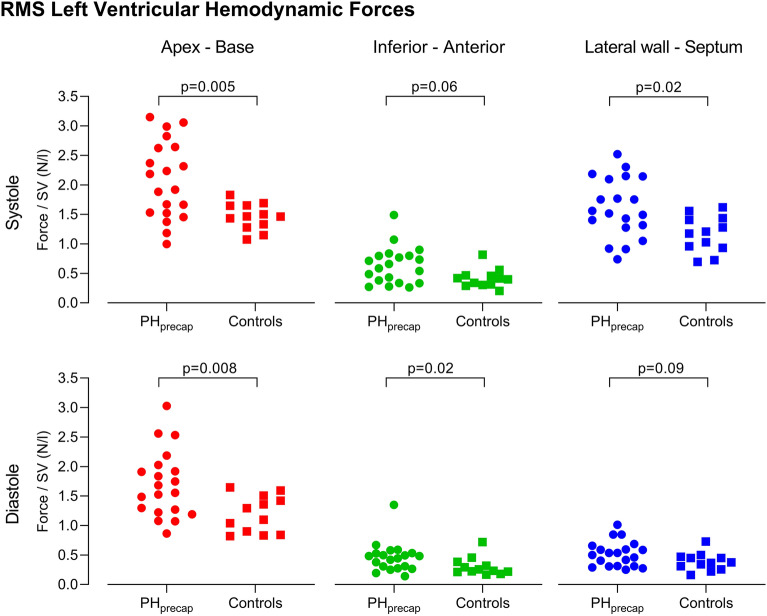
Precapillary pulmonary hypertension (PHprecap) is a condition with elevated pulmonary vascular pressure and resistance. Patients have a poor prognosis and understanding the underlying pathophysiological mechanisms is crucial to guide and improve treatment. Ventricular hemodynamic forces (HDF) are a potential early marker of cardiac dysfunction, which may improve evaluation of treatment effect. Therefore, we aimed to investigate if HDF differ in patients with PHprecap compared to healthy controls. Patients with PHprecap (n = 20) and age- and sex-matched healthy controls (n = 12) underwent cardiac magnetic resonance imaging including 4D flow. Biventricular HDF were computed in three spatial directions throughout the cardiac cycle using the Navier-Stokes equations. Biventricular HDF (N) indexed to stroke volume (l) were larger in patients than controls in all three directions. Data is presented as median N/l for patients vs controls. In the RV, systolic HDF diaphragm-outflow tract were 2.1 vs 1.4 (p = 0.003), and septum-free wall 0.64 vs 0.42 (p = 0.007). Diastolic RV HDF apex-base were 1.4 vs 0.87 (p < 0.0001), diaphragm-outflow tract 0.80 vs 0.47 (p = 0.005), and septum-free wall 0.60 vs 0.38 (p = 0.003). In the LV, systolic HDF apex-base were 2.1 vs 1.5 (p = 0.005), and lateral wall-septum 1.5 vs 1.2 (p = 0.02). Diastolic LV HDF apex-base were 1.6 vs 1.2 (p = 0.008), and inferior-anterior 0.46 vs 0.24 (p = 0.02). Hemodynamic force analysis conveys information of pathological cardiac pumping mechanisms complementary to more established volumetric and functional parameters in precapillary pulmonary hypertension. The right ventricle compensates for the increased afterload in part by augmenting transverse forces, and left ventricular hemodynamic abnormalities are mainly a result of underfilling rather than intrinsic ventricular dysfunction.


Conflict of interest statement

The authors declare no competing interests.

Figures

Figure 1
Figure 1
Right ventricular outflow tract in one patient with precapillary pulmonary hypertension: relative pressure gradients, hemodynamic forces and flow. (A) The colored field illustrates the relative pressure gradients. Local hemodynamic forces are illustrated with white arrows, with direction and magnitude indicated for each point. (B) The global force (white arrow) is a sum of all local forces and drives the blood flow (red arrow) towards the pulmonary artery during systole. (C) By the end of systole, the global force is directed in the opposite direction of the flow, thereby decelerating the blood. The global force is analyzed in three directions for each ventricle (Fig. 2).
Figure 2
Figure 2
Definition of the intraventricular three-dimensional directions, using an orientation system previously described. (A) Semi-automatic definition of the atrioventricular (AV) plane in end diastole by manually marking the AV junction points (white crosses) in the long-axis views, and thereafter an automatic construction of a two-dimensional plane fitted to the points. The apex-base direction is defined as perpendicular to the AV-plane. (B) and (C) The lateral wall-septum direction is perpendicular to the apex-base axis, and aligned with the left ventricular outflow tract in the 3-chamber long-axis image. The inferior-anterior direction is perpendicular to both the apex-base and lateral wall-septum directions. The transverse directions were defined from the left ventricle (B) and translated to the right ventricle (C), resulting in parallel interventricular directions.
Figure 3
Figure 3
Right (top row) and left (bottom row) ventricular hemodynamic forces over one cardiac cycle in patients with precapillary pulmonary hypertension (PHprecap, left column) compared to healthy controls (right column). Force patterns are presented as median and interquartile range for each time point in all three directions respectively. Individual force curves for patients and controls are shown in Supplementary Figs. 2 (RV) and 6 (LV). ES, end systole; RVOT, right ventricular outflow tract.
Figure 4
Figure 4
Root mean square (RMS) right ventricular hemodynamic forces in patients with precapillary pulmonary hypertension (PHprecap, circles) compared to healthy controls (squares). RMS hemodynamic forces indexed to right ventricular stroke volume (SV) during systole (top row) and diastole (bottom row), in the apex-base direction (left column, red), diaphragm-outflow tract direction (middle column, green), and septum-free wall direction (right column, blue).
Figure 5
Figure 5
Root mean square (RMS) left ventricular hemodynamic forces in patients with precapillary pulmonary hypertension (PHprecap, circles) compared to healthy controls (squares). RMS hemodynamic forces indexed to left ventricular stroke volume (SV) during systole (top row) and diastole (bottom row), in the apex-base direction (left column, red), inferior-anterior direction (middle column, green), and lateral wall-septum direction (right column, blue).

Similar articles

Cited by

References

    1. Galiè N, et al. 2015 ESC/ERS Guidelines for the diagnosis and treatment of pulmonary hypertension. Eur. Heart J. 2016;37:67–119. doi: 10.1093/eurheartj/ehv317. - DOI - PubMed
    1. Van Wolferen SA, et al. Prognostic value of right ventricular mass, volume, and function in idiopathic pulmonary arterial hypertension. Eur. Heart J. 2007;28:1250–1257. doi: 10.1093/eurheartj/ehl477. - DOI - PubMed
    1. Addetia K, et al. Three-dimensional echocardiography-based analysis of right ventricular shape in pulmonary arterial hypertension. Eur. Heart J. Cardiovasc. Imaging. 2016;17:564–575. doi: 10.1093/ehjci/jev171. - DOI - PubMed
    1. Sjögren H, et al. Underfilling decreases left ventricular function in pulmonary arterial hypertension. Int. J. Cardiovasc. Imaging. 2021;37:1745–1755. doi: 10.1007/s10554-020-02143-6. - DOI - PMC - PubMed
    1. Bredfelt A, Rådegran G, Hesselstrand R, Arheden H, Ostenfeld E. Increased right atrial volume measured with cardiac magnetic resonance is associated with worse clinical outcome in patients with pre-capillary pulmonary hypertension. ESC Hear. Fail. 2018;5:865–876. - PMC - PubMed

Publication types